
Abstract
Deaths due to road accidents are a major concern to many stakeholders in Ghana especially because road accidents only come second behind malaria for cause of deaths. Statistical models can be helpful in evaluating the effect of factors responsible for mortality and morbidity during vehicular accidents. There is often a spoilt for choice on the type of models that may be used to explain a particular phenomenon. Picking a model can be based on the researcher’s knowledge or experience and the simplicity of the model. However, in common applications, the models applied are often not adequate to accurately and efficiently explain the underlying phenomenon particularly when it fails to address certain characteristics of the data. In this paper, an appropriate statistical model on the number of vehicular deaths in Ghana is fitted. The Poisson, Negative Binomial (NB), Zero-Inflation Poisson (ZIP) and Zero-Inflation Negative Binomial (ZINB) models, estimated by the method of maximum likelihood, are compared to determine the most appropriate model for the data at hand. In addition, due to the large number of explanatory variables, the backward model selection procedure was adopted to select the most significant factors associated with crash fatalities. After a careful model building process, the ZINB model was identified as the most appropriate for modelling road crash mortality. The model also identified factors such as shoulder type, time of crash, driver’s sex, road environment landmarks, among others as having significant effect on the fatalities during vehicular accidents in Ghana. It is recommended that authorities focus on installing reflective markings on the shoulders of roads and increase education of drivers in adhering to road regulations while also paying keen attention to road environmental landmarks.
Keywords
Introduction
Safety on the road is of paramount interest to various cities, regional and country administrators. The major objective of the departments responsible for road safety is often to reduce accidents to the barest minimum while ensuring that the number of people killed and injured victims of accidents on the road is as low as possible. To keep accidents on the road to a minimum, city administrators have often proposed and amended traffic regulations and invested in roads and road signs to avert the impacts of crashes.
The World Health Organization (WHO) in 2004 estimated the death and damage effects caused by roadway crashes to exceed 1.2 million with about 50 million persons injured. The WHO stipulates that, roadway traffic crashes which affects the young people of our societies are reported globally as a second cause of death followed by HIV/AIDS and tuberculosis. WHO in 2013, estimated that roadway traffic crashes costs most countries 1% to 3% of their Gross National Product. In Ghana, roadway crashes causes more death (as measured in human-years) than almost any other causes of death – falling behind malaria (National Roadway and Safety Commission (NRSC), 2012). It is reported that, an average of 1800 human lives are lost annually as result of roadway crashes. In Ghana alone, the number of roadway traffic crashes reported between the years 2001 to 2011 was 125,657 (NRSC, 2012). In these reported crash cases, 21,265 people lost their lives in motor-vehicle crashes. Also during this year interval, 63,867 victims sustained disabling-injury and 96,078 people had non-disabling injuries. In the year 2012, the reported number of roadway traffic crashes exceeded 1100 recording over 1800 number of deaths (NRSC, 2012).
The Directorate of Planning and Programmes of the NRSC has indicated that, driver error contributes about 80% of all roadway traffic crashes in Ghana with driver inattentiveness representing 28.1%, over-speeding 24.8% and lost-steering-control 23.4% (Ghana News Agency (GNA), 2013). The summary statistics by Motor Traffic and Transport Unit (MTTU) for the year 2013 reported the number of roadway crashes, the crash severity, number of person injured and the number of victims who lost their lives through those crashes for the various regions for the year. The MTTU has also over the past years identified certain critical crash black spots across the country. These sites includes Wulungu highway, Bolga – Sunbrungu – Navrongo highway, Bolga – Zuarungu – Bawku highway, Bolga – Tamale highway, Bolga – Navrongo highway, Mpaha highway, Chorgu highway, Kushegu highway, Kpong – Tamale highway, Agric – Gumani – Sankpala Highway, Josonawili town, Zuo highway, Dormaa Berekum highway, Techiman – Nkuranza road, Agbozume – Aflao highway, Tema motorway, Kanda highway, George Walker Bush highway, Secondi – Tarkwa highway, Apemanim – Elubo highway, Abuakwa highway, Abofour Junction, Kumasi – Obuasi highway, Kumasi – Offinso highway, and Nsawam – Accra highway (MTTU, 2013). The Building and Roadway Research Institute (BRRI, 2006) of the Council of Scientific and Industrial Research outlines the location of crash, the driver’s age and sex, the type of vehicle involved in the crash, the nature of the roadway, the weather conditions and also the day and time of crash as major causes of road traffic crashes.
Zhang (2011) reiterates that various factors such as traffic volumes, alcohol- impaired driving and no restraint use affect significantly crash occurrence with other variables such as the lane width, shoulder width, the light conditions, the weather and environmental conditions detected to have some level of influence on the occurrence of roadway crashes. Salifu (2004) and Oppong (2012), among other research conducted in Ghana, have focused on the frequency of road crashes on major roads in Ghana. The frequency of accidents have been attributed to the lack of traffic lights at major junctions, vehicle type (car or bus), the day and time of accident and age of victims amongst others. The number of fatalities associated with traffic crashes in Ghana is increasing with time (Oppong, 2012) and in a nation where currently roadway crashes claim an average of 1800 people annually; it seems highly unlikely for Ghana to satisfy the Decade of Action programme which aims at drastically reducing the number of road fatalities by 2020 as stipulated by the World Health Organization (WHO, 2015).
The Poisson and Negative Binomial (NB) models are two basic generalized linear model (GLM) specifications, which are usually employed to analyze count data (Agresti, 2002). The Poisson regression is characterized by equal mean and variance, and fits well for equidispersed data whilst the NB is utilized in cases where there is suspicion of overdispersion in the response. Oppong and Assuah (2015) compared the Poisson regression with the NB model with the aim of identifying the best fitting model for road crash fatality counts. The NB was identified to fit the data best. Likewise, Ackaah and Salifu (2011) used the NB model in forecasting injury prone road crashes occurring along rural areas in Ghana. Salifu (2004) did analyse road crashes occurring at T-junctions and X-junctions using the Negative Binomial (NB) model in the presence of covariates falling in the category of traffic flow variables and road features. However, these traditional models fail when most of the observed counts are zeros. The zero-inflated models have been devised to address such situations by modelling zero counts separately. Shankar et al. (1997) utilized the zero-altered count models on road crash frequency distinguishing between safe road sections with a likelihood of nearly zero and those that are not safe but recording no road crash. Qin et al. (2004) investigated the association which exists between crash frequency and selecting exposure measures using the ZIP model to predict crash counts as a function of annual average daily traffic segment length, speed limit and roadway width.
This study seeks to investigate the most appropriate model to examine the factors that significantly influence the mortality of road crash accidents in Ghana.
Data description and methodology
This research relies on secondary data obtained from the BRRI on crash reports from the Motor Traffic and Transport Unit (MTTU) of the Ghana Police Service. A total of 6239 crashes were observed on 14 national roads in Ghana for the year 2013. Out of the cases reported, a total of 1521 people were killed and 7402 were injured. In addition, 22 driver-related, traffic, weather and road related variables were recorded. Summary statistics on the number of people killed showed that the mean (0.2438) and variance (0.7855) differ. This gives an indication of possible overdispersion in the counts. Also, the histogram in Fig. 1 shows a skew distribution with over 82% of zero observation.
Histogram of number of death cause by road crash.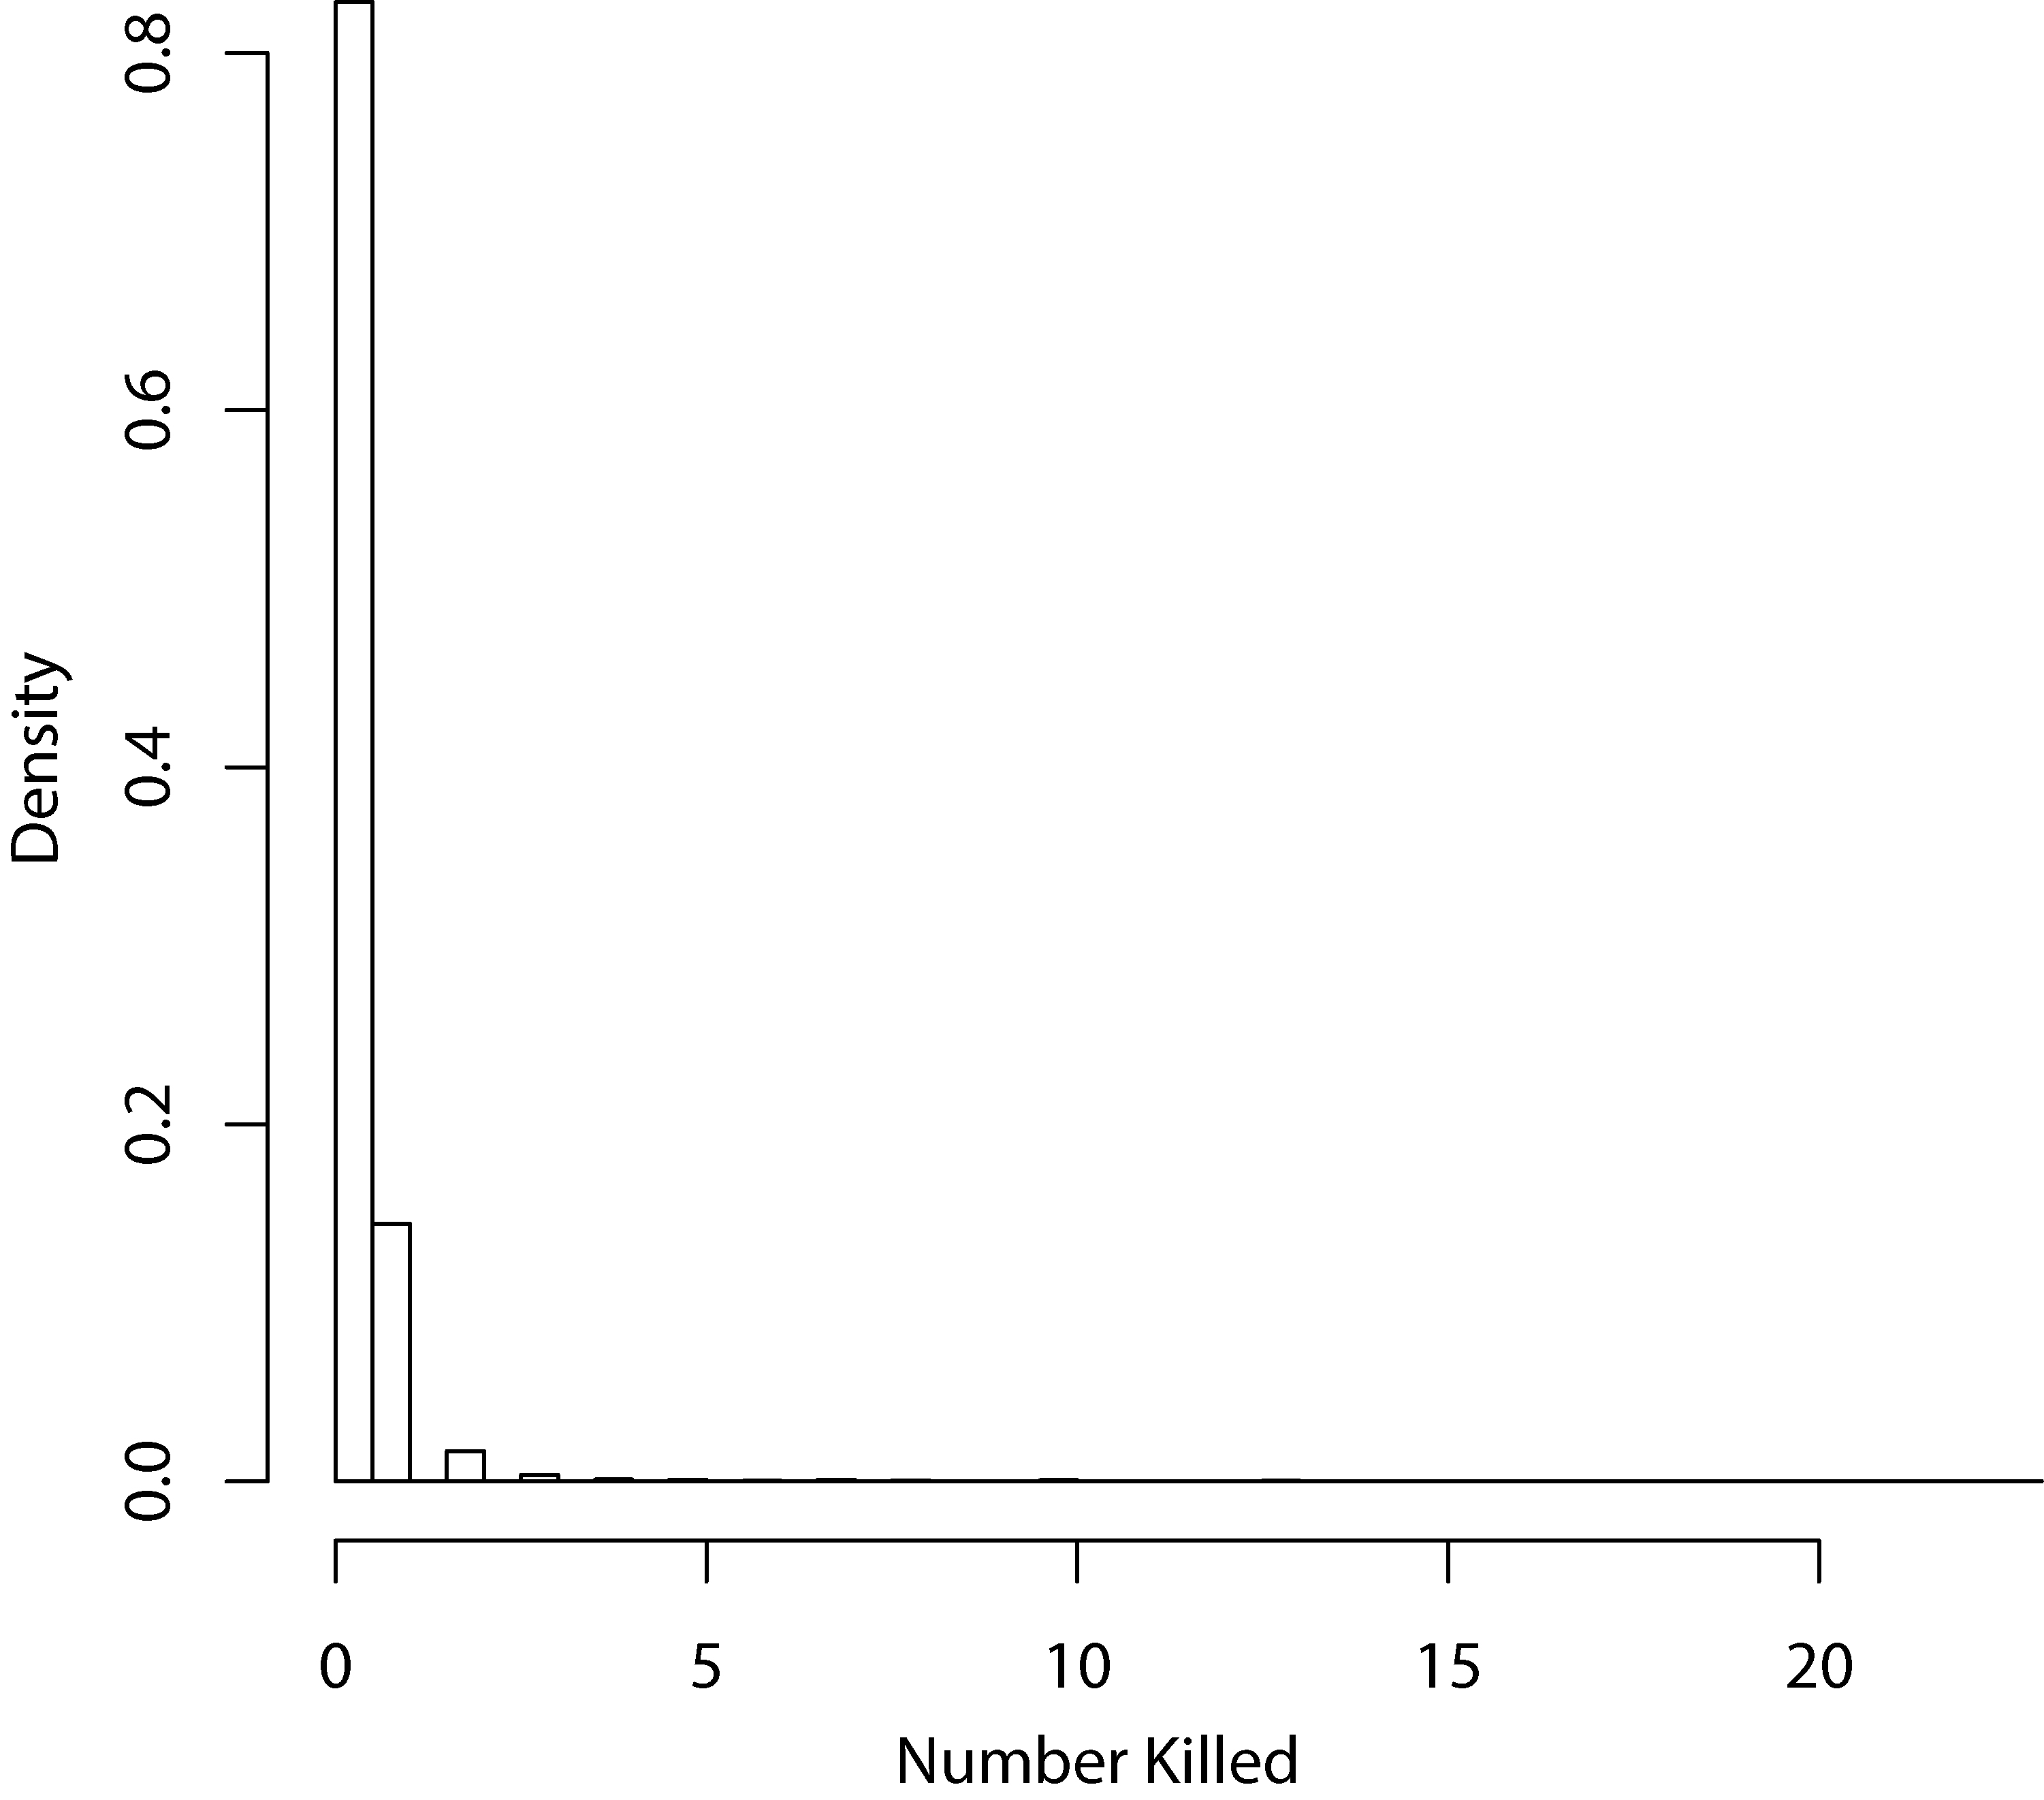
The two phenomena, overdispersion and zero-inflation, exhibited by the data need to be accounted for by our model. Furthermore, an appropriate model building process is required to select the most significant factors of the 22 observed.
This study seeks to model the mortality as a result of road accident crashes in Ghana. Since the outcomes are counts, the conventional univariate Poisson model is typically what comes to mind. However, due to the presence of possible overdispersion and excessive amount of zero counts, the Negative Binomial and Zero-Inflated models are also considered. Since both can occur simultaneously, extensions such as Zero-inflated Poisson (ZIP) and Zero-inflated Negative binomial (ZINB) are obvious candidate models as well.
To address the issue of overdispersion, approaches such as the quasi-likelihood Poisson GLM and Negative Binomial (NB) models have been proposed. The NB model is an extension of the Poisson regression and is commonly used to address overdispersion and is reviewed here.
Let
The first two marginal moments of
where
Similar to the conventional Poisson regression, the NB regression model, with
To handle the occurrence of excess zero counts, we use the Zero-Inflated Negative Binomial (ZINB) regression model, a natural extension of the Zero-Inflated Poisson (ZIP) regression model. These models assume that two processess generate the counts. The first process generates only zeroes with probability
The marginal mean and variance of
It can be observed that
The ZINB model is fitted by assuming the following two models:
In assessing the effect of the covariates, the zero-inflated model displays an aversion for a particular covariate when the covariate shows an increasing co-efficient in the zero process and a decreasing effect in the parent count process. An attraction is also said to occur when the zero part for the covariate shows a negative coefficient implying a decreasing effect and a positive sign indicating an increasing effect in the parent count process.
To statistically validate zero-inflated probability models, Vuong (1989) proposed a test based on the
with
The Akaike Information Criterion (AIC, Akaike 1994) and the Bayesian Information criterion (BIC) are used for selecting the best model from several fitted models. The AIC gives a fair idea of the information lost when a model is fitted to a set of data generated from the unknown true model by considering the complexity of the model and its goodness of fit. The AIC for a model with
As with AIC, the BIC model selection criteria penalizes model with additional parameters. We define,
with
The goal of this study is to model the frequency of vehicular crash mortalities in Ghana in the presence of some covariates using the NB and ZINB model specifications. Maximum likelihood estimation technique is commonly used for obtaining estimates of parameters in these models. The basic principle behind this method is to estimate parameters that maximize the likelihood of the observed data. Often, it is much easier to maximize the log-likelihood.
For independent sample observations
where
For the ZINB, the log-likelihood is of the form:
Parameter estimates and standard errors are obtained in a similar way as discussed for the NB regression model above. The estimation of these models are carried out in SAS.
The Poisson, negative binomial and extended versions, the zero-inflated Poisson and zero-inflated negative binomial models, were fitted to the datas In all, a total of 22 explanatory variables namely the crash day, crash time, weather, light conditions, road description, road surface type, shoulder type, road separation, traffic control, location type, collision type, hit and run, road environmental landmark, road width, road works, driver’s sex, driver’s age, driving under influence, driver error, vehicle type, vehicle maneuver, and vehicle defects were used. The large number of covariates posed additional problems to the data analysis. To carefully select which of these regressors were significant in explaining the number of people killed, we applied both backward and forward model selection. The log-likelihood, AIC and BIC of the final models are displayed in Table 1. Data manipulations were done in R and statistical analyses were conducted using SAS. The codes used to generate our results can be provided by the authors upon request.
A comparison of log-likelihood, AIC and BIC values
A comparison of log-likelihood, AIC and BIC values
The Poisson regression model performed badly among all the models. From the data, it was observed that the mean number of road accident deaths was 0.244 and variance of 0.7855. Since the mean and variance are not equal, over-dispersion is suspected. The Pearson statistic tells how well the model performs in predicting the observed count response when covariates are considered. It also helps to determine whether there is evidence of overdispersion or underdispersion in the model predicted. Ideally specified model would exhibit equidispersion, where an expected value of 1 is obtained when we divide the Pearson statistic by its degree of freedom. Overdispersion is characterized with a bigger Pearson value over the degrees of freedom, underestimated standard errors and increase in number of significant variables which in turn results in misleading inferences. Indeed, the large ratio (Pearson/DF) away from 1 gives an indication of the presence of overdispersion in the response that needs to be accounted for. Next, a NB model was fitted to the data. Some consistency was observed in the variable selection since the variables, which were significant after variable selection for the NB model, were also significant for the Poisson model. Furthermore, compared to the Poisson case, we realized a better Pearson Chi-Square on degrees of freedom for the NB was considerably lower than that of the Poisson Model. Also, the AIC and BIC values for the NB were certainly smaller than that of the Poisson model.
Over three fourth (82.85%) of the observed death counts were zeroes. Some of the zeroes could truly be cases where the crashes were non-fatal crashes with no death. Other zero counts could be because of errors in reporting the fatalities. Regardless of the fact that the NB was preferable to the Poisson model, we are still faced with the problem of excess zeros in data. Thus, ZIP model was fitted to handle overdispersion and also account for some aspects of overdispersion. The AIC for the ZIP was smaller than the case of the conventional Poisson. In addition, we performed the Vuong test (
The parameter estimates and respective standard errors of the ZINB model are presented in Table 2. For the variable Day with Wednesday as the reference variable, there was significant difference in fatalities occurring between Thursday and Wednesday with coefficient estimate of
For the Time of the Day variable with the reference category as Night, we observe that Morning, Afternoon, and Evening tend to decrease the log of expected count of persons killed. Out of these three variable levels, Morning and Afternoon were found to be significant with estimates
Next, for the Collision Type with Slide collision as the reference variable, we observe that Hit Animal, Hit Object On Road, Hit Parked Vehicle, Hit Pedestrian, and Ran Off collision exhibits a decreasing effect on the log count of persons killed whilst Head On, Hit Object Off Road, and Rear End collisions all increases the log of expected count of number of deaths. We also notice that all the levels of the variable were not significant at the 0.05 level of significance except for Hit Pedestrian and Ran Off collisions giving
Turning to the Road Environmental Landmark covariate, with the reference variable as village, we observed that Rural and Urban Landmark significantly decreases the log mean count of persons killed. We observe estimates of
Parameter estimates and standard errors (s.e) for the ZINB model
Urban relative to Village Landmark also has an incident density ratio of 0.5219 representing 47.81% decrease in the expected count of persons killed. From the analysis, we can confidently state that more deaths are associated with crashes occurring at Village Landmarks as compared with Rural and Urban Landmarks.
For the Shoulder Type variable, with Unpaved Shoulder Type as the reference level, we first notice an increasing effect for the two variable levels Paved and No Shoulder Types. We observed that Paved Shoulder Type with an estimated coefficient of 0.5158 was highly significant with a
The Driver’s Sex with variable levels, Male and Female, had significant effect on the log-count of persons killed. With the reference level as Male, we observe a negative coefficient of
For Vehicle Type, none of the variable levels were found to be significant even though Bus, Car, HGV, Minibus, Pick Up and Other Vehicle Type appear to have an increasing effect whilst Cycle, Motor Cycle, Tractor displays a decreasing effect on death counts.
In this research, we have analyzed the effect of risk factors that could explain the number of fatalities in car crashes in Ghana. A number of possible candidate models were fitted and through a careful modeling selection process, the ZINB model was identified as the “best” fitting model to the data.
The analyses evidently endorses the public’s perception concerning some of the crash variables such as the Day, Time, Collision Type, Road Description, Driver’s Age, Driver’s Sex, and Shoulder Type and their effects on road crash fatality count. The findings suggest that it is more dangerous to drive on Saturday and less risky to use the highways on Thursday. The effect of Saturdays on the number of deaths could be because usually several programs such as funerals and wedding are organized on Weekends and this could influence a lot of people to use the roads on weekends hence fatality counts are likely to increase on these days. We also realized that more deaths are recorded at Night and Evening hours. Lack of streetlights may dim the vision of drivers during evening and night hours. Moreover, drivers may lose concentration due to fatigue or sleeping and this may lead to fatal crashes during these hours. It is also noticed that crashes occurring along Village landmarks are more likely to result in death as compared with crashes occurring along Urban and Rural landmarks. This may be attributed to the fact that along these routes, there are but few traffic regulating mechanisms to check drivers for overspeeding hence such collisions are highly likely to result in more victims killed. In addition, many drivers ignore the speed limit and tend to overspeed on paved shoulder type highways increasing the tendency of fatal crashes.
The youth and teenagers are known for their exuberance and often drive recklessly while adults with lots of experience are mostly careful therefore, the higher the driver’s age, the less likely it is observe an increase in number of persons killed. As well, female drivers reduce the risk of fatality as compare with male drivers. This could be attributed to their patience and cautiousness when driving so as to obey road regulations such as avoiding overspeeding.
We recommend that authorities responsible for managing road should focus on installing reflective markings on the shoulders of roads and increase education of drivers in adhering to road regulations while also paying keen attention to road environmental landmarks. The Law enforcement agencies per reports have identified crash black spots in Ghana over several years of observation. Knowledge of the day and time when fatal clashes occur will enable them to intensify their patrol around such times in order to check and regulate vehicle movements at high risk spots. Reflective road markings would aid driver’s vision at night since more fatalities are experienced during dark hours. Authorities should intensify educating road users especially drivers when driving at night with the intension of reducing road crashes.
To comment on the computational work to get the MLE’s for the parameters, it is obvious that the computational cost for the more complex models would be higher. However, with the computational efficiency and speed of R and SAS softwares, the differences in computational time between these models are almost negligible. In terms of estimation of model parameters, other estimation strategies such as Bayesian MCMC and Psuedo-likelihood estimation techniques could be explored in the future. Furthermore, since the focus of this empirical research is making inference and not predictions, assessment of the predictive power of the models is beyond the scope of this manuscript. However, this can be considered in a future study.
Footnotes
Acknowledgments
The authors are grateful to Mr Kwadwo Poku Agyemang, Mr Yaw Preprah and Mr Simon Ntramah of the Building and Road Research Institute (BRRI) who helped to acquire the data.
Conflict of interest
The authors declare that they have no competing interests.