
Abstract
MATERIALS AND METHODS:
We first describe the general concept of kinship coefficients and focus on the novel adaptations on feature (i.e. variants and/or SNPs) selection utilizing expressed variants to make it suitable for the clinical setting.
RESULTS:
We illustrate the adapted kinship coefficients estimate in two studies: one for lung fibrosis where multiple samples were routinely collected from each patient and one for thyroid cancers where a cohort of samples was run on different platforms.
CONCLUSION:
We demonstrate the effectiveness of using kinship coefficients to improve sample integrity and discuss potential improvements in the methodology.
Introduction
Precision medicine is becoming an increasingly important paradigm in the clinical management of disease, particularly in oncology (Ashley, 2016). Next generation sequencing (NGS) allows sequencing of DNA including: whole genomes (Cirulli & Goldstein, 2010), exomes (van Allen et al., 2014), targeted genomic regions of interest (Frampton et al., 2013). NGS also allows the querying of the transcriptome through RNA-seq (Byron et al., 2016). These technologies can reveal disease-related genomic alterations, including single nucleotide variants (SNVs), copy number variants (CNVs), and genomic rearrangements. In addition to searching for disease-causing markers, numerous germline single nucleotide polymorphisms (SNPs) are queried as well (Cirulli & Goldstein, 2010).
In the clinical setting, samples are processed in high throughput, and are handled from accessioning through final output and patient report. Because treatment decisions are based on the diagnostic test result, it is critical to ensure that the sample associated with the report is the sample that was derived from the patient (CLIA 42 CFR § 493.1232; Rehm et al., 2013). Additionally, during the development of novel clinical tests, sample swaps can affect stated test performance by introducing errors into the validation set. A Laboratory Information Management System (LIMS) is critical in ensuring that the patient receives the correct report and provide an audit trail on a per sample basis (Sepulveda & Young, 2013). Additionally, the use of automation can prevent accidental sample swaps.
Because the correct mapping of patient to sequencing file is so critical, several methods have been proposed to confirm the identity of samples. These methods have been primarily built for DNA sequencing data (Pengelly et al., 2013), or require an orthogonal reference method, such as a SNP microarray (Huang et al., 2013; Jun et al., 2012), which are not applicable in our situation where the samples are run on RNA sequencing platform and corresponding reference data are not always available. Here, we investigated the novel use of kinship to verify sample identity.
In family-based association and linkage studies, inbreeding and kinship coefficients are utilized to determine relatedness of family members from the pedigree information (Boyce, 1983). Later, a number of methodologies have been proposed to estimate relatedness using genome-wide genotype data without pedigree information (Choi et al., 2009; Kelmemi et al., 2015) and in more complex structure such as admixed populations (Thornton et al., 2012). These tools have successfully identified unknown relatedness and reduced false findings in genetic studies.
Herein, we repurpose kinship methodologies to confirm biological and technical replicates using variants called from RNA sequencing data of 699 lung tissue and 2,053 thyroid tissue samples. We examined the ability of kinship coefficients to detect biological and technical replicates from both lung and thyroid tissue. Finally, we utilized kinship to ensure that DNA and RNA from the same patient but analyzed with two distinct platforms were indeed from the same patient.
Materials and methods
Materials
RNA-seq
15 ng of total RNA was input into the Illumina RNA Access kit (Illumina, San Diego, CA) and performed according to the manufacturer’s instructions on a Hamilton STAR robot. Pools of 16 samples were sequenced on the NextSeq 500 with a NextSeq v2 chemistry 150 cycle kit (Illumina, San Diego, CA) using paired-end 76 cycle sequencing chemistry.
Targeted DNA-seq
96 SNPs informative SNPs were chosen based on RNA-seq data for common dbSNPs that had heterozygotes in
Lung transbronchial biopsy (TBB) samples
RNA-seq data were generated from 699 lung transbronchial biopsy (TBB) samples of 112 patients (Pankratz et al., 2017). Each patient has 3–5 different samples that are called as biological replicates. Eight lung samples were chosen for quality control and sequenced repeatedly across 8 different batches, which are referred to as technical replicates. Among 243,951 pairs, there are 1,893 pairs of biological replicates and 563 pairs of technical replicates.
Thyroid tissue samples
RNA-seq data were generated for 2,053 samples over 26 batches and with a total of 2,106,159 pairs of independent samples, 49 pairs of biological replicates and 170 pairs of technical replicates. Additionally, DNA-seq data were generated for 609 samples and matched with 2,047 RNA-seq samples after removing low quality samples. There were 589 matched pairs between DNA-seq and RNA-seq data and 1,246,034 pairs of different samples.
Methods
Variant calling pipeline
A customized analysis pipeline was used to process the raw sequencing data from the NextSeq 500 and generate variant calls that is the foundation of the kinship analysis described in this manuscript. The first step is de-multiplexing the raw sequencing reads, and assigning reads to each sample. This is done through the Illumina public software, BCL2FASTQ. Before and after the de-multiplexing, customized scripts are developed to prepare the parameters for BCL2FASTQ, re-organize the FASTQ files and check any contamination and the FASTQ quality before the pipeline can be invoked.
After de-multiplexing, the pipeline was designed by following the GATK Best Practices for variant calling on RNA-seq (Engström et al., 2013). It consists of two sections: pre-process and variant call. The first section includes STAR-based 2-pass alignment against the human genome build 37, mark duplicates and sort, detection of fusion by STAR Fusion, expression profiling via HTSeq-count, RNASeQC, and SAMTools QC. The second section, which is processed via GATK, is composed of six parts: splitting reads across exons and trimming N’s off, indel re-alignment, recalibration to adjust quality scores, variant call, variant filtration, and coverage at known sites.
Estimating IBD sharing and kinship coefficients
We adapt the concept of kinship coefficient to track technical/biological replicates, monitor sample integrity and potentially measure sample quality. We describe briefly identity by descent (IBD)-sharing probabilities, k-coefficients, and kinship coefficient, and then a method for kinship coefficient estimation.
The three k-coefficients,
Previously using unlinked loci, an expectation maximization (EM) algorithm (Choi et al., 2009) has been proposed to find maximum-likelihood estimators (MLE) for k-coefficients. The log-likelihood function for k-coefficients is
where
Comparison of kinship coefficients
The MLEs of kinship coefficients are compared to other methods including the method of moment (MOM) (Manichaikul et al., 2010; Thornton et al., 2012) and shared genotypes ratio (SGR) over total genotypes observed. The MOM is another way to estimate kinship coefficients directly from genotype data and used widely in genetic studies. The MOM estimator of kinship coefficient is defined as
where
To distinguish the pairs of technological or biological replicates from non-replicates, we attempted to simply compute the proportion of shared heterozygous (
where
Variant selections and allele frequencies
To estimate kinship coefficient using detected variants through NGS, the first step is to identify the variant set. We focus on high quality variants identified by the 1000 genome project (Manichaikul et al., 2015) and ones with sufficient coverage in our data set. Sufficient coverage is defined as having read depth of more than 30 in majority of samples, replicates included. Once the variant set is identified, we compile the genotype of each sample on this targeted set. This forms the basis for calculating kinship coefficients among any pairs. Instead of using allele frequency provided by any public database, we derive allele frequency of each variant using our own dataset. This calculation is based on unrelated samples only. When biological and/or technical replicates exist for a given patient, only one sample is selected randomly to be included in the calculation of allele frequencies. More details are described in Fig. 1.
Flow chart of variant selection.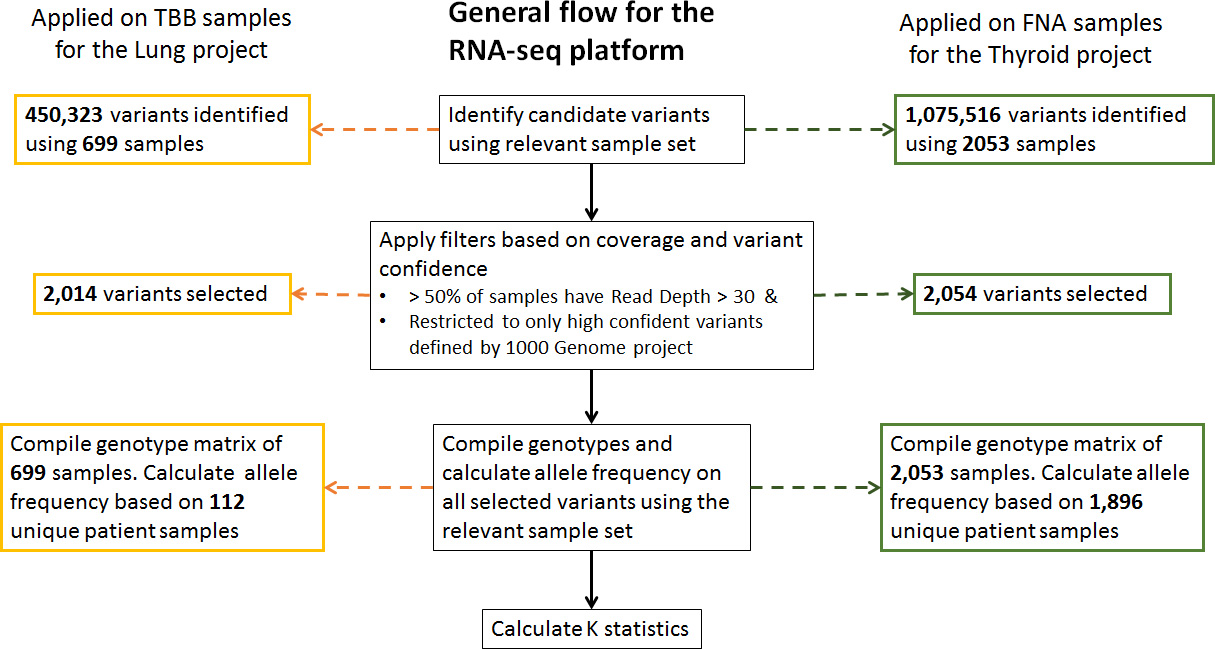
(A) Mean vs standard deviation of read depth of 2,054 variants in thyroid samples after filtering (B) Observed allele frequencies for alternative allele in thyroid samples vs allele frequencies of the 2,021 matched variants in European population from Phase 3 1000 Genomes data (C) Mean read depth of 222,974 commonly detected variants on autosomal chromosomes in thyroid samples and lung TBB samples. Red points are the ones selected after filtering (D) Allele frequencies of 2,736 variants detected either in thyroid samples or lung samples after filtering. 1,332 variants are in common and 722 variants are detected in thyroid samples only and 682 variants are detected in lung samples only.
Boxplots of pairwise estimated kinship coefficients in lung samples using maximum likelihood estimation (MLE), method of moment (MOM) and shared genotype ratio (SGR). In total, 2,014 variants and 699 samples are used to estimate kinship coefficients for 241,495 unrelated pairs, 563 technical replicates and 1,893 biological replicates.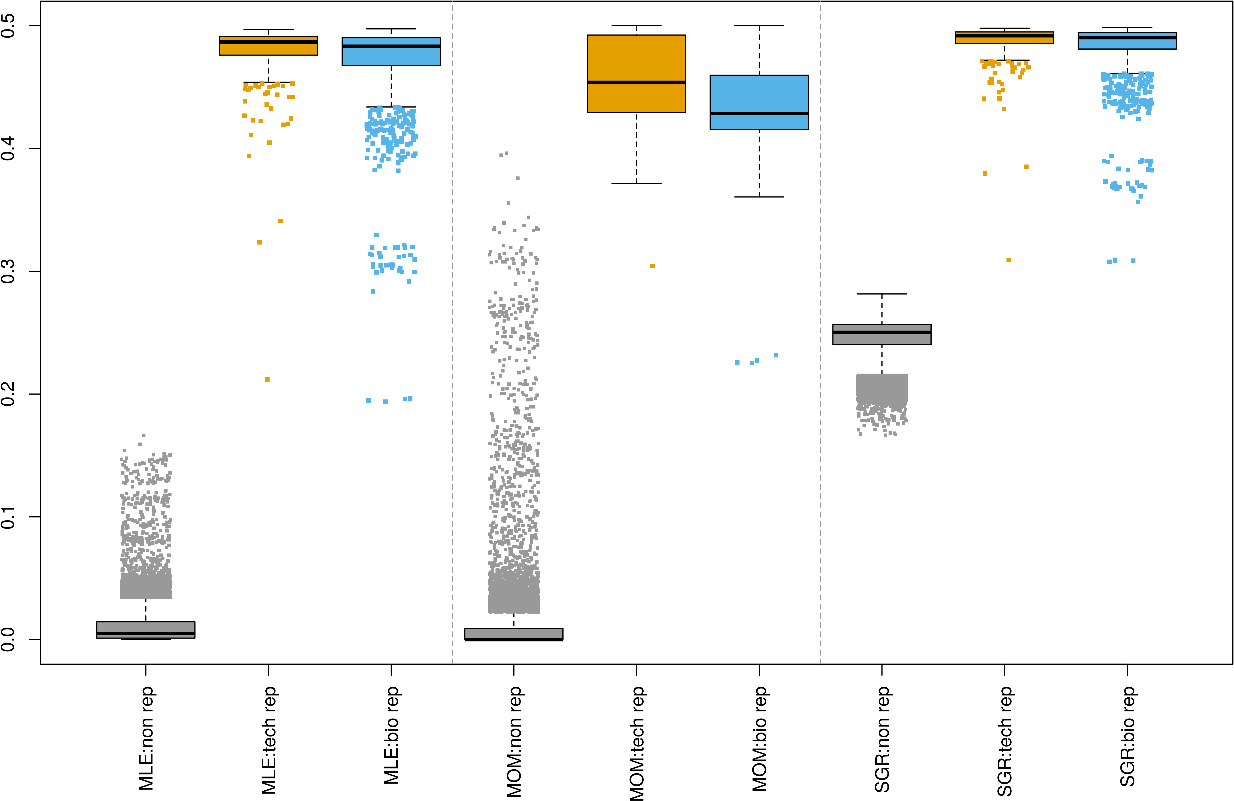
Estimated k0 vs. k1 for Thyroid (Panel A) and Lung (Panel B) samples.
Boxplots of pairwise estimated kinship coefficients using 87 SNPs between 609 DNA-seq and 2,047 RNA-seq data of thyroid samples using maximum likelihood estimation (MLE), method of moment (MOM) and shared genotype ratio (SGR).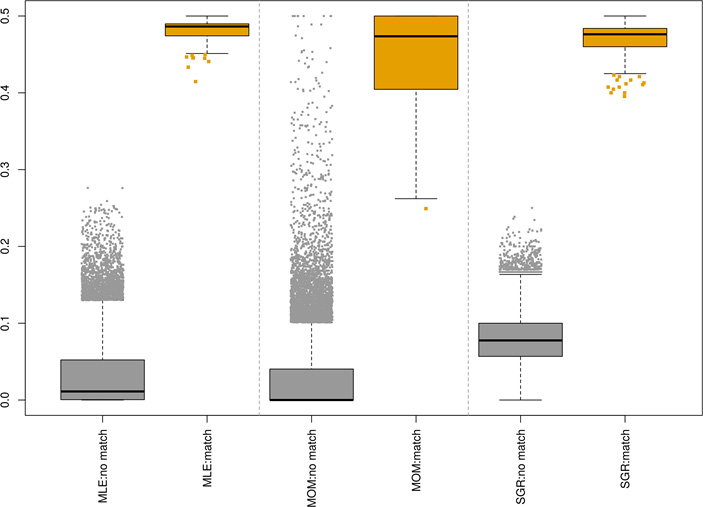
We first determined the quality of variant/SNP calls from RNA-seq data. One challenge in using RNA-seq data is that coverage is dependent on expression levels, and different sample types have different expression signatures. Figure 2 illustrates uneven coverage on RNA-seq and how both variant coverage and allele-frequency are highly sample-set dependent. Panel A displays the mean versus standard deviation of read depth of 2,054 variants across 2,053 thyroid samples after variant filtering. The averaged read depth for most of variants is below 200x (90%) but covers a wide range from
After filtering (as described in Fig. 1), the kinship is estimated using 2,014 detected variants on autosomal chromosomes for all pairs of 699 lung samples. Estimated kinship coefficients using three different methods (MLE, MOM, SGR) are compared and the result is shown in Fig. 3. The MOM kinship coefficients of several technical/biological replicates overlap with those of independent pairs since estimated values of independent pairs are ranged from 0 to 0.496. However, both MLE and SGR have separated biological/technical replicates from independent pairs cleanly. The maximum of MLE kinship coefficients for independent pairs is 0.166 and the minimum values for biological and technical replicates are 0.194 and 0.212 respectively. The maximum of SGR for independent pairs is 0.282 and the minimum values for biological and technical replicates are 0.308 and 0.309 respectively.
In addition to kinship coefficients, the MLE method allows us to estimate k-coefficients and to categorize pairs into more specific relationship. Unexpected patterns help us detect issues in experimental procedures and/or pipeline steps. For example, while the expected kinship coefficient is 0.25 for both full siblings and parent-offspring, the underlying value of
Figure 5 presents the estimated kinship coefficients by three models, MLE, MOM, and SGR for pairs of 2,047 RNA-seq and 609 DNA-seq data of thyroid samples. The non-matched pairs indicate RNA-seq and DNA-seq data are from the different patients and matched pairs indicate both RNA-seq and DNA-seq data are from the same patient. For the matched pairs, all three models result in estimated kinship coefficients close to the expected value, 0.5, with mean (s.d.) of 0.482 (0.013), 0.448 (0.060) and 0.472 (0.021) for MLE, MOM and SGR, respectively. Similarly, for the non-matched pairs, the estimated kinship coefficients are closed to the expected value, 0 with mean (s.d.) of 0.031 (0.041), 0.026 (0.044) and 0.080 (0.032) for MLE, MOM and SGR, respectively. However, the MOM results in the wide range of estimated kinship from 0 to 0.5 for non-matched pairs with highly inflated values making them undistinguishable from matched pairs. Overall, this result demonstrates that the estimated kinship coefficients could successfully match RNA-seq data with DNA-seq data of the same patient.
Discussion
In this study, we have shown that the kinship statistic can be repurposed for NGS-sample tracking in a clinical laboratory setting. A variety of tissue types can be tracked with this methodology, including lung and thyroid samples. Because RNA-seq data were used, where SNP coverage is influenced by expression levels, a unique SNP set was required for different tissue analysis. Finally, we were able to select a small set of informative SNPs to ensure that DNA and RNA purified from the same patient are correctly linked and analyzed together.
While the estimated kinship coefficients distinguish technical/biological replicates from unrelated pairs, the results from both lung and thyroid data set show over-estimated values in unrelated pairs and under-estimated values in replicated pairs. The MLE restricts the space of parameters, k-coefficients,
Uncertainty in variant calling using RNA-sequencing could affect accuracy in kinship estimation. The vcf file reports only heterozygous and homozygous genotypes of alternative allele, and we assume genotype is homozygote of reference allele where no variant is reported. This assumption may cause a genotype error if there is no coverage on missing variants in vcf files. Especially when the sequence data is low quality with low coverage, the genotype error would be more severe. This explains the long lower tail in estimated kinship coefficients of replicated lung samples in our results (Fig. 3).
Missing homozygous genotypes of the reference allele in the vcf file leads us to consider using heterozygous and homozygous genotypes of alternative allele only for SGR. Since our main goal is to distinguish technical/biological replicates from unrelated pairs in clinical setting, SGR simply assumes shared genotypes are IBD across different variants and non-shared genotypes are non-IBD, even when one of the allele is shared (i.e.
In addition to using SNPs for confirming sample identity, common SNPs may be useful for other critical QC functions in the clinical setting. One example is sample-to-sample contamination. Studies using DNA have shown that consistent increases in allele frequency across thousands of SNPs can reveal sample contamination (Jun et al., 2012). Analytical validation experiments analyze the ability of an assay to perform in the presence of contamination. SNP-based contamination metrics would help eliminate samples that are above a critical threshold. By using SNPs that come along for the ride during NGS-based clinical tests, we can add additional QC metrics to further ensure accurate reporting to patients.