
Abstract
The traditional sampling methods such as simple random sampling, stratified sampling etc. cannot be used to study the rare and clustered populations. Such type of populations are frequently observed in ecological, environmental and social sciences. In such situations, often the auxiliary information is collected along with the variable of interest. Obviously, one would like to exploit this auxiliary information to the maximum extent. We consider an auxiliary variable which is highly negatively correlated with the variable of interest. An initial random sample of a fixed size is drawn from the population under study. Further, networks are formed around the units selected in this sample that satisfy the pre specified condition with respect to the auxiliary variable. We used the procedure given by Thompson (1990) for that purpose. The variable of interest is measured corresponding to the units included in these networks. In such situation, negative adaptive cluster sampling (NACS) is of more practical interest than that of the conventional sampling designs. NACS can provide more informative sample for the investigator and more efficient estimates of the population parameters of interest. The parameters of the population are estimated by using the information on the variable of interest corresponding to the units included in the different networks. Different estimators are proposed in this article for the population total of the interest variable. The performance of these estimators is compared by using the data collected from a pilot study by using NACS method.
Keywords
Introduction
In many real life situations, it is required to estimate either the population mean or population total. In general, traditional sampling methods such as simple random sampling (SRS), stratified sampling etc. are used to draw a sample from the population and to estimate the population mean/total.
But if the population under study is rare and patchy with respect to the variable of interest then the traditional methods lead to poor estimates. The values of the variable of interest may be zero for many of the units selected in the sample. This will lead to an underestimate of the population mean/total. On the other hand, the units for which value of the interest variable is large enough are likely to get clustered. Such type of patterns of clustering and patchiness are observed in many animal populations, with vegetation types and in epidemiological studies of rare and contagious diseases. In such situations, the investigators go away from the predefined sampling plan and add nearby or associated units in the sample.
A design which uses the information gathered from earlier sampled units to draw/include the next unit in the sample is called as an adaptive sampling design. Thompson (1990) has introduced adaptive cluster sampling (ACS) design. In this design, whenever observed value of a selected unit satisfies a condition of interest, additional units are added to the sample from the neighborhood of that unit. This design is discussed in Section 2 of this article. Although, the ACS design is found appropriate for sampling from a rare and clustered population, it suffers from drawback of losing control of the final sample size. Several suggestions have been made by the different researchers for limiting this final sample size of adaptive cluster sample. For instance, Salehi and Seber (1997) suggested a two stage sampling design in which primary units are selected using a conventional design and secondary units within the selected primary units are sub sampled using ACS. Brown (1994) proposed a design in which initial sample is selected sequentially until the final sample size reaches a specified value. Lee (1998) developed a two phase design, in which the first phase sample is an ACS sample based on an auxiliary variable and the second phase sample is selected from the first phase using probability proportional to size (PPS) with replacement sampling design. This design controls the number of measurements of the study variable but it cannot control that of the auxiliary variable. Salehi and Seber (2002) proposed an estimator of the population mean. Bahl and Tuteja (1991) proposed ratio and product type exponential estimators for estimating the mean of a finite population.
In Section 3 of this article, we have described adaptive cluster double sampling (ACDS) proposed by Martin Medina and Steven Thompson (2004). It is a method based on combining the idea of double sampling and ACS. It requires the availability of an inexpensive and easy to measure auxiliary variable.
In Section 4, we have proposed a new method, negative adaptive cluster sampling (NACS). In this method, the process of adding the units to the initial sample is different than that of ACS. In this sampling design, we consider two highly negatively correlated variables
The pilot study is presented in Section 5. In Section 6, we have compared the performance of the estimators proposed in Section 4 on the basis of the data from pilot study. Lastly, the concluding remarks are incorporated.
Adaptive cluster sampling
In this design, we start with a rare and clustered population of
Let
This design differs from the classical sampling designs, in the sense that selection procedure depends upon the observed values of the variable of interest. The advantages of such sampling designs were described by Basu (1969) and Zacks (1900). Cassel et al. (1997) summarized the subsequent literature on the designs that make use of observed values.
The conventional estimators may be biased when used in an adaptive design. Thompson developed unbiased estimators of the population mean and total along with the unbiased estimators of variances of these estimators. These estimators are design unbiased. That means, they depend on the sample selection rather than on the assumptions about the population. Classical estimators such as the sample mean or the mean of cluster means are biased when they are used with the adaptive designs.
Adaptive cluster double sampling
ACS introduced by Thompson (1990) has been found appropriate for sampling of rare and clustered populations. But it suffers from drawback of losing control of the final sample size. There have been several suggestions for limiting this final sample size of adaptive cluster samples. We have already mentioned some of them in Section 1. In adaptive cluster double sampling, travelling costs are increased because the second phase sample is selected after the first phase sample is completed. In the second phase of the sampling design, the sampler cannot allocate the subsample near the places of interest. The proposed unbiased estimators of the population mean do not take the advantage of the relation between the variable of interest and the auxiliary variable. Felix et al. (2004) proposed a multiphase variant of ACS. It is obtained by combining the ideas of double sampling and ACS. It is called adaptive cluster double sampling (ACDS). In this design an auxiliary variable which is easy to measure and is inexpensive is considered. This variable is used to select the first phase ACS. The network structure of this first phase sample is used to select the subsequent subsamples, which are selected using conventional design. Values of the variable of interest, associated with the units selected in the final phase subsample only are recorded and the population mean is estimated by a regression type estimator. The ACDS allows the sampler to overcome the drawbacks of ACS.
Procedure of ACDS
Let
It is required to estimate the population total of
In the first phase of ACDS, an ordinary adaptive cluster sample
Let
In the second phase, the sample
The third phase consists of selecting a conventional subsample of units from each of the distinct networks in
In this procedure the
Negative adaptive cluster sampling
Thompson (1990) introduced the idea of ACS. But this method faces a drawback of excessively large final sample size. If the selection, acquisition and measurement of the units in the population is difficult and expensive with respect to the variable of interest then one has to think about some alternative procedure of sampling. Felix et al. (2004) introduced ACS.
They have considered an auxiliary variable along with the variable of interest. The mean of variable of interest can be estimated either by using ACDS or one can use the ratio estimator in ACS (Dryver & Chao, 2007; Chutiman & Chiangpredit, 2014).
If
In this article, we have proposed a new sampling design. Here we consider two negatively correlated variables.
Consider some practical situation where such type of negative relationship is observed.
The plateaus in Western Ghats of Sahyadri from Goa to Varandha Ghat (Bhor, Maharashtra, India) are rich in aluminum ore-Leterite. Due to which the thorny plants are rarely observed. They are abundantly available on basalt kind plateaus. But there are some rare patches of thorny plants. It indicates the absence of aluminum in that part. If the interest is to estimate the total number of thorny plants in that area, NACS can be effectively used. Here aluminum content of the soil is the auxiliary variable. Its presence can be detected easily. The estimate of total number of these thorny plants can be obtained by using NACS. The plateaus in Western Ghats (Maharashtra, India) of Sahyadri from Tamhini Ghat to Mumbai are dominated by the presence of Basalt kind of rocks. In this area Neem, Ziziphus and other thorny plants are highly abundant. But there are intermediate patches of semi ever green plants. The estimate of total number of these evergreen plants can be obtained by using NACS. Suppose we want to estimate the total population of fish in a specified region under the sea. Let this region be subdivided to form a grid of locations. There are ample of bush of specific variety of plants under the sea water. The fish are detracted by that specific variety of bush present in that region. But there are some rare sea plants in that region which provide food for the fish and hence they get attracted towards these plants. So, the fish present in these locations can be counted. Here we consider the number of bush as the auxiliary variable and the number of fish as the variable of interest. Further it is observed that if the number of bush of specific variety of plants is greater than
The situations presented above show the negative correlation between the two variables.
In such a situation, we propose the following sampling design. In ACS the units in the initial sample are identified whether they satisfy the desired condition
In ACDS, by using adaptation technique the first phase units are decided by using an auxiliary variable. Then by using some traditional method such as SRSWOR, the second phase units are selected. In NACS, the adaptation is used to discover the networks in the population with reference to the auxiliary variable. Further the networks corresponding to the variable of interest are identified. There is no second phase in NACS. That is how NACS is different than ACDS. So in general, NACS is not ACDS. But NACS can be looked upon as a particular case of ACDS where the networks identified in the first phase, corresponding to the variable of interest are considered as the second phase units.
Secondly, ACDS does not bother about the type of relationship between the auxiliary variable and the variable of interest. In contrast to this NACS requires a negative relationship between the auxiliary variable and the variable of interest. The networks corresponding to the auxiliary variable and the variable of interest are discovered by using exactly the opposite conditions on the two variables. Hence, the design is called NACS. The use of auxiliary variable is justified by ACDS in the first phase sampling. We use the auxiliary information in NACS for adaptation purpose. We assume that the population information of auxiliary variable is known. In NACS, the networks are formed by using ACS with auxiliary information. The corresponding
Consider a population of
Form a grid of population containing
Check whether each of the selected units satisfies the condition
Suppose
Observe the values of the variable of interest corresponding to all the units in these
It is based on draw by draw probabilities that a unit’s network is intersected by the initial sample. Let
Where
That is,
Variance of
The unbiased estimator of
It is based on probabilities of the initial sample intersecting networks. The initial sample of size
Where
That is,
The probability that the network
The probability that the networks
Where
Note that,
Variance of
The unbiased estimator of
Summation is taken over the distinct networks included in the sample.
The proposed estimators for NACS
Chutiman and Chiangpradit (2014) proposed a ratio estimator of the population total of the variable of interest. It is based on the Raj estimators of the population totals of the auxiliary and the variable of interest. Raj estimator itself is an ordered estimator.
We propose a ratio estimator which is based on the HT estimators of the population totals of the two variables. HT estimator is an unbiased and unordered estimator. So, the computational difficulty involved in our estimator is much lesser than that in the ratio estimator proposed by Chutiman and Chiangpradit (2014).
Consider a population
Suppose a survey is conducted by using negative adaptive cluster sampling. The information on the variable of interest
Define
The modified HT estimator of the population total of the variable
That is we can estimate the population total
Note: i)
The population total of
The estimator of
The generalized population ratio total is:
Note that
Estimator of
Using the Taylor linearization technique about the point
Its approximate variance is given by:
Where,
The variance estimator of the modified ratio estimator is:
Where,
The modified regression estimator
By using weighted least square method we get
By using Taylor linearization technique about the points
Where,
The approximate variance is given by:
Let
The estimator of the variance of
Where,
Where
It shows that the regression estimator can be expressed as a linear function of the
Thus,
With the sample dependent weights
The regression estimator relates to the hypothetical population fit of the model
The regression estimator becomes:
The approximate variance of
The estimator of
Where
since
The above Eq. (25) is similar to that in Särndal et al. (1992).
Since the two variables are negatively correlated, it is of interest to define a product estimator of the population total based on the HT estimators of the population totals of the two variables.
The product estimator of the population total
Let
We get,
Hence,
By neglecting the terms involving
Bias in
The variance of
Pilot study was conducted by using NACS. The interest was to estimate the total number of ever green plants which are rare in that region due to the presence of Basalt rocks.
The area of 100 acres in the Tamhini Ghat was divided into 100 plots each of size 1 acre and the percentage of silica observed on each of these plots was measured. Time required to measure the percentage of silica in a sample from one acre plot is fairly lesser than the time required to measure the number of evergreen plants in one acre. Secondly, the testing a soil sample for the percentage of silica is much cheaper than the cost incurred in counting the number of evergreen plants in one acre. The cost of testing a soil sample was $2 and that of counting the number of evergreen plants in one acre was $20. So, we considered the percentage of silica in one acre as the auxiliary variable.
The nature of the soil in Western Ghats is of two types: Basalt rocks and Leterite. After studying the nature of the soil we had observed the abundance of evergreen plants whenever the silica content of the soil is 20 percent or less. Hence we considered
A random sample of 10 plots was drawn from this area by using SRSWOR. The plots selected in the initial sample from this population related to the auxiliary variable
Silica (S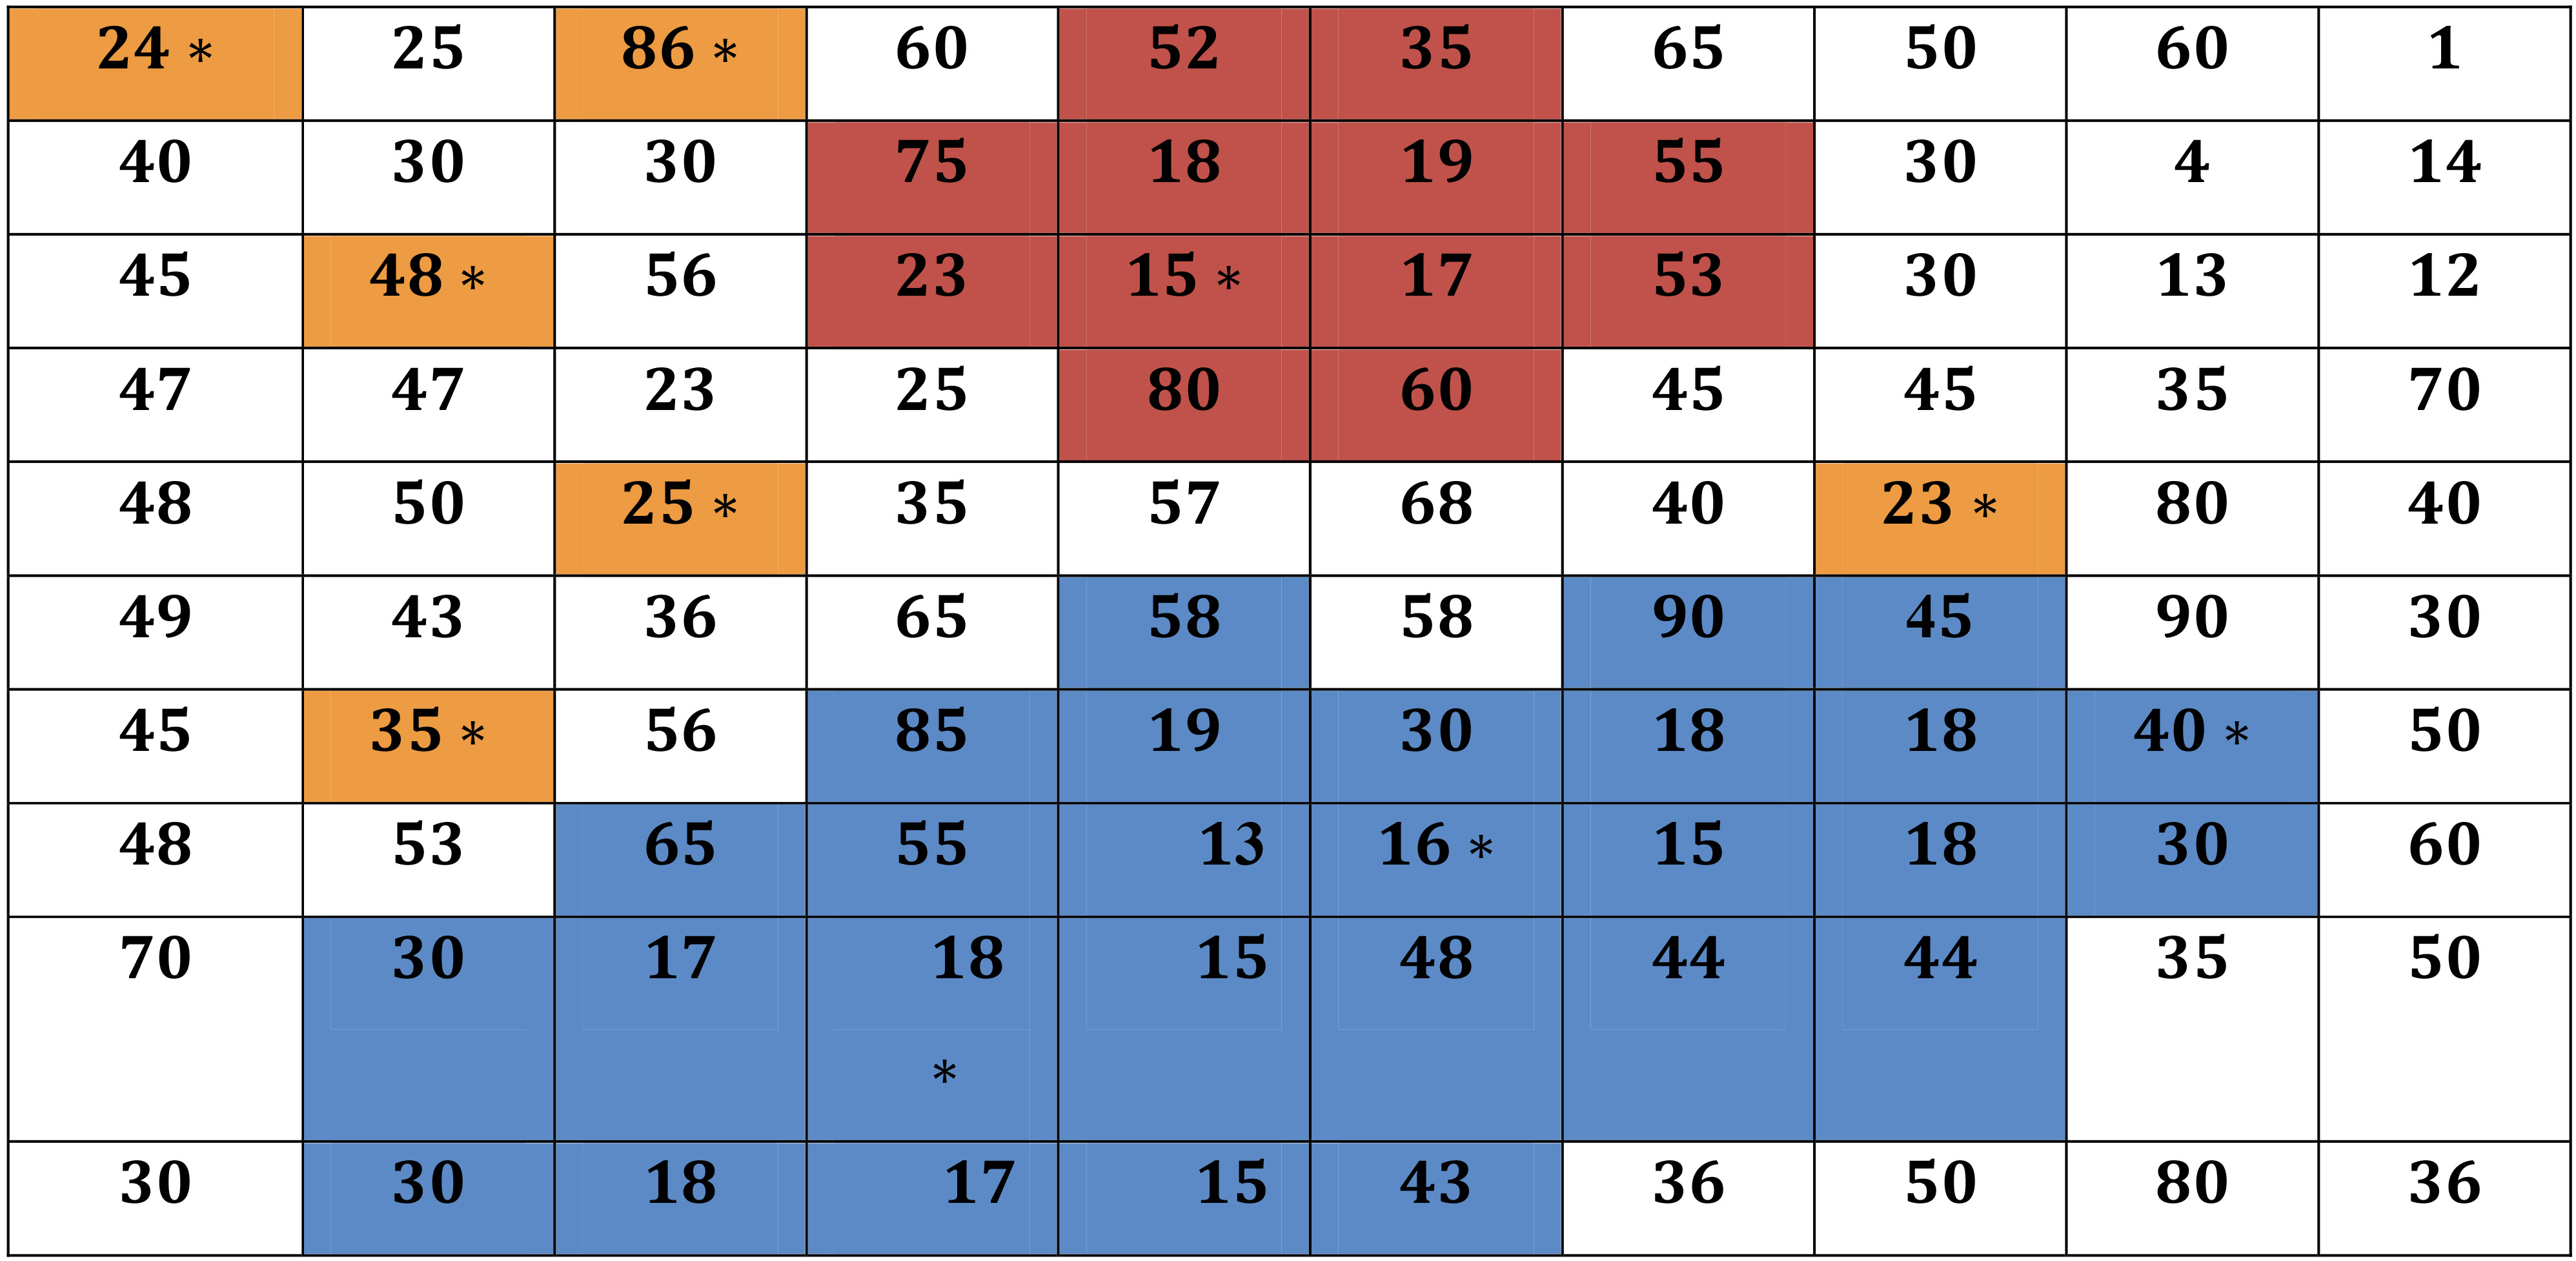
The values of the number of evergreen plants observed on the plots in the population.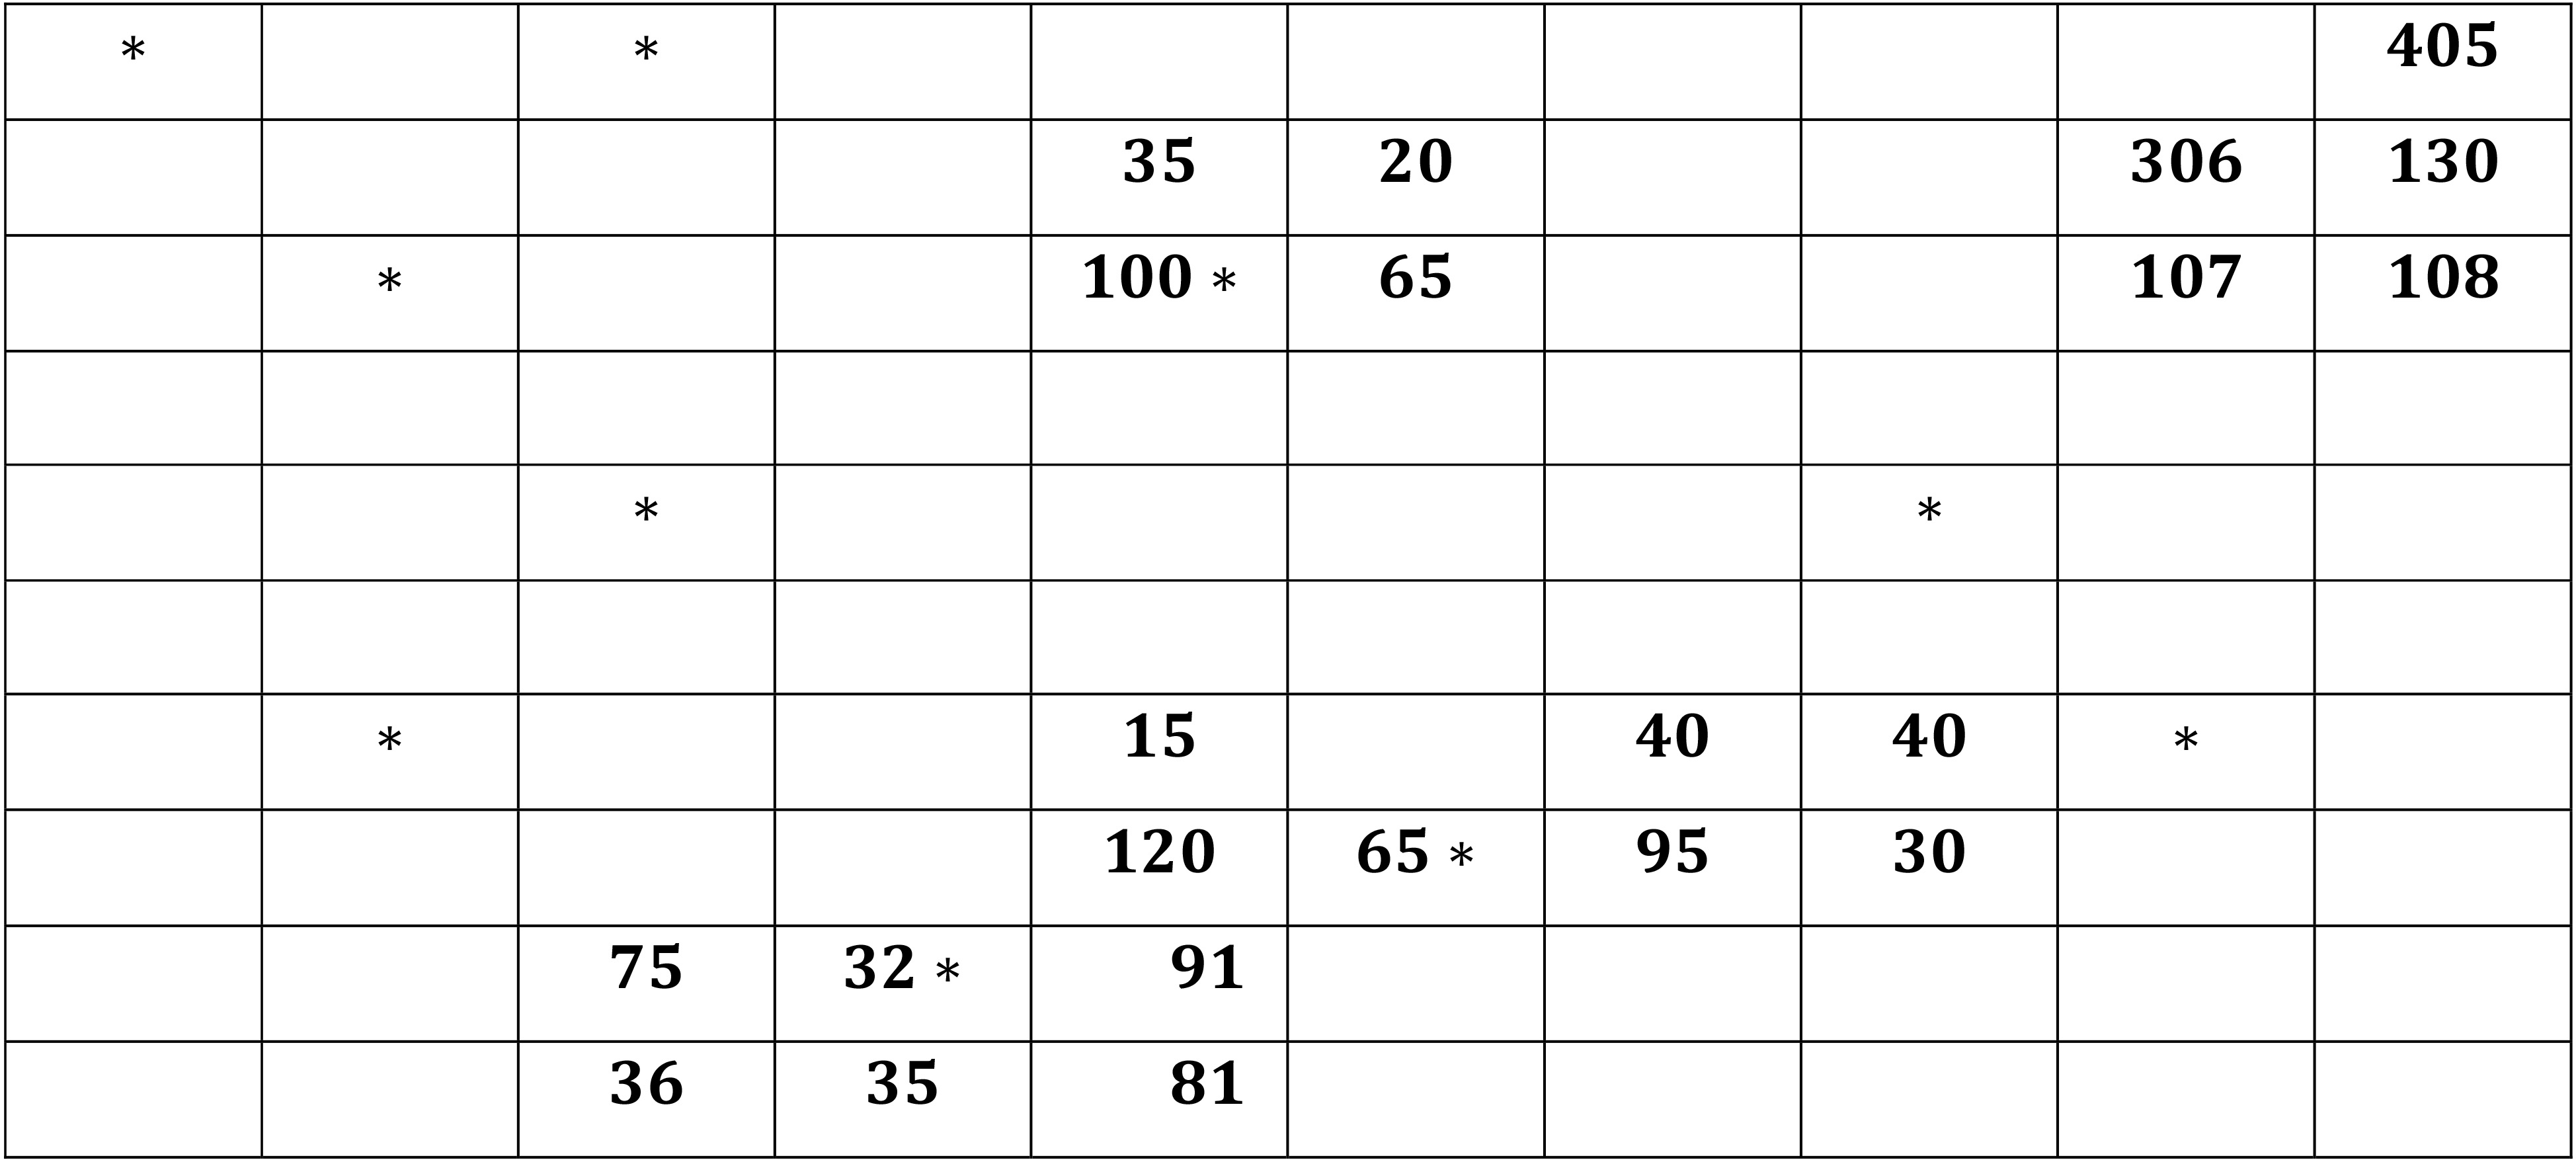
Then the procedure, negative adaptive cluster sampling was used. The networks were formed around the plots selected in the initial sample which satisfied the condition
The clusters were formed by using auxiliary information and domain knowledge of Silica content and evergreen plants. These two variables are negatively correlated. It means that the abundance of Silica in soil leads to the rare evergreen plants. A cluster involves the network units and edge units. The edge units of clusters of size more than 1 were dropped to get the networks. Only those networks which satisfied the condition
For computational efficiency in estimation of each estimator,
For establishing the condition under which the estimators used in NACS are more efficient than the traditional estimators, we repeated the simulations for different replications.
The estimated population total over r possible samples is given by
The estimated variance of the estimator of total is given by:
Where
The estimates of
Estimated values and SE of different estimators in ACS for the different values of
Estimated values and SE of different estimators in NACS and ACDS for the different values of
For presenting the cost benefit analysis of the new design we calculated the expected sampling costs in ACS and expected effective sampling costs in NACS.
Expected sampling cost in ACS is based on the final sample size (
Where
Where
Since the expected sample size under ACS is the total size of the included clusters for the variable of interest and expected effective sample size under NACS is the total size of the included networks for the variable of interest. Hence, we get
In ACS, we consider only a variable on interest and adaptation is made to get clusters. Which include the network units and edge units.
Thus, the expected sampling cost in ACS
In NACS, we consider two variables auxiliary and interest variable. Here, using auxiliary information we determine the clusters that gives us the expected sample size. Edge units are dropped from these cluster to get networks. Only, networks of interest variable is observed to get the expected effective sample size.
Expected sampling cost in NACS
Values of
The results are presented in Table 5.
To evaluate the performance of NACS, we compared the performance of the proposed modified regression estimator with that of the conventional regression estimator (SRSWOR). The results are shown in Table 3.
Estimated values of the different estimators and their standard errors for initial sample of size 45 and number of repetitions equal to 100000
ACDS controls the final sample size to some extent. But it requires the second phase sample. We were interested in finding a sampling design which will consider the type of relationship between the two variables, reduce the cost of sampling and will be more precise than the earlier developed sampling designs.
NACS differs from ACDS. In ACDS the second phase units are selected by using some conventional sampling technique and hence the sampling variations are introduced in the second phase as well. Due to this the standard error (SE) of the estimator is increased. In NACS, there are no second phase units. We take observation on all the units included in the final adaptive sample. So, sampling variations introduced in ACDS at the second phase are completely wiped out in NACS. Hence NACS performs better than ACDS under the specified conditions.
To understand the working of NACS, let us consider the following hypothetical situation.
Suppose we have population of 10 units. Let X is the auxiliary variable and Y be the variable of interest. The values of X for these 10 units be given as {1, 2, 3, 8, 7, 10, 15, 14, 4, 3}.
The corresponding values of Y be given as {20, 15, 12, 0, 0, 0, 0, 0, 10, 11}. Here, X and Y are highly negatively correlated. We use the auxiliary information to select the sample with condition
In NACS, we do not take observations related to variable of interest on the edge units in the discovered networks. So, we have introduced the term effective sample size
If we use the same estimator in ACS and NACS, the two designs are equally efficient because the two designs differ only at the design stage. The two designs differ in costs. As said earlier, NACS is more cost effective than ACS. The degree of correlation affects the performance of NACS. The two variables must be highly negatively correlated. The significance of the correlation can be tested by using the
If the two variables are positively correlated then NACS reduces to ACS. There is no problem of losing control of the auxiliary variables. In ACDS and NACS as well, we consider only one auxiliary variable. ACDS completely ignores the type of correlation between the two variables. This drawback is covered in NACS. The effective sample size in NACS is smaller than the final sample size in corresponding ACS. It finally leads to reduction in the cost of sampling in NACS.
NACS is not simply ACS for variable X but it is far different than that. There are many more things that can be studied related to NACS. In NACS, we observe the values of the variable of interest corresponding to only the units included in networks of that variable. There is no double sampling. Hence, sampling efforts are reduced in NACS as compared to ACDS.
If we drop the auxiliary information then NACS reduces to ACS. In that case we have used the condition
The modified ratio and regression estimators were used for NACS. For estimation of parameters the auxiliary information was utilized. Modified regression estimator was found to be more efficient than the modified ratio estimator. Even though, both the estimators were biased, they gave more stable estimates. As initial sample size increased the standard error of the estimate decreased.
The modified regression estimator in NACS gave us better results as compared to its use in ACDS and ACS. This estimator was found to be more efficient than the conventional regression estimator in SRSWOR as shown in Table 3. Classical cluster sampling, comparisons are often made on the basis of cost. It is often less expensive (in terms of time and money) to sample units within a cluster than to select a new cluster. Same is true for NACS.
The relative bias in the ratio estimator (
Estimated values, relative bias and SE of different estimators using various sampling designs
Among the above three estimators in Table 4, the product estimator the least values of the relative bias for the different number of repetitions and the initial sample sizes. This estimator was observed to be superior to the other two estimators. In NACS, product estimator is superior to modified ratio estimator and inferior to modified regression estimator as shown in Tables 1 and 4.
Total cost involved in NACS is expected to be much lesser as compared to ACS. Since it is assumed that the auxiliary variable is abundant and the interest variable is rare, the cost involved in selection, acquisition and measurement of units with respect to auxiliary variable is expected to be much smaller than that involved in ACS. ACS involves the measurement cost of edge units and network units.
Comparison of sample sizes and costs of sampling using ACS and NACS
Further, the cost involved in taking observations on the edge units in NACS is definitely lesser than that in ACS. There is no cost involved to measure edge units in NACS because at the stage of formation of networks, edge units are dropped without inspecting the variable of interest.
NACS assumes that the values of the auxiliary variable corresponding to all units in the population are known. For large geographical areas, it is very difficult to get such information. It limits the applicability of NACS. So, further research is required in that direction. One may think about using the idea of double sampling in NACS.
The proposed NACS methodology was studied on a small pilot study. If the population size is large we will get more precise idea about the proposed estimators.
We had presented number of samples ranging from 5000 to 100,000 of sizes varying from 15 to 45 each from probability proportional to size with replacement and without replacement. Table 1 showed that as the initial sample size increased the standard error of HH and HT estimator decreased. Hence, our proposed methodology is consistent to statistical regularity principle. The modified regression estimator is more efficient than the modified ratio estimator and product estimator as shown in Tables 1 and 4.
If information of auxiliary variable is available and it is known that the auxiliary variable and the variable of interest have negative correlation then NACS gives very close estimate of the population total. Ratio and regression type estimator are biased for population total. But in this case the regression type estimator gives a very close estimate of the population total than the ratio type estimator and product estimator. Moreover, the estimate of the standard error of regression estimator is lesser than that of the ratio estimator and product estimator.
The estimator based on SRSWOR gives a poor estimate of the population total with a high standard error. Hence in case of NACS use of regression estimator is recommended. NACS reduces the cost and efforts substantially. This method is very useful for the selection of rare species, plants and diseases. Also, this method has several applications in environmental science, ecology, forestry, health science, mining industry and market research. The proposed modified ratio and regression estimators for NACS give better results. As sample size increases the standard errors of these estimators decrease. The efficiency of modified regression estimator is more as compared to modified ratio estimator as well as the modified HH and HT estimators of the ACS. NACS method is cost efficient as compared to ACS and other conventional sampling methods.