
Abstract
The Bank of Russia is one of the unique banking regulators in the world as it discloses granular reporting information per the existing credit institutions with the available historical track record. Same time the number of banks dramatically declined from above two and a half thousands in 1990s to one thousand in 2010 and to around 350 in 2021. Such information stimulates designing default probability (PD) models for the Russian banks. There is a separate stream of research that studies the amount of negative capital revealed when the Russian bank got its license withdrawn. However, the existing papers have several shortcomings. First, most of them do not account for the structural breaks in data. Second, there is no search for the best fitting model, just a model is offered and the coefficients of interest are interpreted. Third, the best model is poorly interpretable. Forth, the existing models make short-term forecasts. Fifth, there is no a LGD model for Russian banks, though the amount of negative capital upon license withdrawal was considered. Thus, our research objective is to study PD-LGD correlation (PLC) for the Russian banks. To do so, we improve the existing Russian banks PD model and create a respective novel LGD model. We use the homogenous dataset from 2016 to 2021. We find that PLC for Russian banks equals to
To the memory of Alexander Sidorov from Novosibirsk
with whom we discussed PD and IRB modelling and
who focused on oligopolies, e.g., see (Sidorov, 2018)
Introduction
The pandemics of 2020–2021 has significantly raised the credit risks world-wide. BIS researchers (Aramonte & Avalos, 2020) find that the default correlation of the credit default swaps (CDS) exceeded the levels observed in 2007–09. We already heard of some large bankruptcies of car rental business of Hertz or of the cosmetics of l’Occitane from (Goldfine, 2021). However, the Chairman of the Basel Committee noted in April 2021 (Hernández de Cos, 2021) that we did not observe large bankruptcies alike Lehman collapse in 2008. He is still cautious to proclaim it a victory. For instance, Swiss researchers (Eckert et al., 2020) argue that defaults may come a year or two after the stimulus measures are lifted away.
Credit risk management is intended to capture those portfolio effects of the increased default correlation. There is a more formal tool to do it. It is called the Internal Ratings-Based (IRB) approach. It allows banks to use own data and models to calculate prudential ratios. Basel II accord of 2004 gave an opportunity for banks to first apply for IRB. Local regulator has to validate IRB models prior to its business-as-usual run. Simplistically, the IRB approach relies on the two core credit risk parameters: the probability of default (PD) and loss given default (LGD). These parameters may be related to one another. It is known as PD-LGD correlation (PLC). In the presence of positive PLC, the portfolio credit risk is larger than if there is none. Inversely, the negative PLC represents a sort of diversification and implies lower portfolio credit losses. As a practical outcome, position limits given the positive PLC should be smaller than in the presence of the negative one.
Though the concept of PLC is intuitively clear, it requires granular recovery data to compute it. Not many banks do possess such data or are ready to invest in its purchase or proper collection. Disregarding the computation challenges, the regulator sees the importance of PLC effect. That is why to avoid requesting banks to bear excessive costs, the regulator suggests to introduce a conservative margin to LGD to offset the credit risk rises from positive PLC. This produces a so-called Downturn LGD (Miu & Ozdemir, 2006). However, if there is negative PLC, then actually such a downturn adjustment to LGD is not justified.
That is why, our objective is to study the presence of PLC for a special lending segment, i.e., lending to the Russian banks. As a preview of our findings, we find that the respective correlation is negative. To arrive at it, we present the literature review in the Section 2. We discuss the available data and our approach to its processing in Section 3. Empirical findings are in Section 4. We discuss the credit risk management implications in the concluding Section 5.
Literature review
IRB approach relies on the Vasicek portfolio loss distribution model (Vasicek, 1987), (Vasicek, 2002), (BCBS, 2005). It has various shortcomings. Those include the assumption of perfect granularity, independence of risk parameters, specific choice of the risk-measure and confidence level. Separate problems arise when the model is sculptured in the regulatory format. For instance, negative capital requirements for the low default portfolios when the maturity exceeds one year or non-verifiable parameterisation of asset correlation (Penikas, 2020a).
However, we would like to focus on PD-LGD correlation in this paper. Moody’s (Meng et al., 2010) used the American data and arrived at its estimate of around
PD-LGD Correlation for the USA in 1982–2009 Equals to 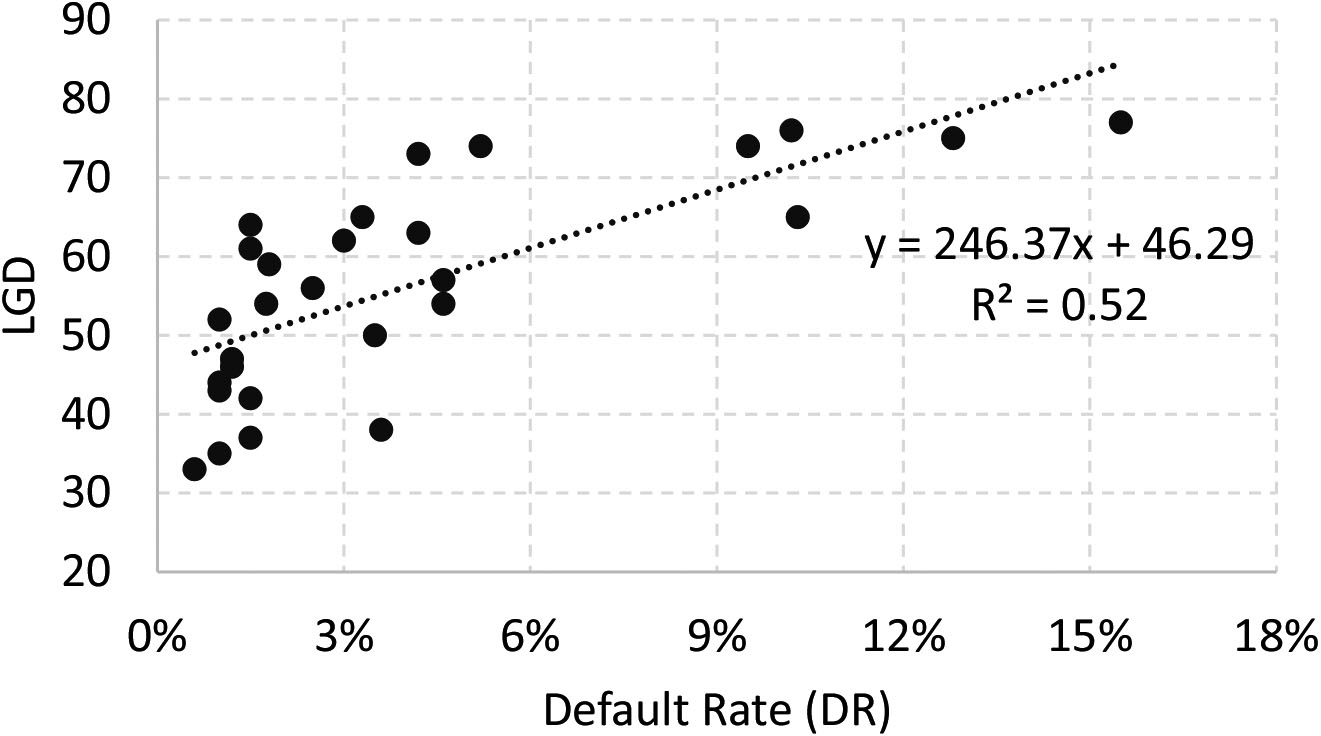
The Bank of Russia is one of the unique banking regulators in the world as it discloses granular reporting information per the existing credit institutions with the available historical track record. Same time the number of banks dramatically declined from above two and a half thousands in 1990s to one thousand in 2010 and to around 350 in 2021. Such information stimulates designing default probability (PD) models for the Russian banks. If we were to model PD for Russian enterprises, we should have considered the findings by (Orlando & Bace, 2021) who find oil prices to impact PD in oil-exporting countries like the Saudi Arabia. For useful considerations when modelling PD at turbulent times, we recommend the reader to refer to (Fantazini & Maggi, 2013).
There is a separate stream of research that studies the amount of negative capital revealed when the Russian bank got its license withdrawn. However, the existing papers have several shortcomings.
First, most of them do not account for the structural breaks in data. Those relate to the episodes of the economic crises in Russia (e.g., in 2005, 2009, 2014) and to the changes in accounting methodology (regularly since 2004 to 2016). For instance, (Shibitov & Mamedli, 2019) consider 2014–2018; (Mamonov, 2020) covers 2008 to 2019, (Fungacova et al., 2021) deal with 2002–2020 data.
Second, there is no search for the best fitting model, just a model is offered and the coefficients of interest are interpreted (Zhivaikina & Peresetsky, 2017), (Fungacova et al., 2021).
Third, the best model is poorly interpretable. For example, (Shibitov & Mamedli, 2019) claim having used above 720 explanatory variables.
Forth, the existing models make short-term forecasts. For instance, (Fungacova et al., 2021) predicts defaults for one month ahead, (Zhivaikina & Peresetsky, 2017) and (Mamonov, 2020) do it for three months ahead, (Karminsky & Khromova, 2018) forecast for two quarters ahead, (Shibitov & Mamedli, 2019) study default for up to nine months horizon. However, the internal-ratings based (IRB) approach prescribes predicting for one-year ahead at least (Penikas, 2020a). The IFRS 9 accounting standard requests predicting for even longer time spans, i.e., to derive the so-called life-time PD. This means that the existing models cannot be applied by banks in day-to-day risk-management procedures due to their myopic vision (predicting PD for shorter than one year horizon).
Fifth, there is no an LGD model for Russian banks. Previous researchers (Mamonov, 2020) tried to benchmark the lost amounts at default to the total asset amount. However, the lost amount when benchmarked against non-own funds represents exactly the Loss Given Default (LGD) in relative terms. But a proper LGD model was not developed yet for Russian banks. As a consequence, no one studied the effect of PD-LGD correlation (PLC) for the Russian banks as borrowers. Same time PLC is an important parameter in risk-management as we discussed above. When present, it may significantly exacerbate the amount of credit risks.
Thus, our research objective is to study PLC for the Russian banks. To do so, we improve the existing Russian banks PD model and create a respective novel LGD model. We use the homogenous dataset from 2016 to 2021.
We utilize the data on the Russian banks. We list the variables used in Appendix A. We did an implicit multicollinearity check. We tried to ensure that the coefficient estimates do not drastically change from specification modification, thus proving no material exposure to multicollinearity.
We depart from methodologically homogenous monthly financial reports from 2016 to 2021. During this time the number of Russian credit institutions decreased three-folds from 1139 to 350.
Previous researchers focused on predicting the bank license withdrawal. We consider two additional credit events. It is the start of the bank sanation (resolution or liquidation) by the Deposit Insurance Agency (DIA) or the disclosure of significant loss after bank inspection by the Central Bank of the Russian Federation (the Bank of Russia). Thus, three credit events form the default definition. In order to predict the default probability one year ahead, we resample the default flag twelve month prior to the earliest of the three credit events.
As we may see from Table 1, we do not have a sparseness problem as the mean proportion of defaults is around 11% of the total number of observations.
PD and LGD Estimates for Russian Banks; numbers are given in per cent (%)
PD and LGD Estimates for Russian Banks; numbers are given in per cent (%)
Due to vast amount of data, we decompose it into training and testing sets. The latter one considers the last two years of data (2019–2021). We attempt at offering the best model, not limited to some model like it is done in (Zhivaikina & Peresetsky, 2017) and (Fungacova et al., 2021). We look at the statistical significance of the coefficients for the independent variables and minimize the type one error at the testing set. The statistical significance is measured using conventional Wald test. Type one error is the number of incorrectly predicted defaults. We introduce a value of one minus type 1 error and call it a ‘default prediction accuracy’ (DPA) indicator. When applying the best model to the testing data, we obtain the PD predictions. To arrive at the PLC, we now need to obtain LGD values.
Russian Banks Actual LGD distribution.
LGD data is scarcer, than that on defaults. There are only 131 cases of lost amounts disclosed by the Bank of Russia. Figure 2 presents the actual LGD distribution. We assign two observations as outliers with LGD of around 250%. Those are Credo Finance (license No. 793) and ArksBank (license No. 1868). Both of them defaulted in July 2016. The case of Arksbank is the most notorious. It had the capital as of end of liquidation equal to RUB
We use Heckman model to adjust for probable bias in model coefficients when predicting LGD as we do not observe LGD unless a bank defaults. We use the PD model determinants for the Heckman selection equation. Similarly to PD, we resample LGD values twelve months before the event to have a one year ahead LGD prediction. Due to scarcer number of LGD observations compared to that of PD, we choose the best model based on the full sample goodness-of-fit criteria following recommendations from (Diebolt, 2015). As a result, we predict LGD values.
To obtain the PD-LGD correlation (PLC) for Russian banks, we take the earlier predicted PD and LGD values for banks that exist in January and February 2021. We evaluate PLC as the correlation between these predicted values.
Furthermore, we compare the credit risk values for various PLC levels. To do this, we use gamma distribution for PD and beta one for LGD. We find the distribution parameters such that we have PD and LGD means and standard deviations as close as possible to those for the predicted dates.
The developed PD and LGD models are available in Appendices B and C, respectively. Marginal effects for the developed PD model are available in Appendix D. Below we demonstrate the model characteristics. Our PD model has AUROC of 91%, see Fig. 3. The corresponding accuracy ratio (AR) is around 82% and the McFadden pseudo R-squared is 33%. It is superior to the PD model of the US banks that has an AR of 78% (Kocagil et al., 2002). The pseudo R-squared is higher than the PD model for Russian banks from (Zhivaikina & Peresetsky, 2017). The corresponding log likelihood function value is
ROC for the developed PD model.
AUROC is higher than the PD model for the Russian largest corporate borrowers from (Ermolova & Penikas, 2017b). The advantages of the developed PD model are as follows. It is the first banking PD model that uses the information on the turnover by the accounts. The subtotals by local and foreign currencies are additionally considered, whereas the previous models dealt with the gross totals only. The PD drives were chosen by a step-wise selection of around ten thousands of five-digit accounts from the balance sheet equivalent reporting form No. 0409101 and from around a thousand of aggregates from the balance sheet form No. 0409806 for the TOP-30 Russian banks. As a result, we obtain robust default prediction of above 60% at the testing set, see confusion matrix at Fig. 4.
Confusion matrix for the developed PD model.
As for the LGD model, we managed to find ten statistically significant drivers whereas comparable models from before (Mamonov, 2020) used only six (five banking controls and a new maturity indicator). Figure 5 shows the scatterplot for the predicted and actual LGD values.
Scatterplot of actual LGD (Vertical) versus predicted LGD (Horizontal).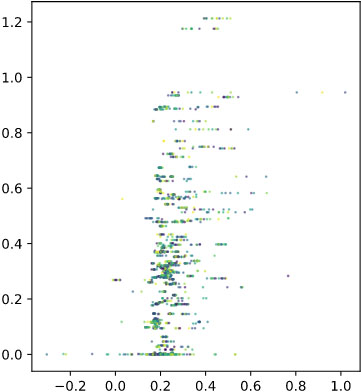
We proceed with PLC estimation. We take the PD and LGD predictions for two testing dates of January and February 2021. We apply those for the existing banks. Thus, no double treatment of banks with already known LGDs happen. The corresponding scatterplots are available in Figs 6 and 7.
PD-LGD Correlation for Russian Banks as of January 2021.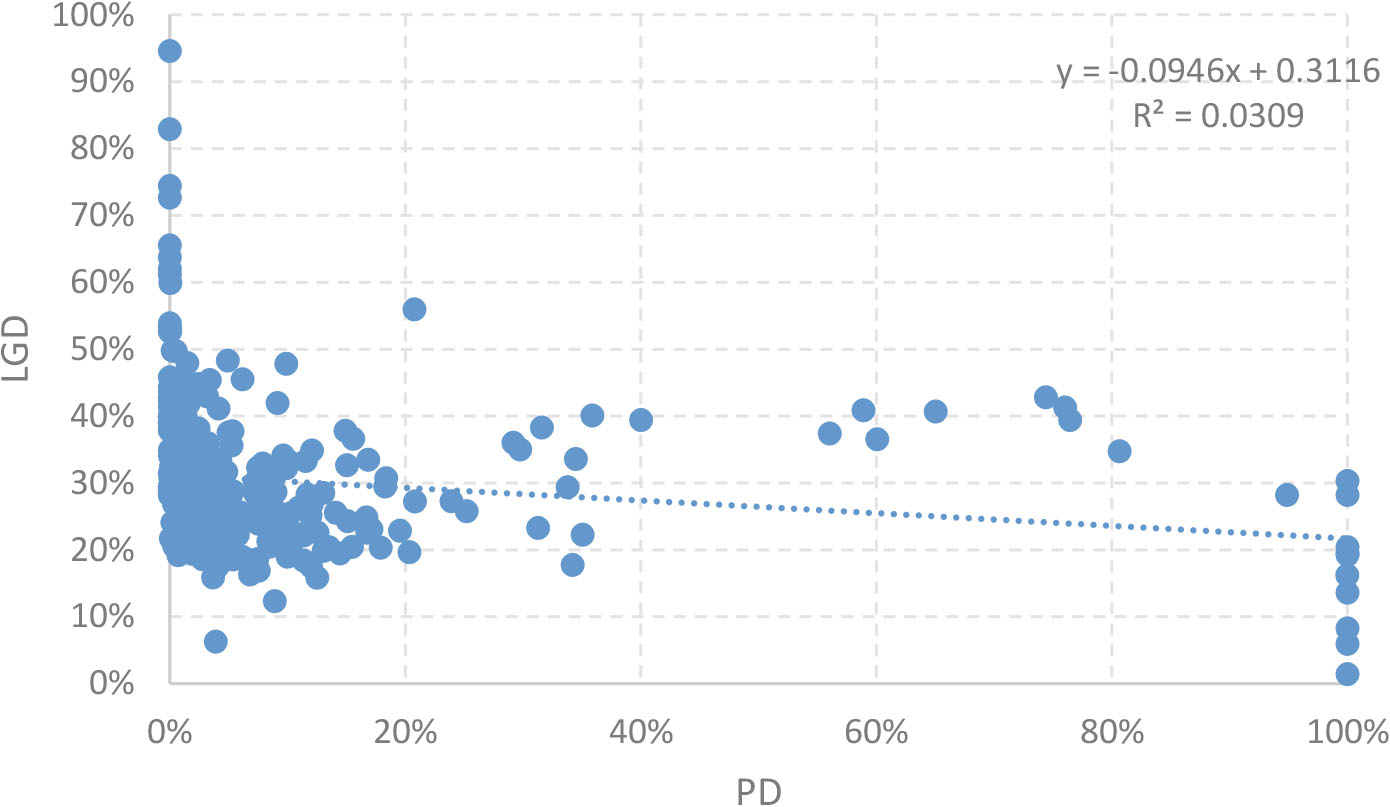
We summarize PLC estimates, as well as PD and LGD statistical characteristics in Table 2. The pooled average PLC is
When we exclude those extremes of PD equal to zero or one, we see PLC of around
PLC Estimate for Russian Banks; numbers are given in per cent (%)
Quantiles of the Risk Distribution (PD x LGD) Given PLC; numbers for quantiles and PLC are given in pre cent (%)
PD-LGD correlation for russian Banks as of February 2021.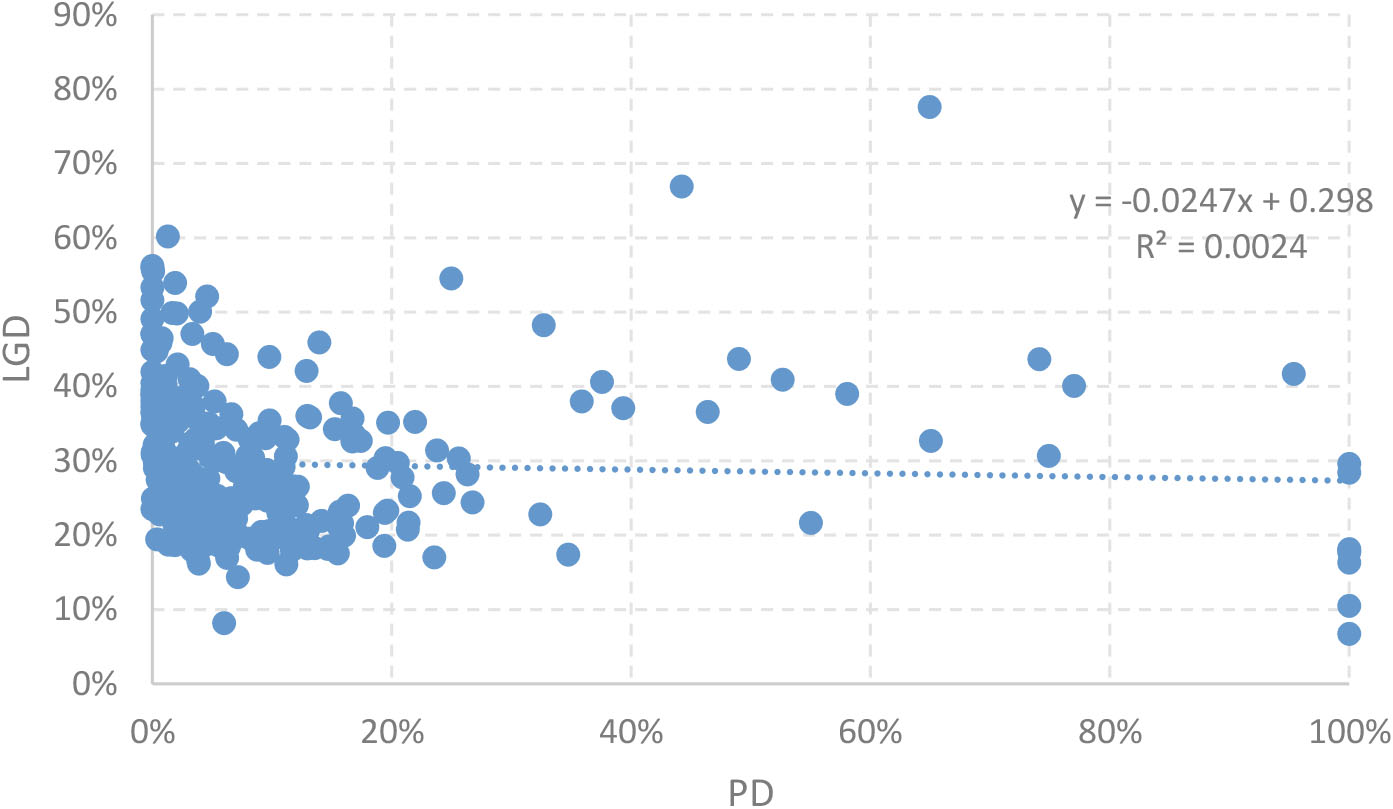
We have shown that PLC for Russian banks is around
To quantify the impact on credit risk, we take the PD and LGD distribution characteristics from Table 1. We fit gamma and beta distributions, respectively, in a way to get closer to the actual mean and standard deviation of distribution. That is why we use slope (a)
Table 3 lists five most widely spread confidence levels. 95% is a typical one used in statistics. 97.5% is the level used for the expected shortfall for the market risk after the fundamental review of the trading book (FRTB) (BCBS, 2013). 99% is the level used for the market and operational risk internal models before FRTB. 99.5% was first suggested to be used in IRB (Penikas, 2020a). 99.9% is the ultimate level chosen for the IRB.
As we can see from Table 3, the credit risk for the positive PLC of
Footnotes
Acknowledgments
Author acknowledges the valuable recommendations from the anonymous reviewers and from the participants of the International Conference on Data Analytics and Computational Techniques (ICDACT), 7–9 December 2021.
Opinions expressed in the paper are solely those of the author and may not reflect the official position of the affiliated institutions.