
Abstract
Crop statistics for a small area, such as the community development block, are an increasingly important topic in agricultural statistics. Under normality assumptions, the classic Empirical Best Linear Unbiased Prediction (EBLUP) technique is effective for predicting small area means, however the Small Area Estimation (SAE) model can be heavily affected by the incidence of outliers or deviations from the expected distribution. The purpose of this study was to estimate variance, predict block-level wheat crop yield in the Hisar and Sirsa district of Haryana by classical SAE method and a robust random-effect predictor using a slight generalization of Huber’s Proposal 2. In the case of Sirsa district, the results of classical and robust unit level SAE were very close, but not in the case of Hisar district. This could be due to the influential observation found in the Hisar data set. More accurate EBLUP wheat yield estimates are obtained when the Huber-type M-estimation method is initialized by the least square regression estimator.
Keywords
Introduction
The bedrock of any agricultural statistics system is crop area and crop production. In India, crop area data is based on entire listing whereas the crop yield is estimated based on sample survey approach. The General Crop Estimation Surveys (GCES) program’s crop-cutting experiments (CCEs) serve as the foundation for the yield rate estimates. A CCE involves selecting a field that is currently producing a particular crop at random, finding and designating a plot of a specific size and shape there according to preset instructions. The harvested grain is weighed after drying to decide the salable form of produce because it has moisture on the day it is harvested. For yield estimates, more than 800,000 samples of CCEs are collected annually. Estimates of crop production or yield by CCE are recorded at district level and are collated at state and country level. Although this method can provide reliable estimates at district level, the method is time-consuming and time ands resource consuming-consuming, as a result of which the CCE procedure is not followed in many places by an enumerator which leads to incorrect data reporting. In order to enhance the accuracy of the data obtained under the GCES, the ’Improvement of Crop Statistics (ICS)’ program has been initiated. Under this program, quality assurance of GCES’ field service is conducted by overseeing about 30,000 CCEs. The conclusions of the ICS study indicate that CCEs are often not carried out precisely causing the shortage of expected accuracy in the data. Given the limitations of resources and infrastructure, the GCES sample size needs to be significantly reduced so that the enumerator ’s work volume is minimized and, therefore, better supervision of the CCE ’s operation can lead to improved data quality. But reduction in sample size will directly impact the estimator’s standard error. The reduced sample size is more alarming to produce estimates at lower administrative levels, because estimators may be unreliable based on sample data. In addition, (Tikkiwal & Tikkiwal, 2000) and (Tikkiwal & Ghiya, 2004) reported that CCE direct estimates are almost accurate at both national and state levels but are not valid at lower levels. However, the computation of crop production statistics for a small area, such as the Community Development Block, has received increasing interest in India in recent times. This is partly due to the fact that regional planning is mostly carried out on a local or regional basis and to the allocation of central funds.
Ministry of Agriculture and Farmers Welfare, Government of India (GOI) emphasizes the use of advanced technology to answer the issue of the accuracy of the CCEs as well as their validity and speed of operation. This will ensure fair assessment and prompt payment of farmers’ claims. Since the advent of a range of satellites with high resolution images orbiting the Earth, there has been a major increase in satellite imagery products. Several scientific studies are designed to translate satellite information into reasonable crop yield estimates at the individual pixel and segment levels. Assessment of vegetation and monitoring of changes in vegetation patterns are concerned with the management and monitoring of natural resources, such as crop vigor analysis (Thiam & Eastman, 1999). Healthy crops are characterized by a strong absorption of red energy and a strong reflection of near-infrared energy (Taylor et al., 1997). A strong contrast between absorption and dispersion of red and near-infrared bands can be combined into different quantitative indices. Such statistical quantitative combinations shall be referred to as vegetation indices. Since the late 1980s, numerous studies have been conducted on crop growth analysis using the Normalized Difference Vegetation Index (NDVI) to support precision farming. Several studies have shown that there is a significant correlation between yield and NDVI value. The small sample size problem can be easily addressed using the available auxiliary information to enhance inadequate sample information from the study area. Small Area Estimation (SAE) is the principle behind it. The SAE practices are usually based on model-based practices, see for example (Pfeffermann, 2002; Rao, 2003). The concept is to utilize statistical models to connect the concerned variable to the ancillary data. e.g., administrative data, remote sensing data, etc. for smaller areas to describe area specific model estimators (Chandra, 2013; Jaslam et al., 2020). Such small-area models are divided into two specific groups.
Area level random effect models are applied when the ancillary data is accessible only at area level. They connect the small area direct survey estimates to area specific covariates (Fay & Herriot, 1979) and, Unit level random effect models, initially explained by (Battese et al., 1988) Such models link the unit values of the study variable to the unit-specific covariates.
In many SAE concerns, the unit level small area model is rarely used primarily due to unavailability unit level data. This study aims to estimate precise wheat crop yield estimate at block level using remote sensing and administrative data under unit level random effect model along with its mean squared prediction errors.
It is not possible to increase the number of CCE’s. The only solution here is to complement and reinforce the data by using relevant and influential auxiliary information to boost the reliability of small area estimates. in particular, the study variable in this study is yield of wheat crop. Yield data from the CCEs of wheat crop under the ICS scheme were collected for the Hisar and Sirsa Districts of Haryana, India during the period 2018–2019. We are focused on estimating the wheat crop’s average yield at the block level. The district of Hisar, situated between 29.12
In this study, we consider unit-level SAE models that link the study variable to the unit-specific covariates followed by the calculation of the maximum likelihood (ML), the Huber-type M estimates and the Prediction of random effects and area-specific means. The theoretical approach of the SAE has been outlined in the following section.
The best linear unbiased prediction (BLUP) estimator integrates a straightforward estimator with an indirect estimator so that the direct estimator gets more weight if its MSE within domain
The random effects
respect to one another. After accounting for the fixed part of the model, the variance of the random effects (
that is, because the residual likelihood is near to zero, The SRE and the manifestation of the random effect are added to yield the BLUP estimate of the population mean within area
where
that controls the bias correction factor’s weight based on model performance and the number of collected population elements with the domain
Marginally, the basic unit-level model is defined as
with
The maximum likelihood (ML) method can be used to estimate the parameters
For the model Eq. (5), the non-constant part of the log-likelihood,
where
where
As long as the maximum on the boundary is not reached the solution to the system of Fisher-score equations are the maximum likelihood estimates,
The MLE of
where
Equations (8) and (10), on the other hand, do not include a closed-form representation and must be answered by means of some iterative numerical optimization techniques.
Taylor-linearization can be used to estimate the domain-specific MSE of the EBLUP estimator. The MSE estimator consists of four components (Prasad & Rao, 1990).
where
The second component accounts for uncertainty introduced by the estimation of the coefficient vector
with the population means
results from the identity matrix
The third component compensates for the variation introduced by the estimate of the variance components
with
where
The fourth component is an area-specific version of the third component and given by
where
Though the standard EBLUP approach is effective for estimating small area means under normalcy norms, it is significantly affected by the existence of outliers in the data. Furthermore, contrasting regression or locationscale model the mixed linear models lack a nice invariance structure. Notably, this indicates that in the presence of contamination, the parameters cannot be estimated consistently – there is an unavoidable asymptotic bias. Any approach may estimate the parameter at the core model with an unknown bias when contamination is involved. The bias in ML estimators can be very significant, making these estimators exceedingly inefficient (Welsh & Richard, 1997) Many researchers recommended robust evaluation procedures in mixed level modeling going from rather algorithmic approaches (Rocke, 1983, 1991) over robustification of mixed-model equations by Henderson (Fellner, 1986) to substituting the Fisher scores by robust Frechet-differentiable statistical functions (Bednarski & Zontek, 1996). (Copt & Victoria-Feser, 2006) have proposed an S-estimator and provide software for balanced data. The M-estimator-type methods, based on either a robustified likelihood (RML 1) or bounded influence estimating equations (RML 2) have received considerable attention in the literature (Richardson & Welsh, 1995).
Robust M-Estimator EBLUP
When there is contamination, the ML estimates can be significantly influenced. It is therefore sensible to substitute the system of Fisher-score Eqs (8) and (10) by estimating equations (EE) whose influence functions are bounded – i.e., so-called bounded-influence estimating equations (BIEE). BIEE for
BIEE for
For the fixed effects,
where
The Solution of the above equation shall be achieved by an iterative re-weighted least square (IRWLS) procedure and that’s the mainstay for calculating
where
Put
Now, the above equation is a classical least squares problem, we iteratively obtain revised estimates of
A bounded-influence EE for
where
BIEE for
For the estimator of
Schoch [24] proposed the method to solve (3.3.19) by means of Brent’s root-finding algorithm (Brent, 1973). Further, (Schoch, 2012) showed that robust estimate of area-specific means can be computed much easier through a robust predictor of random effects based on the (Copt & Victoria-Feser, 2009) proposal
The Robust EBLUP of
where
Estimation of MSE of small area estimators is a challenging problem even in the case of classical EBLUP estimators. (Sinha and Rao, 2009) introduced a parametric bootstrap method to compute MSE of prediction based on the robust estimates
These methods are adopted in this study for variance estimation, prediction of the area-specific means and MSPE estimation.
Unit level empirical best linear unbiased prediction estimator
To validate the expectations of the core model, the model diagnostics were conducted. The distribution of the village level residual plots shows that residuals from the model are randomly distributed, and the line of fit does not significantly differ from the line
The next step is to construct the model. The Hisar district model is as follows:
Here, Fixed Effects: YIELD
Area-specific random effects: Blocks
No. of areas: 9 blocks
No. of observations: 275 villages
The following is the Sirsa district model:
Here, Fixed Effects: YIELD
Area-specific random effects: Blocks
No. of areas: 7 blocks
No. of observations: 327 villages
After setting up the model, the parameters of the model are estimated using the ML method. Coefficient value of NDVI was found to be highly significant (
Robust EBLUP method for unit level estimation
The default-mode setup of the Huber-type M-estimation methodology for SAE explained by (Schoch, 2012) is used to estimate the parameter. Further, if the default mode failed to converge. The safe-mode algorithm can be used in which initialization of the method is done by a fast-LTS regression estimator. Estimates of SAE-model for Hisar and Sirsa district are given below (Table 1).
Estimated coefficients of SAE- model under Huber M estimation method
Estimated coefficients of SAE- model under Huber M estimation method
After estimating the parameters of the Gaussian core model, we considered predicting random effects with the Robust EBLUP method and computing area specific MSE (prediction) with a robust parametric bootstrap technique for both estimation procedures (ML and Huber M estimation). These are done for comparison purposes The output of the analysis is presented in Tables 2 and 3. Mean Square error value is considerably lesser when EBLUP estimation done using Huber M estimation methodology compared to maximum likelihood estimation procedure. It is also worth noting from Fig. 2 that the CV per cent of the two approaches vary notably in the case of Hisar but not in the case of Sirsa.
Robustly predicted wheat yield (kg/ha) under maximum likelihood estimation
Residual vs Leverage plot for Hisar and Sirsa districts.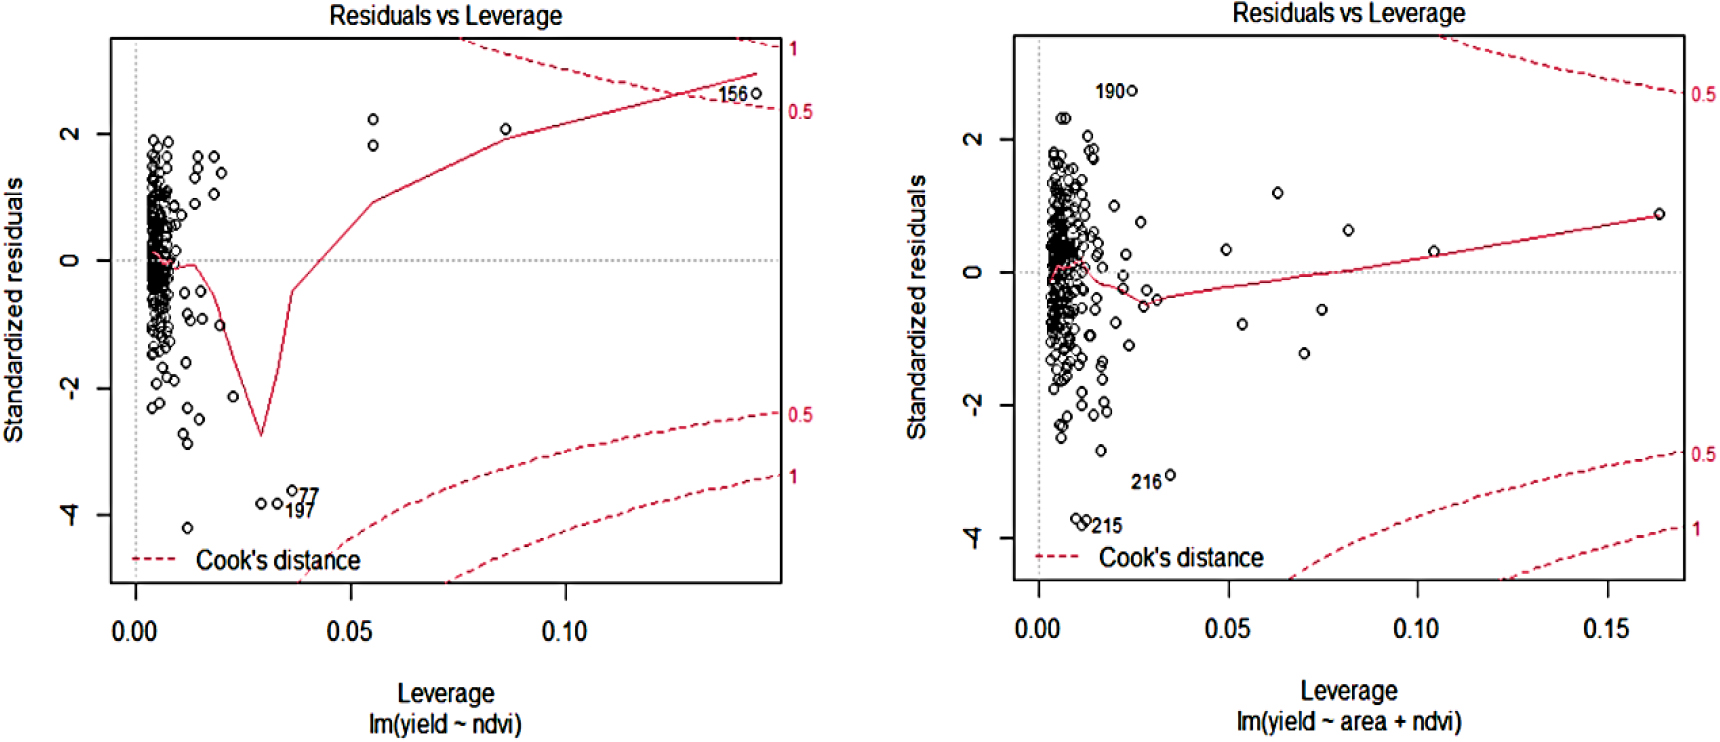
Robustly predicted wheat yield (kg/ha) under Huber M estimation
Block wise CVs for the wheat yield estimate by ML and Huber M estimation.
REBLUP estimates of the wheat yield for Hisar and Sirsa districts.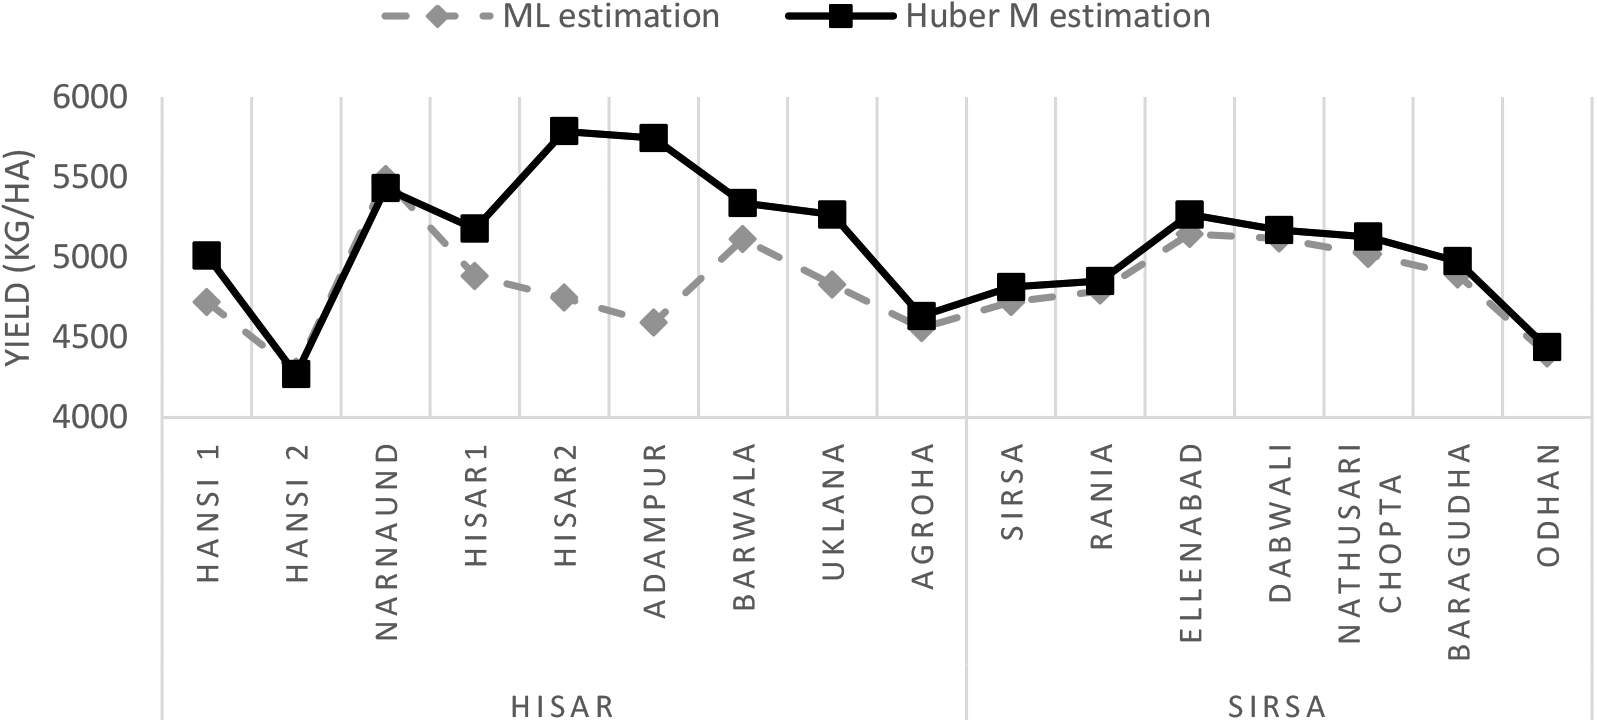
This may be due to the observed influence point in the Hisar district. Figure 3 shows the block level EBLUP estimate of wheat yield is calculated using the robust method for Hisar and Sirsa districts. As previously stated, the classical EBLUP approach is effective for valuing small area means under normality conditions. However, the existence of outliers in the data can have a significant impact on it. In the presence of outliers in the data, a robust small area estimate approach must be attempted. The Residual vs. Leverage plot (Fig. 1) revealed an influential point in the Hisar district and evaluating this data using Robust SAE technique produced better estimates (in terms of CV) than the classic unit level EBLUP technique.
The robust method of small area estimation approaches is very effective in restricting the effect of outliers on small area estimators. Now, the GOI emphasizes micro-level planning. Estimates of the EBLUP may make a significant contribution to the allocation of resources and to decision-making. Such yield estimates are also useful when classifying blocks with less crop yields to draw the attention of the planner. For the purpose of estimating micro-level yields, these techniques can be broadly applied to additional data sets from various small areas and crops.
Footnotes
Acknowledgments
This research was supported by CCS Haryana Agricultural University. We are thankful to our universities that provided us with wonderful facilities. The authors are also grateful to the Mahalanobis National Forecast Centre, New Delhi, for providing ground truth data on wheat production.