
Abstract
This paper proposes a new classification model using the Bayes method. This model not only determines the prior probability based on the k-means algorithm, builds the method for estimating the probability density function via the kernel function, but also classifies the objects to the known populations. The proposed model is described via the experiment of image classifying. In this example, we first use the Gray level co-occurrence matrix to extract the features of images, and next classify this data set based on the improved Bayesian method. In another application, we also build the classification problem for the Algerian Forest Fires data set. The outstanding advantages of this method are the adaptive ability of the kernel function, the classification for multi-class, and the reduction of computational costs. In addition, the experimental results also show the potential of the developed model.
Introduction
Classifying by the Bayesian method is a technique of supervised learning model used very commonly in machine learning. The classification problem has been applied in many fields such as economics, medicine, technology, etc. Currently, there are many methods to classify. The main methods used popularly are Fisher (Fisher, 1992), Logistic regression (Hosmer et al.,1991), Linear Discriminant Analysis (LDA) (Izenman, 2013), Support Vector Machine (SVM) (Tanveer et al., 2019) and Bayesian method (Murphy, 2006; Vo-Van et al., 2018). For each method, we have some different approaches. For example, the SVM algorithm is constructed by a separating hyperplane with the maximal margin. Since only support vectors are used for classification and many majority samples far from the decision boundary can be removed, SVM can be more accurate on moderately unbalanced data. However, SVM is sensitive to high unbalanced classification since it is prone to generating a classifier that has a strong estimation bias towards the majority class and would give a bad accuracy in the classification performance for the minority class, which is discussed in the work of Tang et al. (2008). Furthermore, in many cases, this method is still limited because it has to assume some conditions which are very difficult to satisfy in reality. The Bayes method does not require the conditions for data and can classify many populations (Tai et al., 2016; Vo-Van et al., 2018). Considering the different distances, and inheriting the previous results, Vo-Van et al. (2018) proposed the
In the Bayesian method, determining the prior probability is very important. Nguyen-Trang and Vo-Van (2017) proposed a method to determine the prior probability based on the fuzzy clustering algorithm. However, it only improved the prior probability that did not take the other important problems for classification problems. Therefore, it did not obtain good results. Then, Vo-Van et al. (2018) have had important contributions to the theory of Bayesian classification, but they only considered the case of two populations. Compared with discrete data, classifying images is more complex in terms of algorithms and computational problems (Zhao et al., 2019). In general, a typical image classification algorithm consists of two main phases: Extracting the features of the image, and building the principle for classifying images from the extracted features. The process of extracting the characters is to seek out the representative elements for the image to distinguish it from others. Presently, there are three prominent features commonly accustomed to extracting features of an image. Swinging on the classification problem, different significant features are commonly proposed, such as colour, texture, and shape (Tang et al., 2008). Some studies such as Zhao et al. (2019), Vo-Van et al. (2018) had confirmed that there was yet no method that reached an optimal solution for all situations. It depends on the set of images and the purpose of the classification. This study is interested in extracting the features of images to classify them. For this approach, first, the grey-level co-occurrence matrix (GLCM) is determined, thereby outputting the texture feature results. The texture features retain valuable details about the fundamental arrangement of the surface, so for X-rays images, it proves suitable characters to represent the image.
From the above analysis, we realize that multi-class classification using the Bayesian method, especially the application to images is still limited. In this study, we improve the important steps of the Bayesian method to obtain the best result. Specifically, the following issues will be upgraded:
Find the prior probability of each class based on the k-means algorithm. Introduce a method to estimate the probability density function for multi-class data. Improve the Bayesian method for the multi-population case. In addition, the proposed algorithm can classify many elements at the same time instead of one element as the existing algorithms. Calculate the fuzzy relationship between each population and the considered objects. The computational program reduces the cost and the running time.
Moreover, the study has considered the method to extract the features of images based on the kernel function. Working on the two data sets, the proposed model has shown outstanding advantages in comparing with the existing algorithms. Moreover, this implementation can be fundamental to many important practical applications in different fields.
This paper is organized as follows. Section 2 introduces the basic concept of the Bayes theorem. Section 3 presents the method for extracting the features of images. The experiment and discussion are described in Section 4. The numerical examples are illustrated in Section 5. The conclusion is given at the end of the paper.
Given
Given the classified element, represented by a vector
When the variables are independence, we have
Then, we obtain the following result:
In fact, the data required to perform the classification problem are discrete, so to apply the Bayesian method, the first thing to do is to estimate the probability density function. There are many parametric and non-parametric methods for estimating. In this paper, we use the kernel function, a common method at present for real applications (Vo-Van et al., 2018; Vovan, 2017).
For the case of the n-dimensional, the density probability function for each population is estimated by the kernel method with the following form:
where
The gray level co-occurrence matrix (GLCM) for an image with size
The descriptive structure of GLCM is given in Fig. 1.
The formula for four features of each image
GLCM with 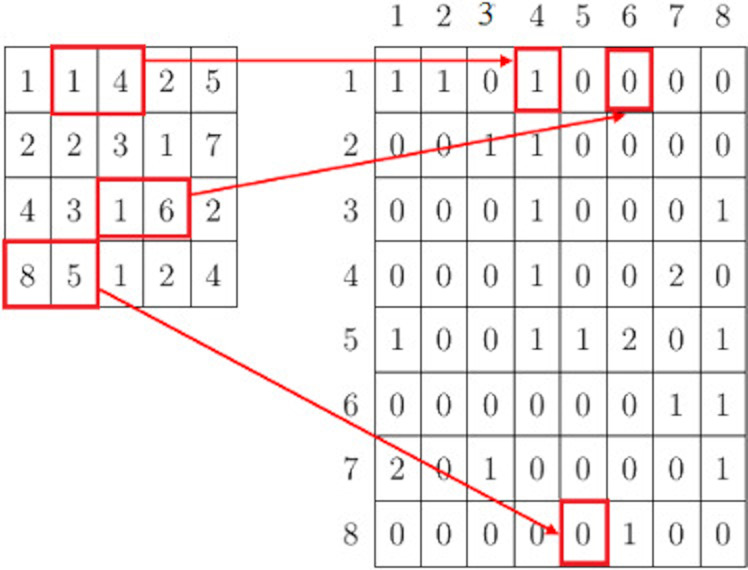
Based on the GLCM, Haralick and Shapiro (1992) proposed some equations used to calculate 14 features of texture. However, most of the recent studies only use three or four important features of these 14 features as representative features (Celebi & Alpkocak, 2000; Vovan et al., 2020). In this paper, the four main features used for studying are Entropy, Contrast, Homogeneity and Correlation. They are shown in Table 1.
Each image has four features with a distance
The proposed model has six steps as follows:
Step 1. Initializing the input data signed by the form as follows:
where
Step 2. Calculating the prior probability of each population based on Eq. (3).
where
In this step, we use the k-means algorithm to find the suitable number of elements for each population.
Step 3. Estimating the probability density function for each population to have
Step 4. Calculating the value of
Step 5. Using the rule to classify based on Eq. (4).
Step 6. Calculating the fuzzy relationships between each object and population as follows:
Example 1
In this section, we apply the proposed model to classify seven images described in research of Phanmtoan and Vovan (2021). The data have two populations as Flamingo and Zebra with four and three images, respectively. These image are shown in Fig. 2.
The images of two populations Flamingo and Horse.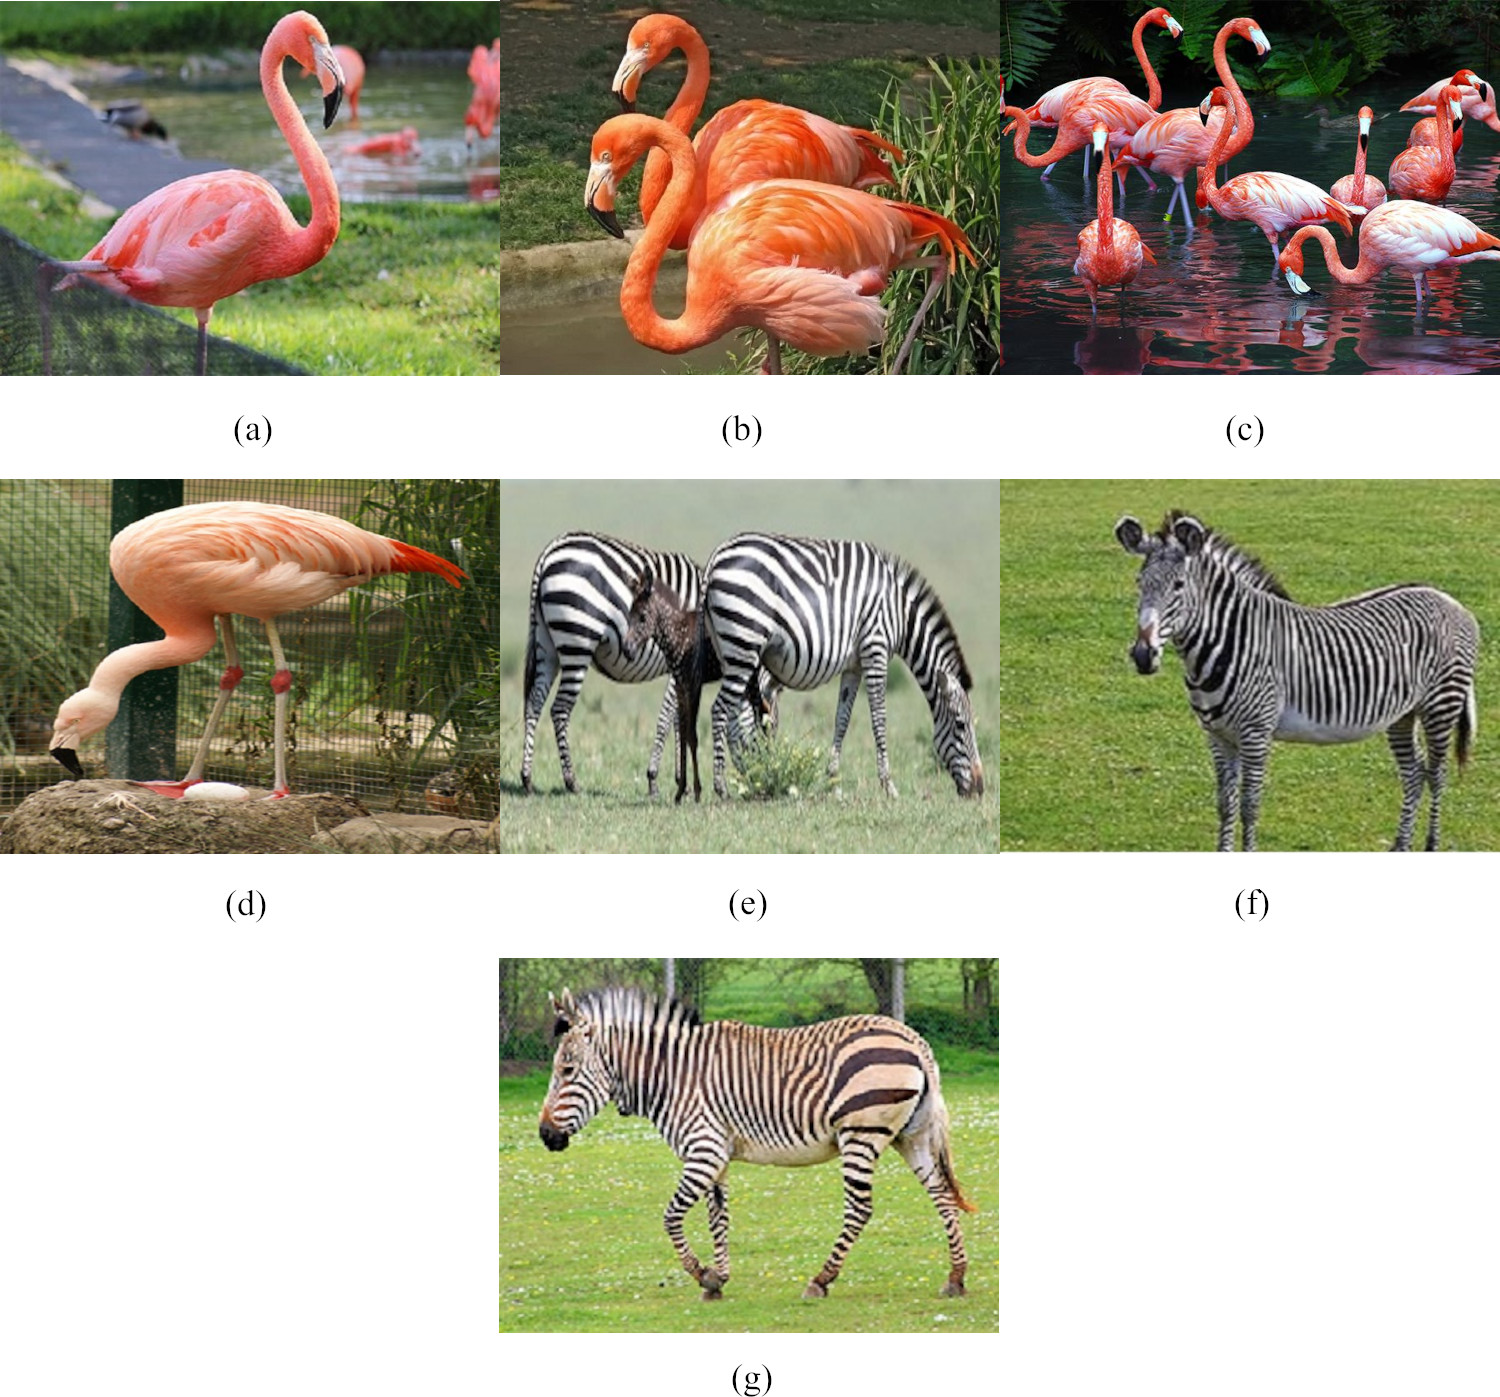
Step 1. Firstly, we need to extract the features of these images. Using 16 features of the GLCM, we have Fig. 3.
Descriptive data of 16 features seven images.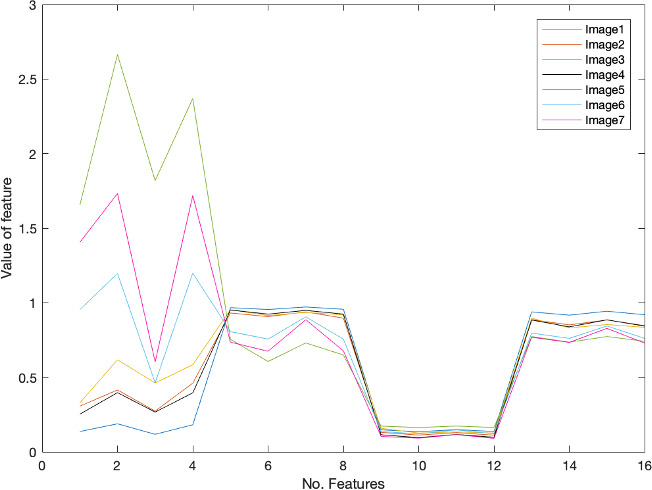
Step 2. Computing the prior probability for each group, we have
Step 3. Estimating the represenative pdfs of two populations, we obtained Fig. 4.
The estimated pdf of two populations: Flamingo (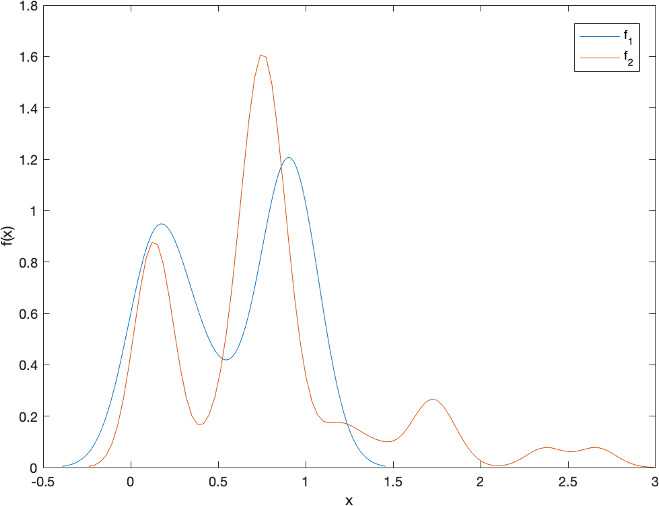
Step 4. Calculate the
Step 5. Classify the objects of two populations, we have
It means that all images have been properly classified.
Step 6. Calculate the fuzzy relationships of each image belongs to each population.
The fuzzy probability of 7 images to two populations.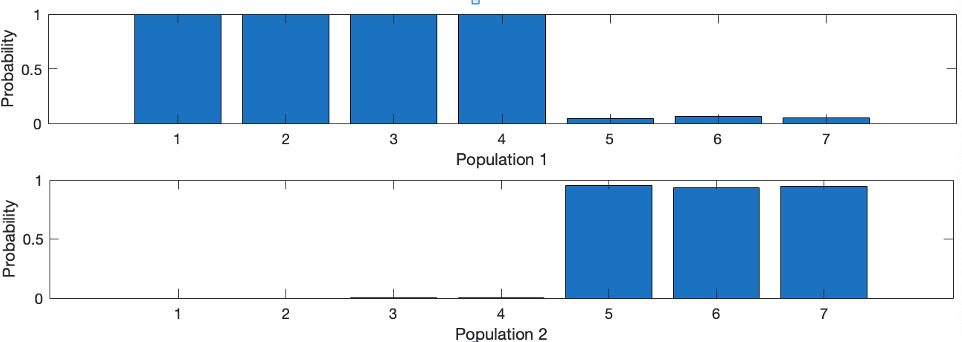
The fuzzy relationships are presented by
This experiment has been conducted on the database of the Normalized Brodatz Texture (NBT). It’s made up of 50 images of 4 populations. Some sample images are given in Fig. 6.
Some images samples of the NBT data set.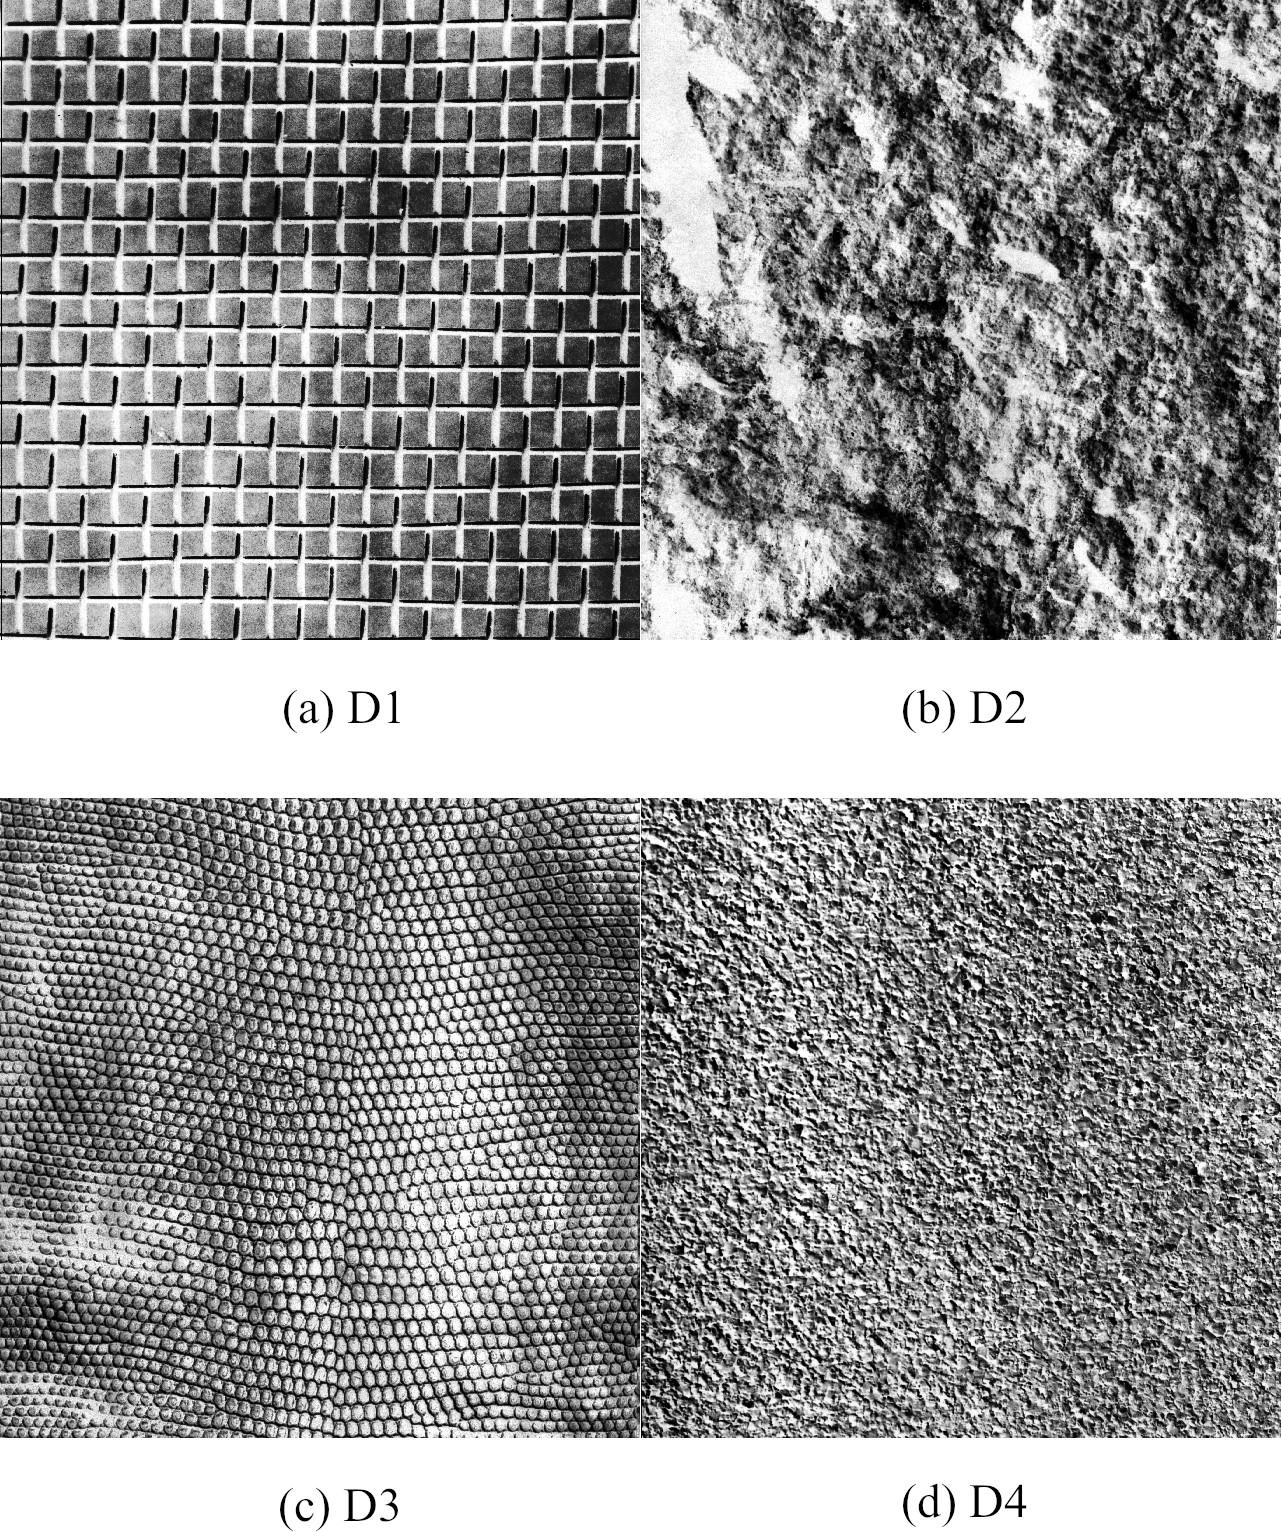
Extracting the 16 features of images according to the GLCM, and estimating the probability density function for 4 populations, we have 4 probability density functions shown in Fig. 7.
Performing the steps of the proposed model and compare it with others, we obtain Table 2.
The error rate of classifier methods and CPU time for NBT data
The estimated pdf of four populations for NBT data set.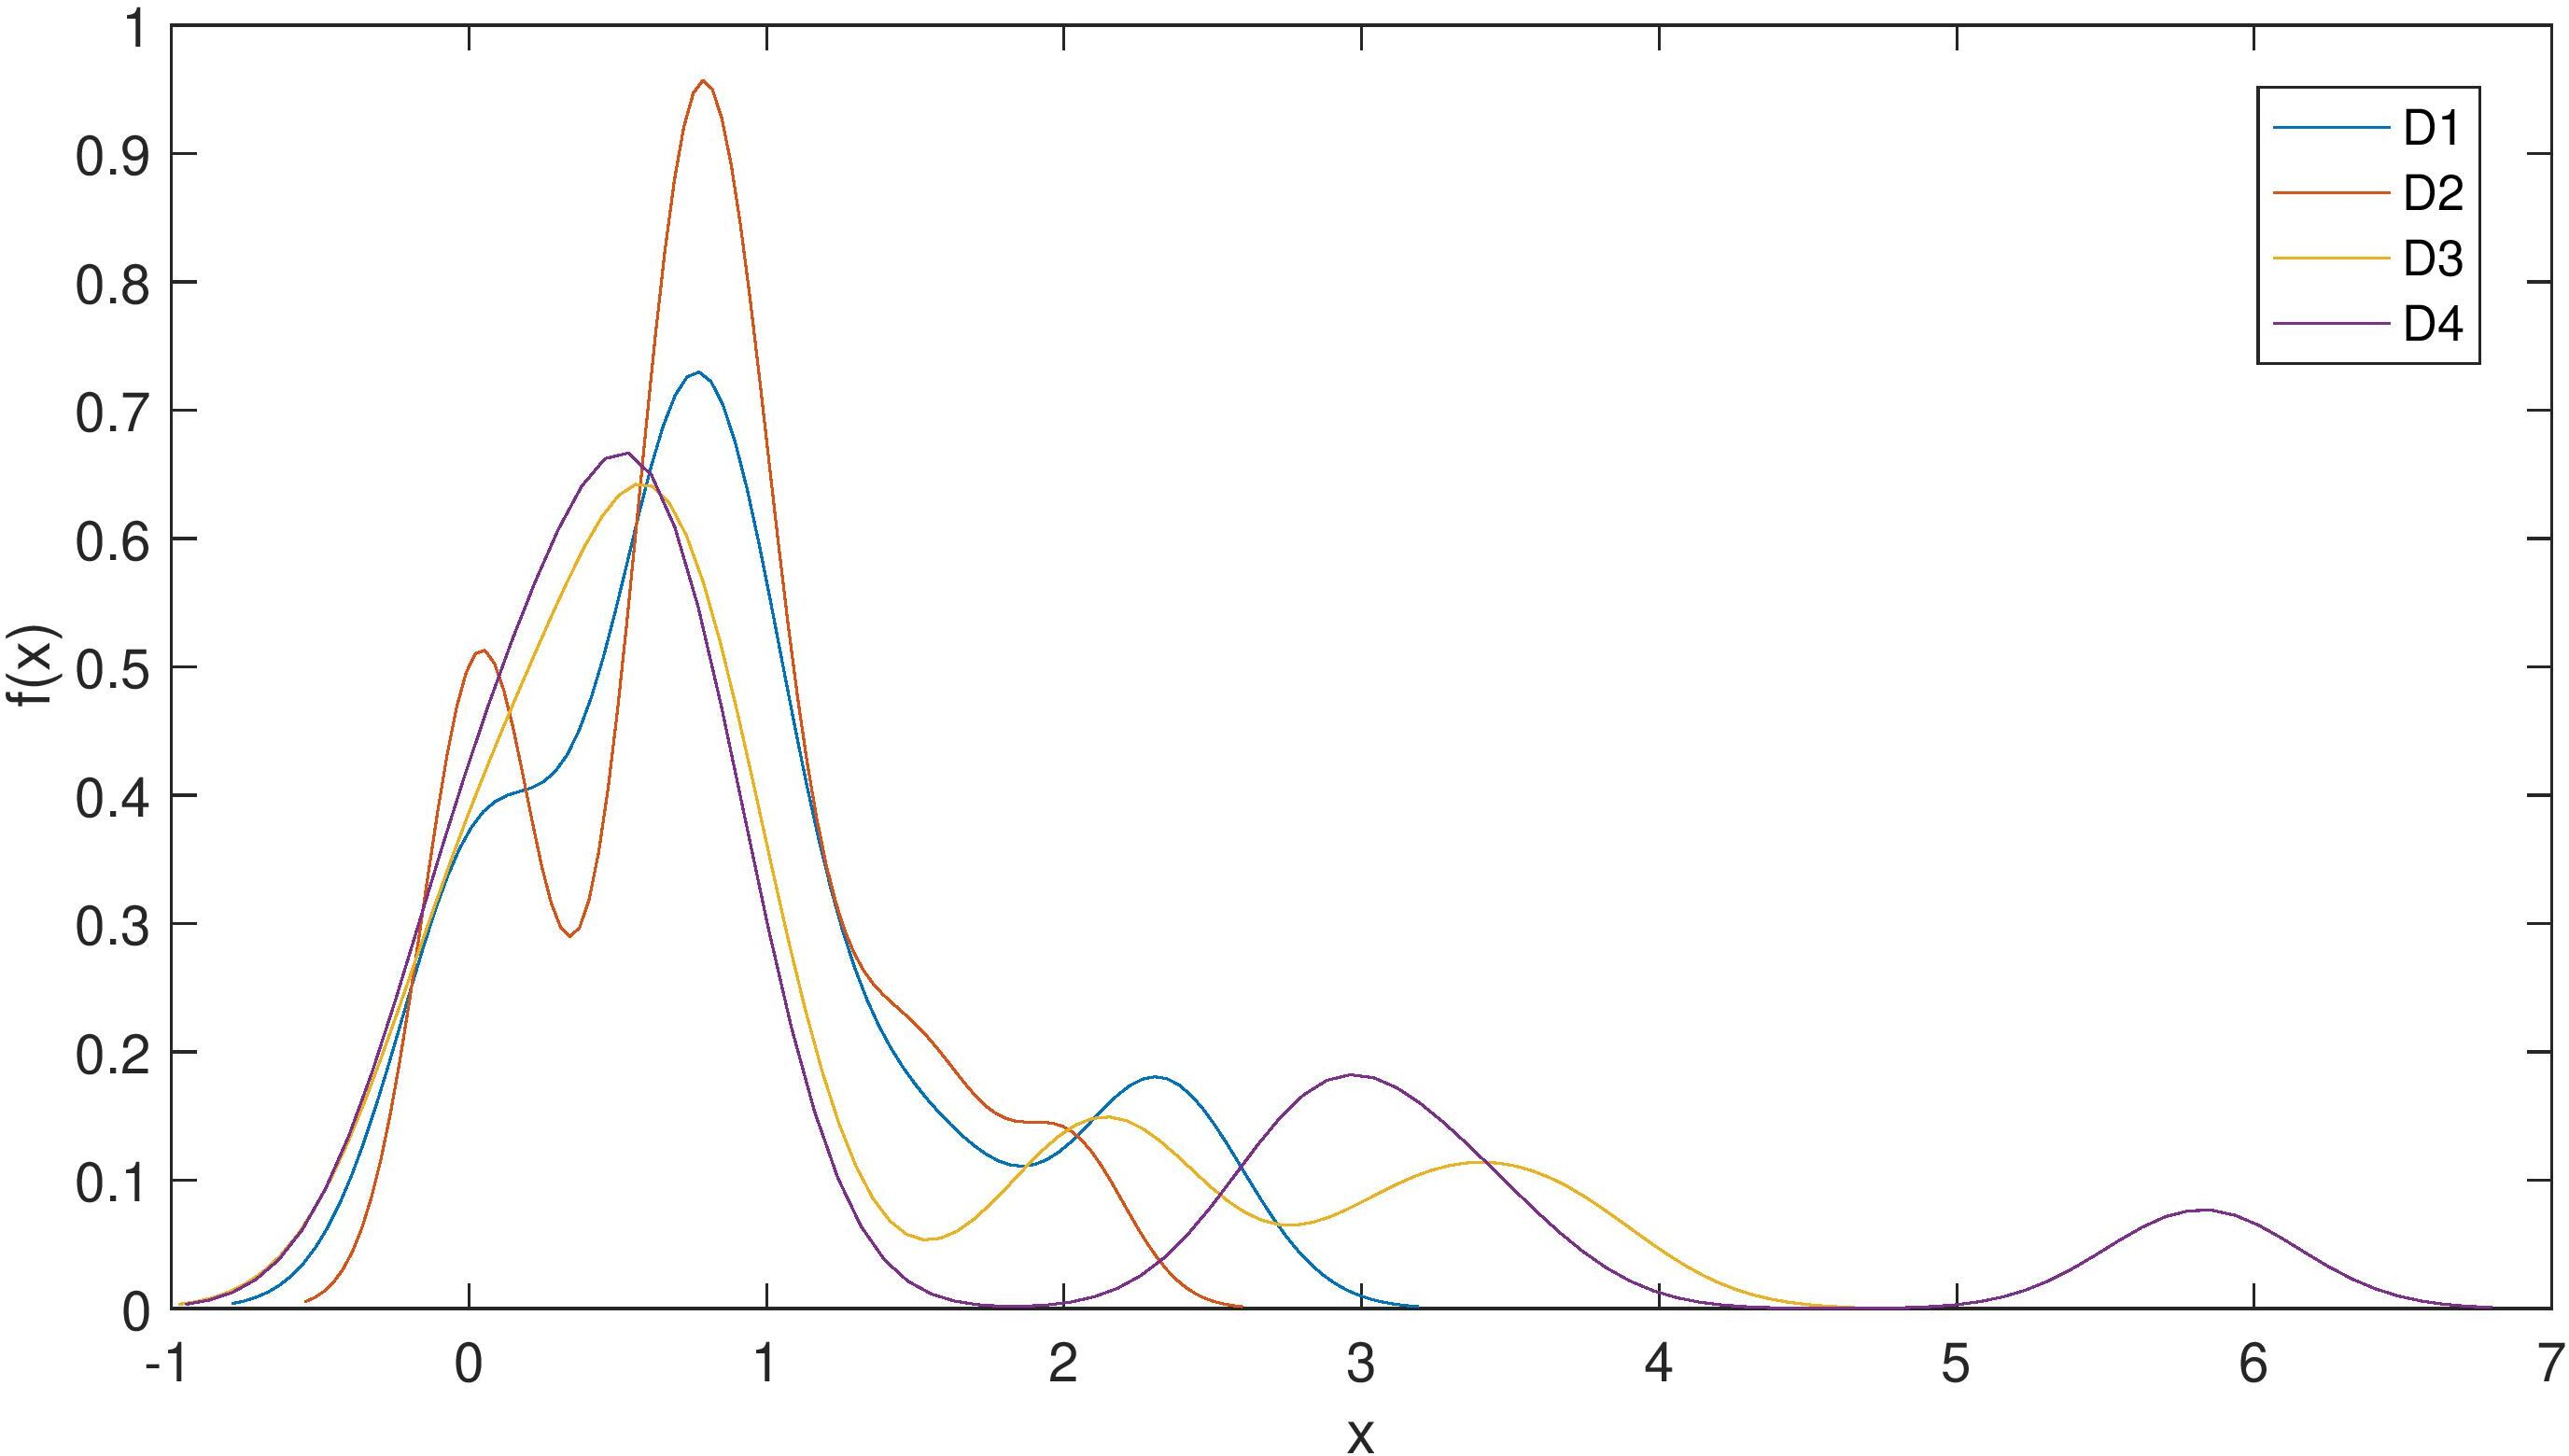
The estimated pdf for two populations fire and no forest fire.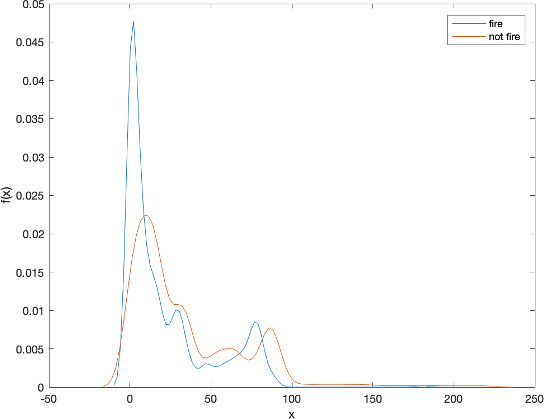
The error rate of classifier methods and CPU time for Algeria data
The probability to belong to two populations of 244 elements.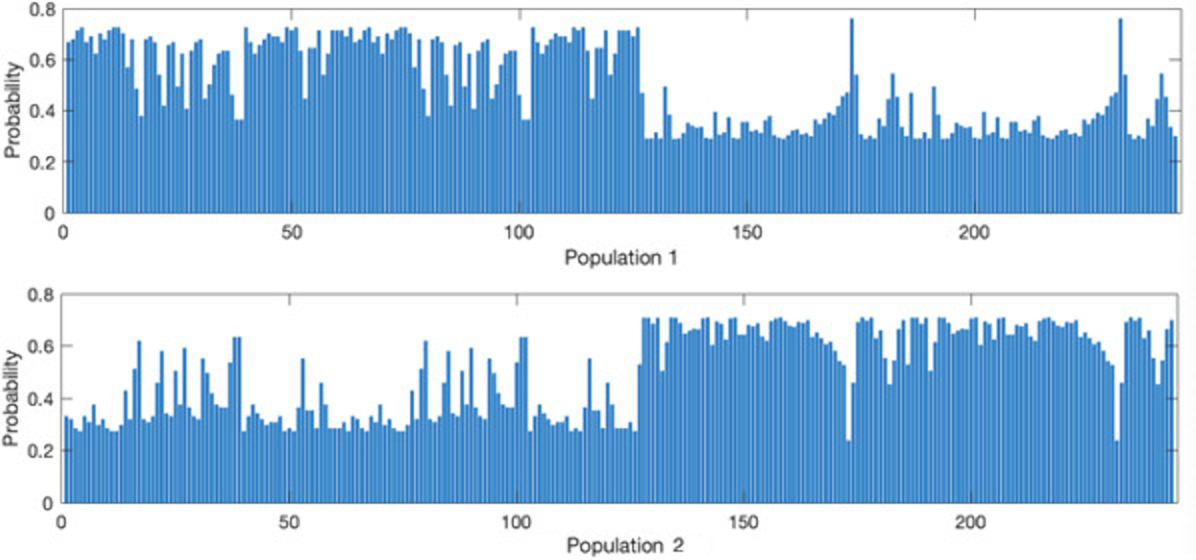
Table 2 shows the performance of different classifiers, including Naive Bayes, LDA, Fisher, Logistic regression and SVM. It’s obvious that the performance of the proposed classifier is better than that of others. It gives the value 0.021 of classification error, and 195 seconds of CPU time. These values are much smaller than those of other approaches.
This application classifies 244 instances that regroup data from two regions of Algeria. They are named as Bejaia region located in the northeast of Algeria and the Sidi Bel-abbes region located in the northwest of Algeria. This dataset is provided by source
The data have ten variables and are divided into two classes such as forest fire and no forest fire. They are described as follows: Date, Temp (Celsius degrees), RH, Ws, Rain (FWI), Fine Fuel Moisture Code (FFMC), Duff Moisture Code (DMC), Drought Code (DC), Initial Spread Index (ISI), Buildup Index (BUI), Fire Weather Index (FWI).
The prior probability: The probability density function of two groups are shown in Fig. 8.
The classifying result of methods are shown in Table 3.
From Table 3, we see that the error result of Fisher, LDA and Logistic regression methods are quite high with 0.05 for error. The lower error thresholds are Naive Bayes and Multi-SVM at 0.033 and 0.025, respectively. However, the result of the proposed method is the lowest with 0.011. At the same time, the calculation time of the proposed method is also lower than the considered methods.
In addition, we also obtain the fuzzy probability of belonging to each population by Fig. 9.
Fig. 9 shows that the fuzzy relationship of each observation to the two populations is quite high. These values represent the classification error of various models. For example, at the peak from 150
This study has positive contribution in the field of machine learning. The proposed method is a combination of many improvements from the k-means and Bayesian classifier methods. Another significant contribution of the proposed model is the application in classifying the image. Moreover, the illustrated and applied examples have shown the rationality and the outstanding advantages of the proposed model in comparison with the existing ones. This research also looks at all the computational issues in the actual application of the proposed model by the established Matlab procedure. It also shows the potential of this study in practical application. In the future, we will apply the proposed model to many practical issues in medicine and security.