
Abstract
Pandermite (Ca4B10O19 7H2O) can be defined as a type of calcium borate hydrate which generally founds in Turkey and USA. It has been identified by using X-ray diffraction (XRD), Fourier transform infrared (FT-IR) and Scanning electron microscope (SEM) during dehydration process. Thermal gravimetry and differential thermal gravimetry (TG/DTG) methods have been applied to investigate the thermal dehydration kinetic of pandermite. The results showed that it lost its crystal water via three-step process approximately between 280°C and 550°C temperatures. Activation energies (Ea . ) were found as 98.83, 136.86 and 391.24 kJ using Ozawa–Flynn–Wall (OFW) model; 89.82, 133.16 and 399.01 kJ using Kissinger–Akahira–Sunose (KAS) model; and 140.78, 131.01 and 486.22 kJ using Kissinger non-isothermal kinetic model for steps 1, 2 and 3, respectively. At the end of the dehydration process, Pandermite lost its water content and it decomposed to CaB2O4 (powder diffraction file number: 00-009-0247) and B2O3 (powder diffraction file number: 01-072-0626) occurred.
Keywords
Introduction
Boron is found as combinations of metal elements in nature. There are over 200 minerals worldwide that contain boron element. Turkey has 72% of the world’s boron reserves. Because of their significant thermal, mechanical and chemical features- boron minerals have been employed in a wide range of uses for different areas of applications such as glass, ceramic, cement, health, metallurgy, flame retardants, detergent, agriculture, catalysts, and nuclear energy fuels. They can be classified according to their metal complexes such as sodium borates, calcium borates and magnesium borates [1, 2]. Although the majority of borate minerals have identified, there are still other fine-grained, microcrystalline species whose structures and properties remain unknown.
Pandermite (Ca4B10O19·7H2O), which has a layered structure, belongs to the pentaborate group. It has a monoclinic crystal lattice structure with a density of 2.42 g/cm3 and hardness of 3 – 3.5 Mohr. Its crystals are white and fine grained. Chemical composition of pandermite is as follows; 49.87% of B2O3, 32.04% of CaO and 18.07% of H2O. It was originally described in 1877; however chemical and optical studies showed that pandermite and priceite had the same structure and pandermite was identical to priceite [3, 4]. Pandermite can be associated with colemanite (Ca2B6O11·5H2O), howlite (Ca2B5SiO9(OH)5) and gypsum (CaSO4·2H2O) under surface or near surface conditions. The reserves of pandermite are found as nodules in shale in Death Valley, California, USA; and also as large masses underlying gypsum and clay beds in the northwestern part of Turkey [5, 6]. Crystallographic structure of Pandermite was examined by Larsen [7] and Walwork et al., [4]. Gur et al., studied the dissolution kinetics and mechanism of Pandermite in acetic acid solutions [8]. Frost et al., examined the characteristic vibrations of Pandermite using Raman and FT-IR spectroscopy techniques [5].
Thermal decomposition reaction of boron minerals generally starts with the removal of crystal water and continues with the removal of hydroxyl ions as water molecules from the structure. These stages of decomposition are defined as dehydration and dehydroxylation, respectively. Amorphization or reconstruction of dehydrated structure was observed with increasing temperature [9, 10]. There are some studies on the thermal dehydration behavior and kinetics of boron mineral and compounds [11–22]. Borax (Na2B4O7·10H2O) lost its crystal water via a two-step process between 30 and 600°C and activation energy was found as 61 kJ and 11 kJ for the first and second step [11]. Thermal dehydration behavior of tincalconite (Na2B4O7·5H2O) was explained with the first order kinetic model by a two-step process [12]. Koga and Utsuoka indicated that dehydration process of lithium metaborate dihydrate (LiBO2·2H2O) ended at 450°C and phase transformation occurred with the increasing temperature to 900°C [13]. Erdogan et al., studied the thermal dehydration behavior of ulexite (NaCaB5H16O17), tunellite (SrB6H8O14) and howlite (Ca2B5SiH5O14) [14]. The thermal dehydration process of synthesized sodium metaborate tetrahydrate (NaB(OH)4·2H2O) was explained with Coats–Redfern method [15]. Thermal decomposition of inderite (Mg2B6O11·15H2O) proceeds in the 70–767°C temperature range with dehydration and dehydroxylation steps [16]. Yilmaz et al., studied thermal dehydration kinetic parameters of tunellite (SrB6H8O14) in the range of 36–718°C and dehydration mechanism [17]. Derun et al., investigated the dehydration mechanisms of mcallisterite (Mg2(B6O7(OH)6)2 9(H2O)) [18] and admontite (MgO(B2O3)3·7(H2O)) [19]. Thermal kinetic parameters of zinc borate hydrate (Zn3B6O12·3.5H2O) were determined by Kipcak et al. and the activation energies were found as 250 kJ for the first step and 520 kJ for the second step [20]. According to the thermal behavior of santite (KB5O8·4H2O), dehydration process occurred via a two-step process and total mass loss was determined as 25% [21, 22].
The knowledge of thermal dehydration behavior of boron minerals have become very important for the production of boron compounds and development of various applications. For example, the boron minerals and compounds with high thermal resistance such as colemanite and zinc borate hydrates can be employed in the production of fire retardant materials [19]. This study aims to determine the detailed thermal behavior of pandermite. The non-isothermal kinetic parameters of the thermal dehydration of Pandermite were calculated by using the following methods: Ozawa–Flynn–Wall (OFW); Kissinger–Akahira–Sunose (KAS); Kissinger non isothermal analysis. The mineral were conducted by X-ray diffraction (XRD), Fourier transform infrared (FT-IR) spectroscopy and scanning electron microscope (SEM).
Materials and methods
Mineral characterization and thermal behavior
Pandermite was provided from the region of Bigadic, Balikesir in Turkey. The mineral was cleaned from its visible impurities; then ground and sieved to achieve a uniform size (particle size < 75 μm). Identification of the mineral was carried out by PANalytical XPert Pro XRD (45 kV, 40 mA (λ= 1.53 cm-1)) using Cu-Kα radiation in the 2θ range of 7–90°. The characteristic band values were detected by Perkin Elmer FT-IR supplied with a universal attenuation total reflectance (ATR) sampling accessory accommodated with a diamond/ZnSe crystal. The measurement range was 1800 cm-1–650 cm-1. The surface morphology of the mineral were investigated by using a CamScan Apollo 300 field-emission SEM at 15 kV. The detector used was a back scattering electron (BEI) and the magnification was set to 5,000.
Thermal dehydration behavior of Pandermite was studied between the temperature ranges of 50–650°C with a Perkin Elmer Diamond TG/DTA. Three different heating rates (10°C/min, 15°C/min, and 20°C/min) were applied in an inert (Nitrogen) atmosphere. After the characterization and thermal dehydration had been performed, mineral was placed in a Protherm MOS 180/4 high-temperature furnace in nitrogen flowing (5 ml/min) atmosphere in order to investigate the thermal conversion. Calcined sample was further analyzed by XRD and FT-IR.
Thermal dehydration kinetics
Kinetic parameters of activation energy (Ea) and exponential factor (ko) were calculated by applying Ozawa–Flynn–Wall (OFW), Kissinger–Akahira–Sunose (KAS) and Kissinger non-isothermal kinetic methods.
In OFW non-isothermal kinetic method, thedata from the TG curve in the dehydration range for each heating rate was used to determine the kinetic parameters. Kinetic parameters were calculated using the plot of conversion (α) as a temperature function (T). The OFW kinetic method equations are given in Equation (1):
In KAS kinetic method, kinetic parameters were calculated by using the plot of conversion (α) as the temperature function (T) of TG curves. The data are plotted on the graph as “–ln(β/T2) and 1/T”. The slope of line was -Ea/R. The equation for KAS kinetic method was given in Equation (2):
In Kissinger kinetic method (Equation (3)), kinetic parameters were calculated by using the peak temperatures of DTG curves. Ea is obtained from the slope of the –ln(β/Tm2) vs 1/Tm plot.
Characterization of Pandermite
According to XRD analysis, the mineral used in the study was found to be Ca4B10O19 7H2O with powder diffraction file number of “00-009-0147”. XRD pattern of pandermite is presented in Fig. 1. The characteristic peaks (dspacing) of pandermite were observed at the 2θ positions of 8.105° (10.90Å), 16.221° (5.46Å), 24.503° (3.63Å), 25.502° (3.49Å), 32.309° (2.72Å) and 41.385° (2.18Å).

XRD pattern of Pandermite.
FT-IR spectrum of pandermite is given in Fig. 2. The band values in the range of 3547–1657 cm-1 indicate that the mineral has crystal water content. The characteristic peaks at 1421 and 1347 cm-1 can be explained by an asymmetric stretching of three coordinate boron to oxygen bands [νas(B (3) –O)]. The bands at 1310 and 1247 cm-1 are assigned to the bending mode of boron-oxygen-hydrogen [δ(B–O–H)]. The peaks between 1060 cm-1 and 1010 cm-1 are the asymmetric stretching of four coordinate boron to oxygen bands [νas(B (4) –O)]. The bands in the region of 883 cm-1 are symmetric stretching of three coordinate boron to oxygen bands [νs(B (3) –O)]. The band at 782 cm-1 is related to the symmetric stretching of four coordinate boron to oxygen bands [νs(B (4) –O)]. The frequency at 712 cm-1 belongs to the bending of three coordinate boron [δ(B-O-H)]. The obtained FT-IR bands were in accordance with the results obtained by Jun et al., [23].
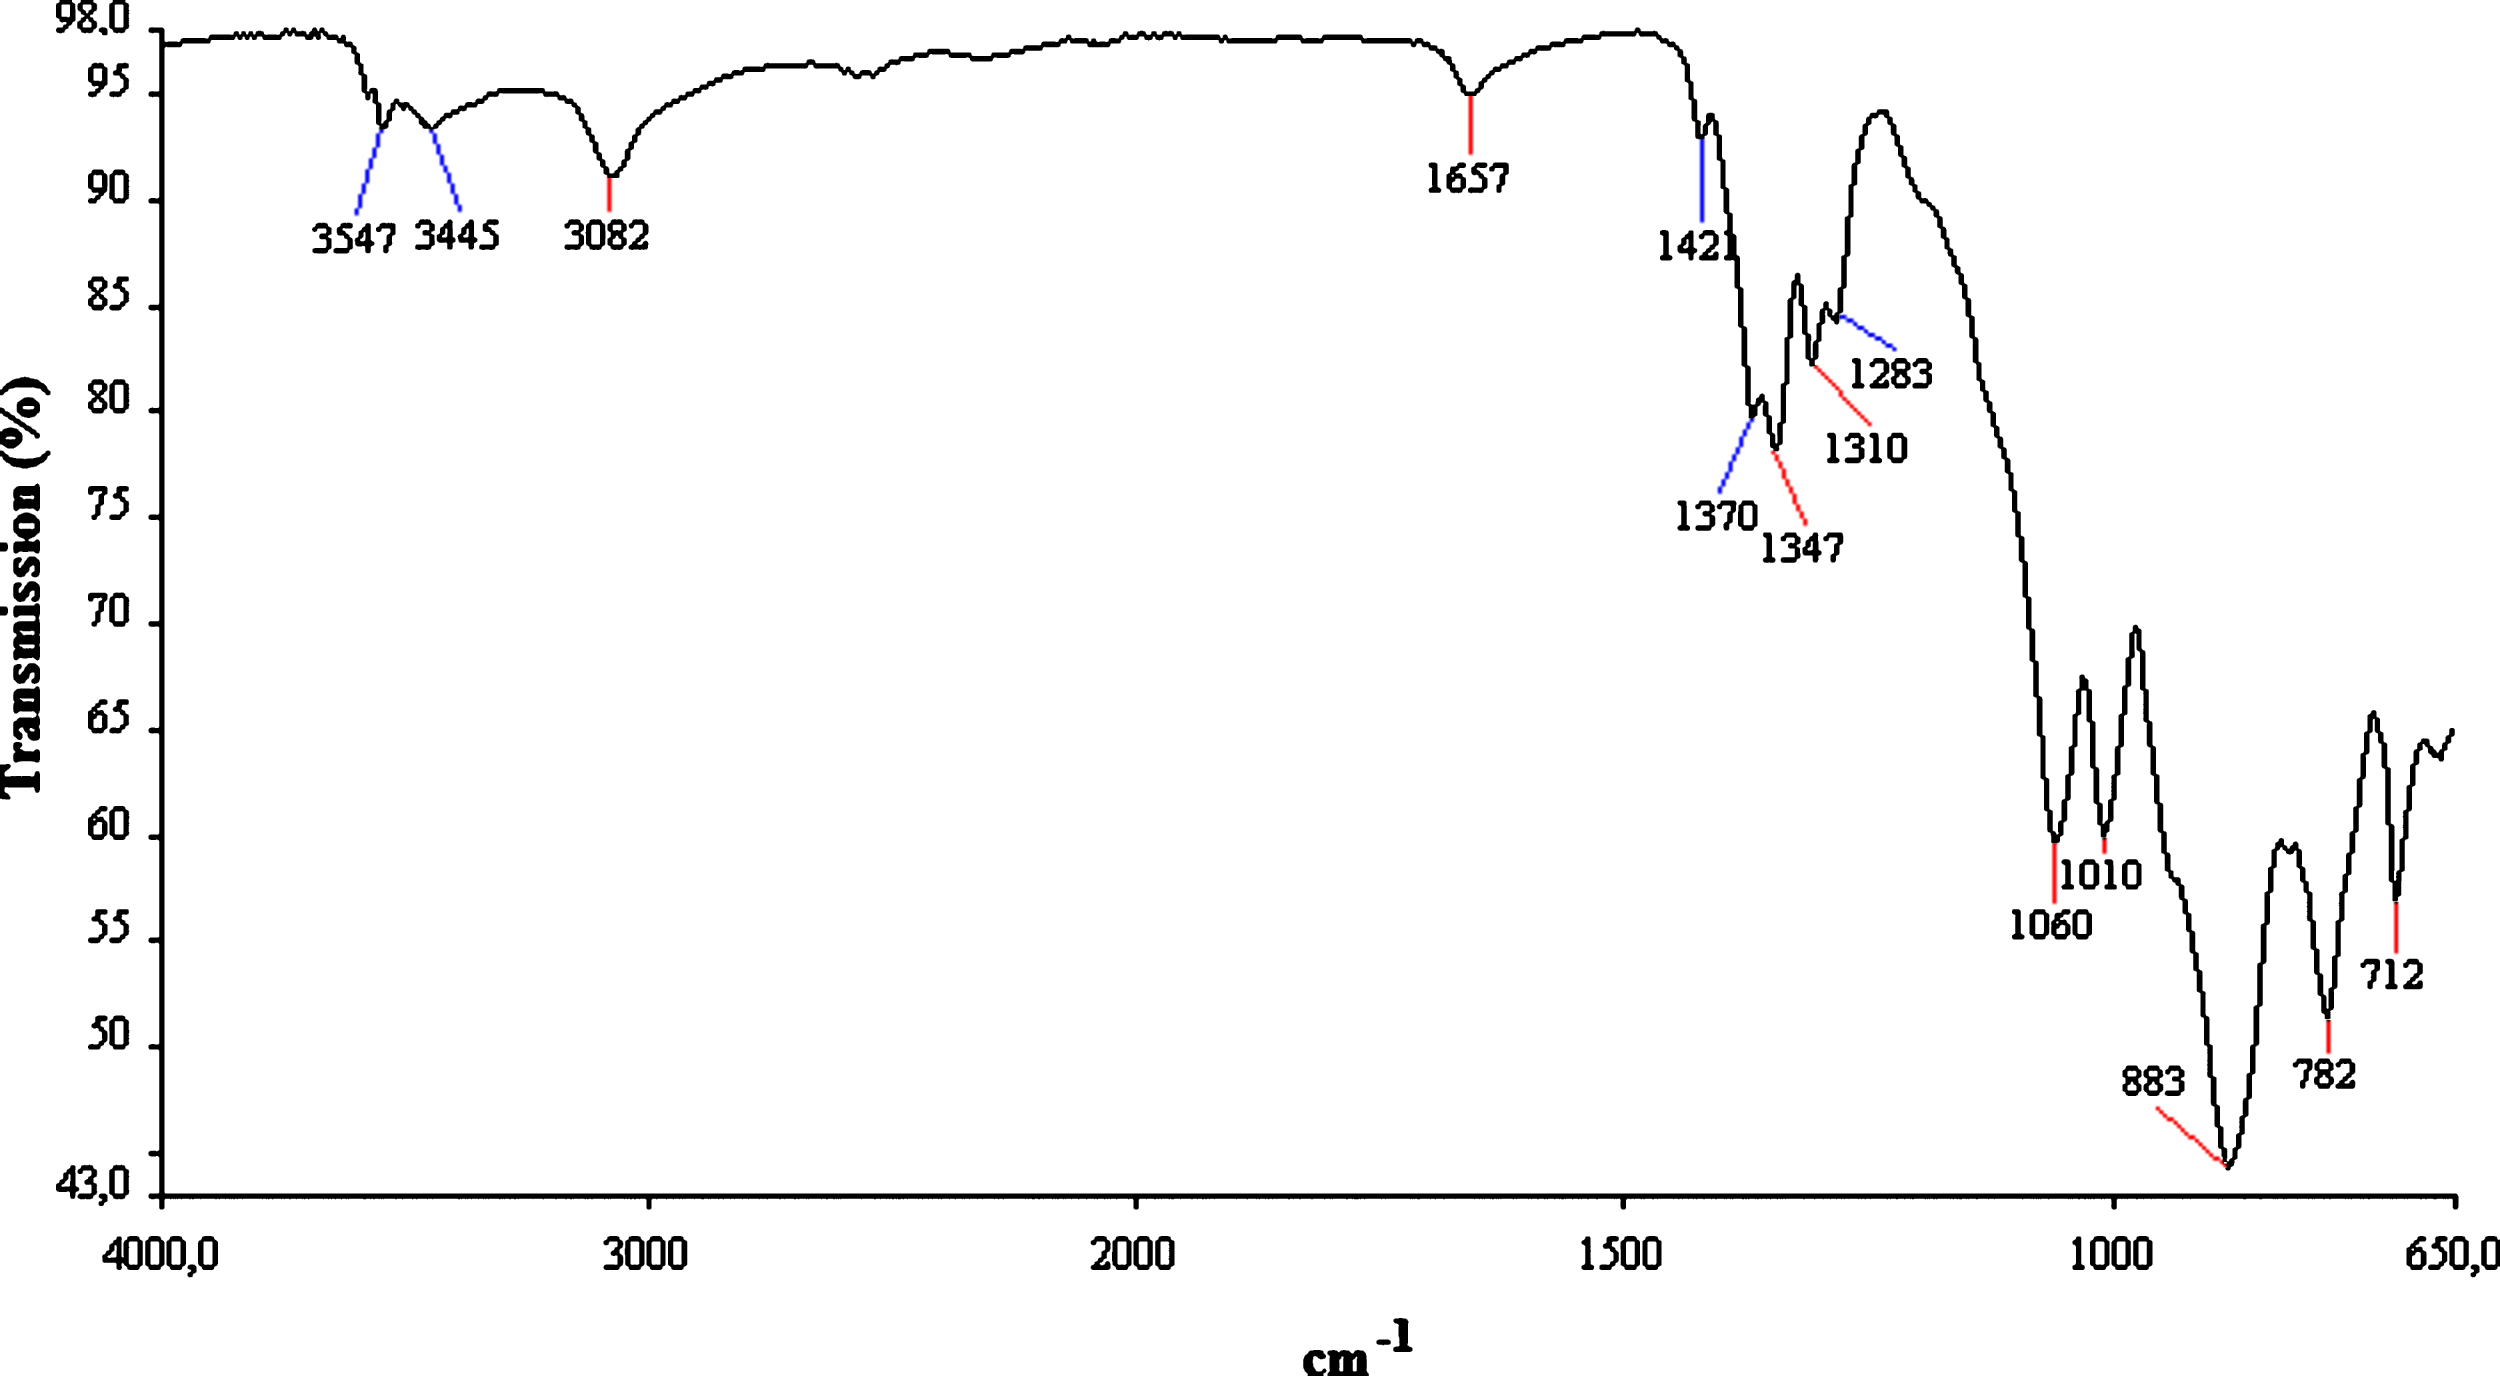
FT-IR spectrum of Pandermite.
The surface morphology of the mineral is presented in Fig. 3. The surface occurs from the particles in the form of angular layers. The size of layers are in the range of 5–10μm, and some particles are seen in sub-micron scale on the layers.
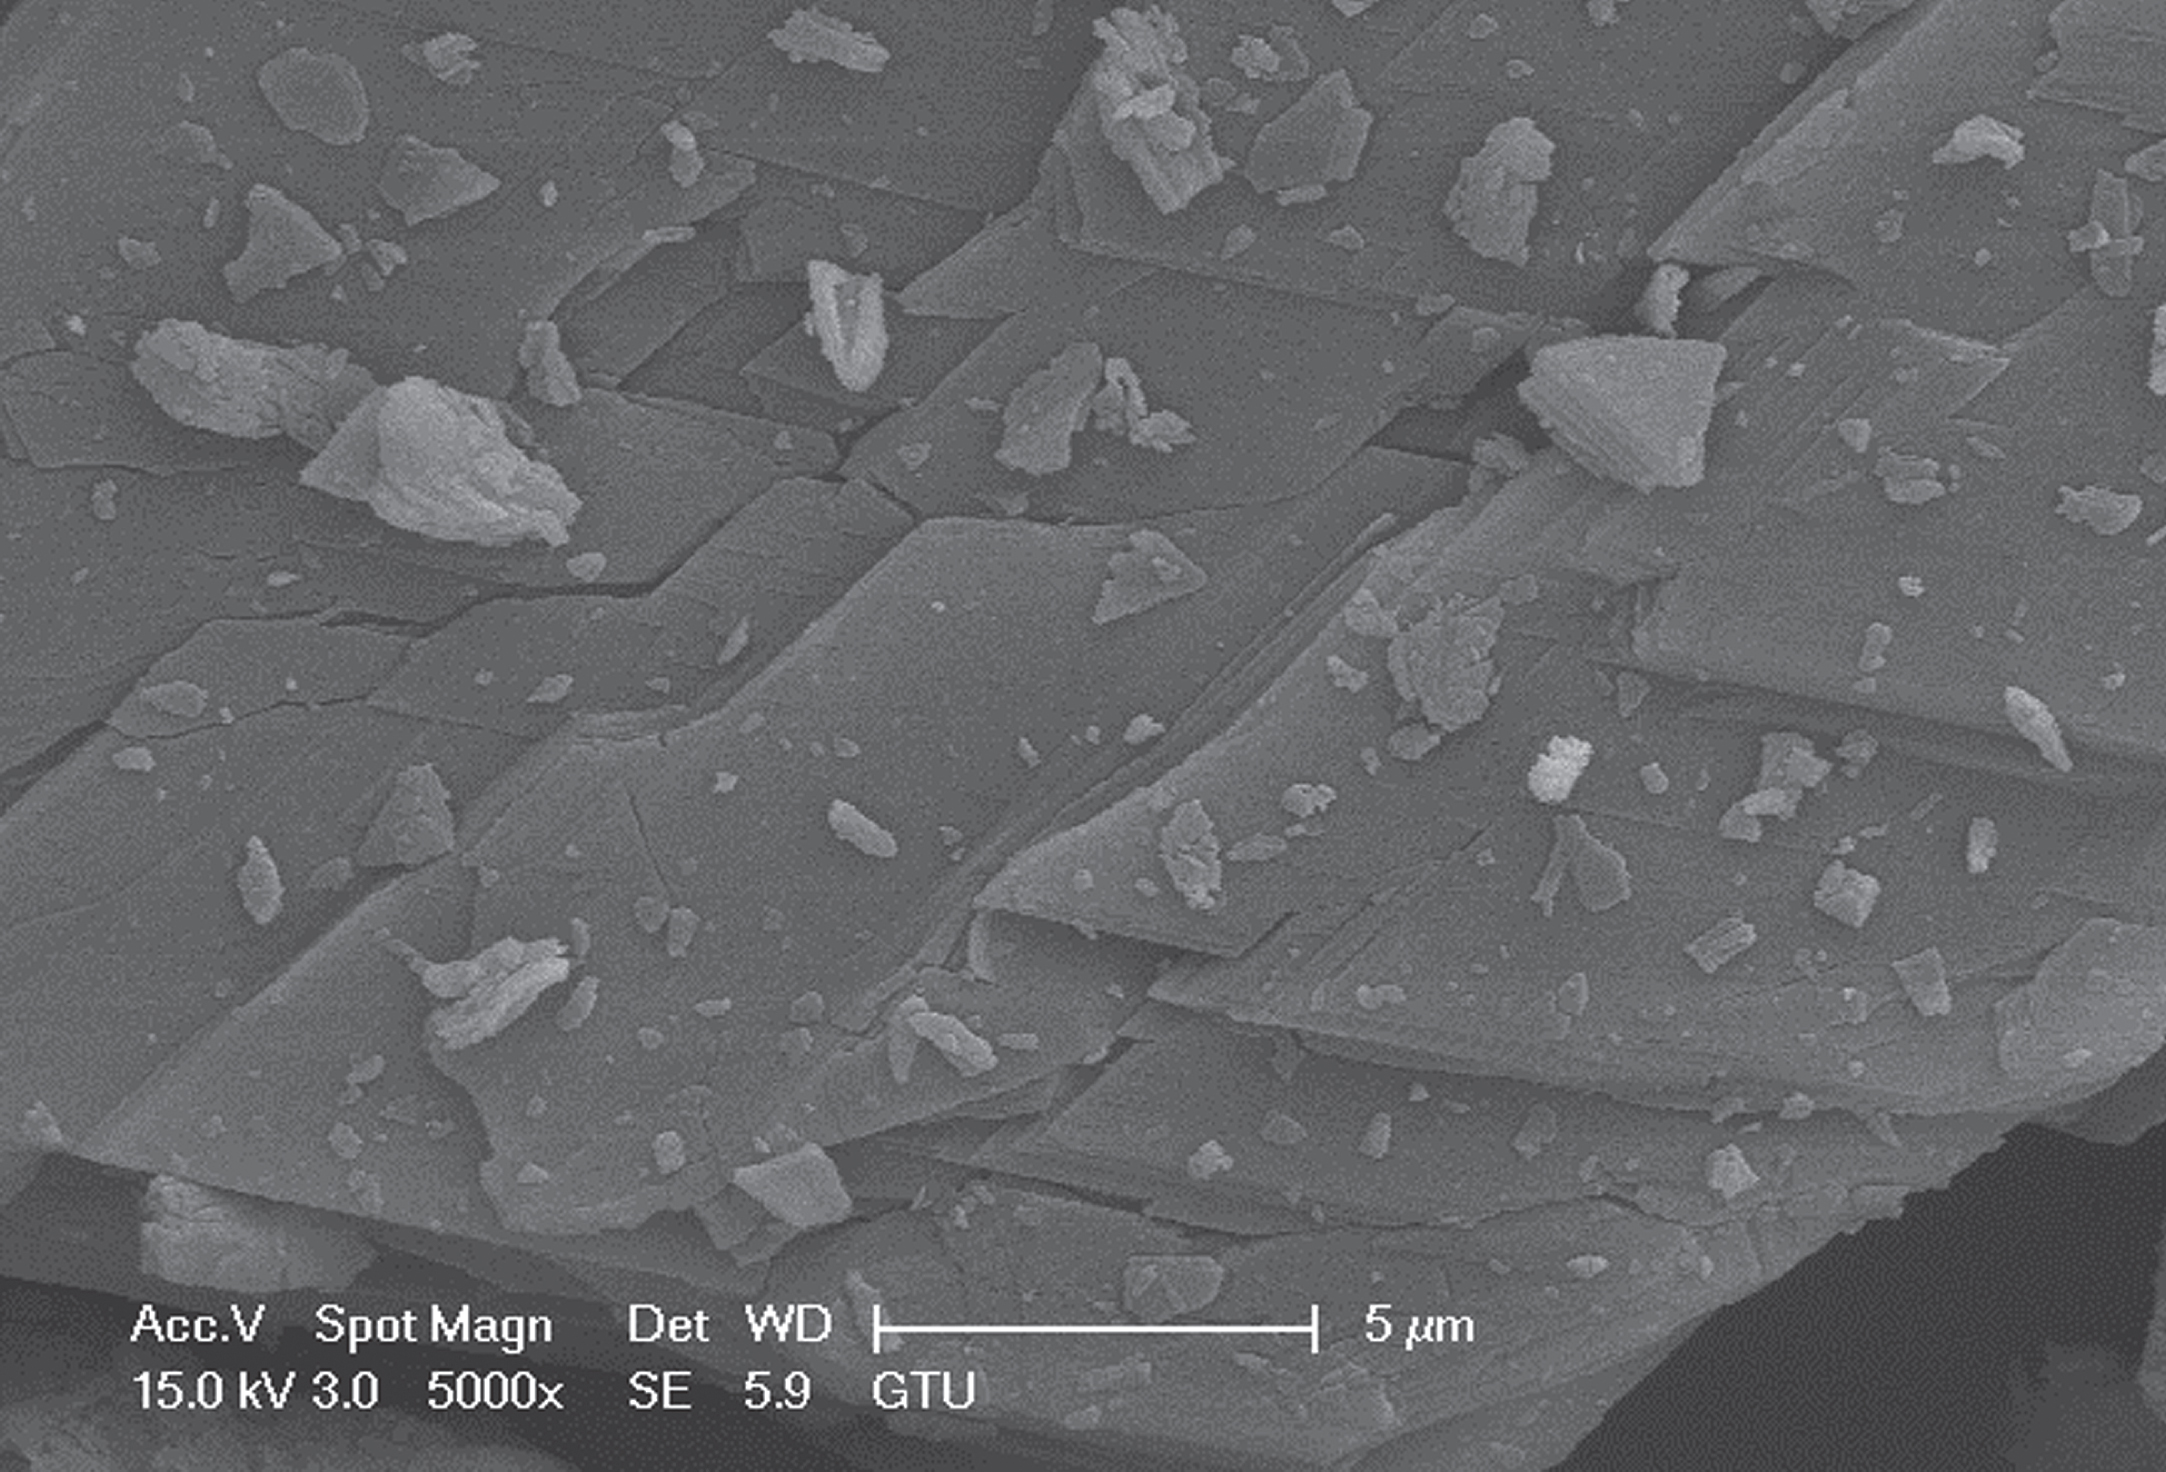
SEM image of Pandermite.
The dehydration process was observed in three stages within the temperature range of 200 and 650°C. The mass loss was negligible at the temperatures under the 200°C. Thermal analyses results are presented in Table 1 and Fig. 4. The probable reactions for the thermal dehydration process are given in Equation (4), (5) and (6). Removal of crystal water could occur in the first stage of the process. It was seen in the range of 278.40°C –309.20°C and its DTG peak was observed at 309.20°C. In this stage, weight loss was 2.83%, which is equal to 1.0 moles of water. The second stage, which has a DTG peak at 363.87°C, was obtained between 339.23 and 398.52°C. The 2.43% weight loss in the second step, was similar to the first step of dehydration and this value is approximately equal to 1.0 moles of water. The rebuilding of the structure may occur with the release of 2 moles of water. In last step dehydration and dehydroxilation processes occurred together. This stage began at 423.93°C and ended at 522.50°C. The third DTG peak was seen at 466.05°C. Higher amount of water removal was seen at the third step with a weight loss of 12.93% and this is equal to 5.0 moles of water. Total average weight loss was found as 18.15%.
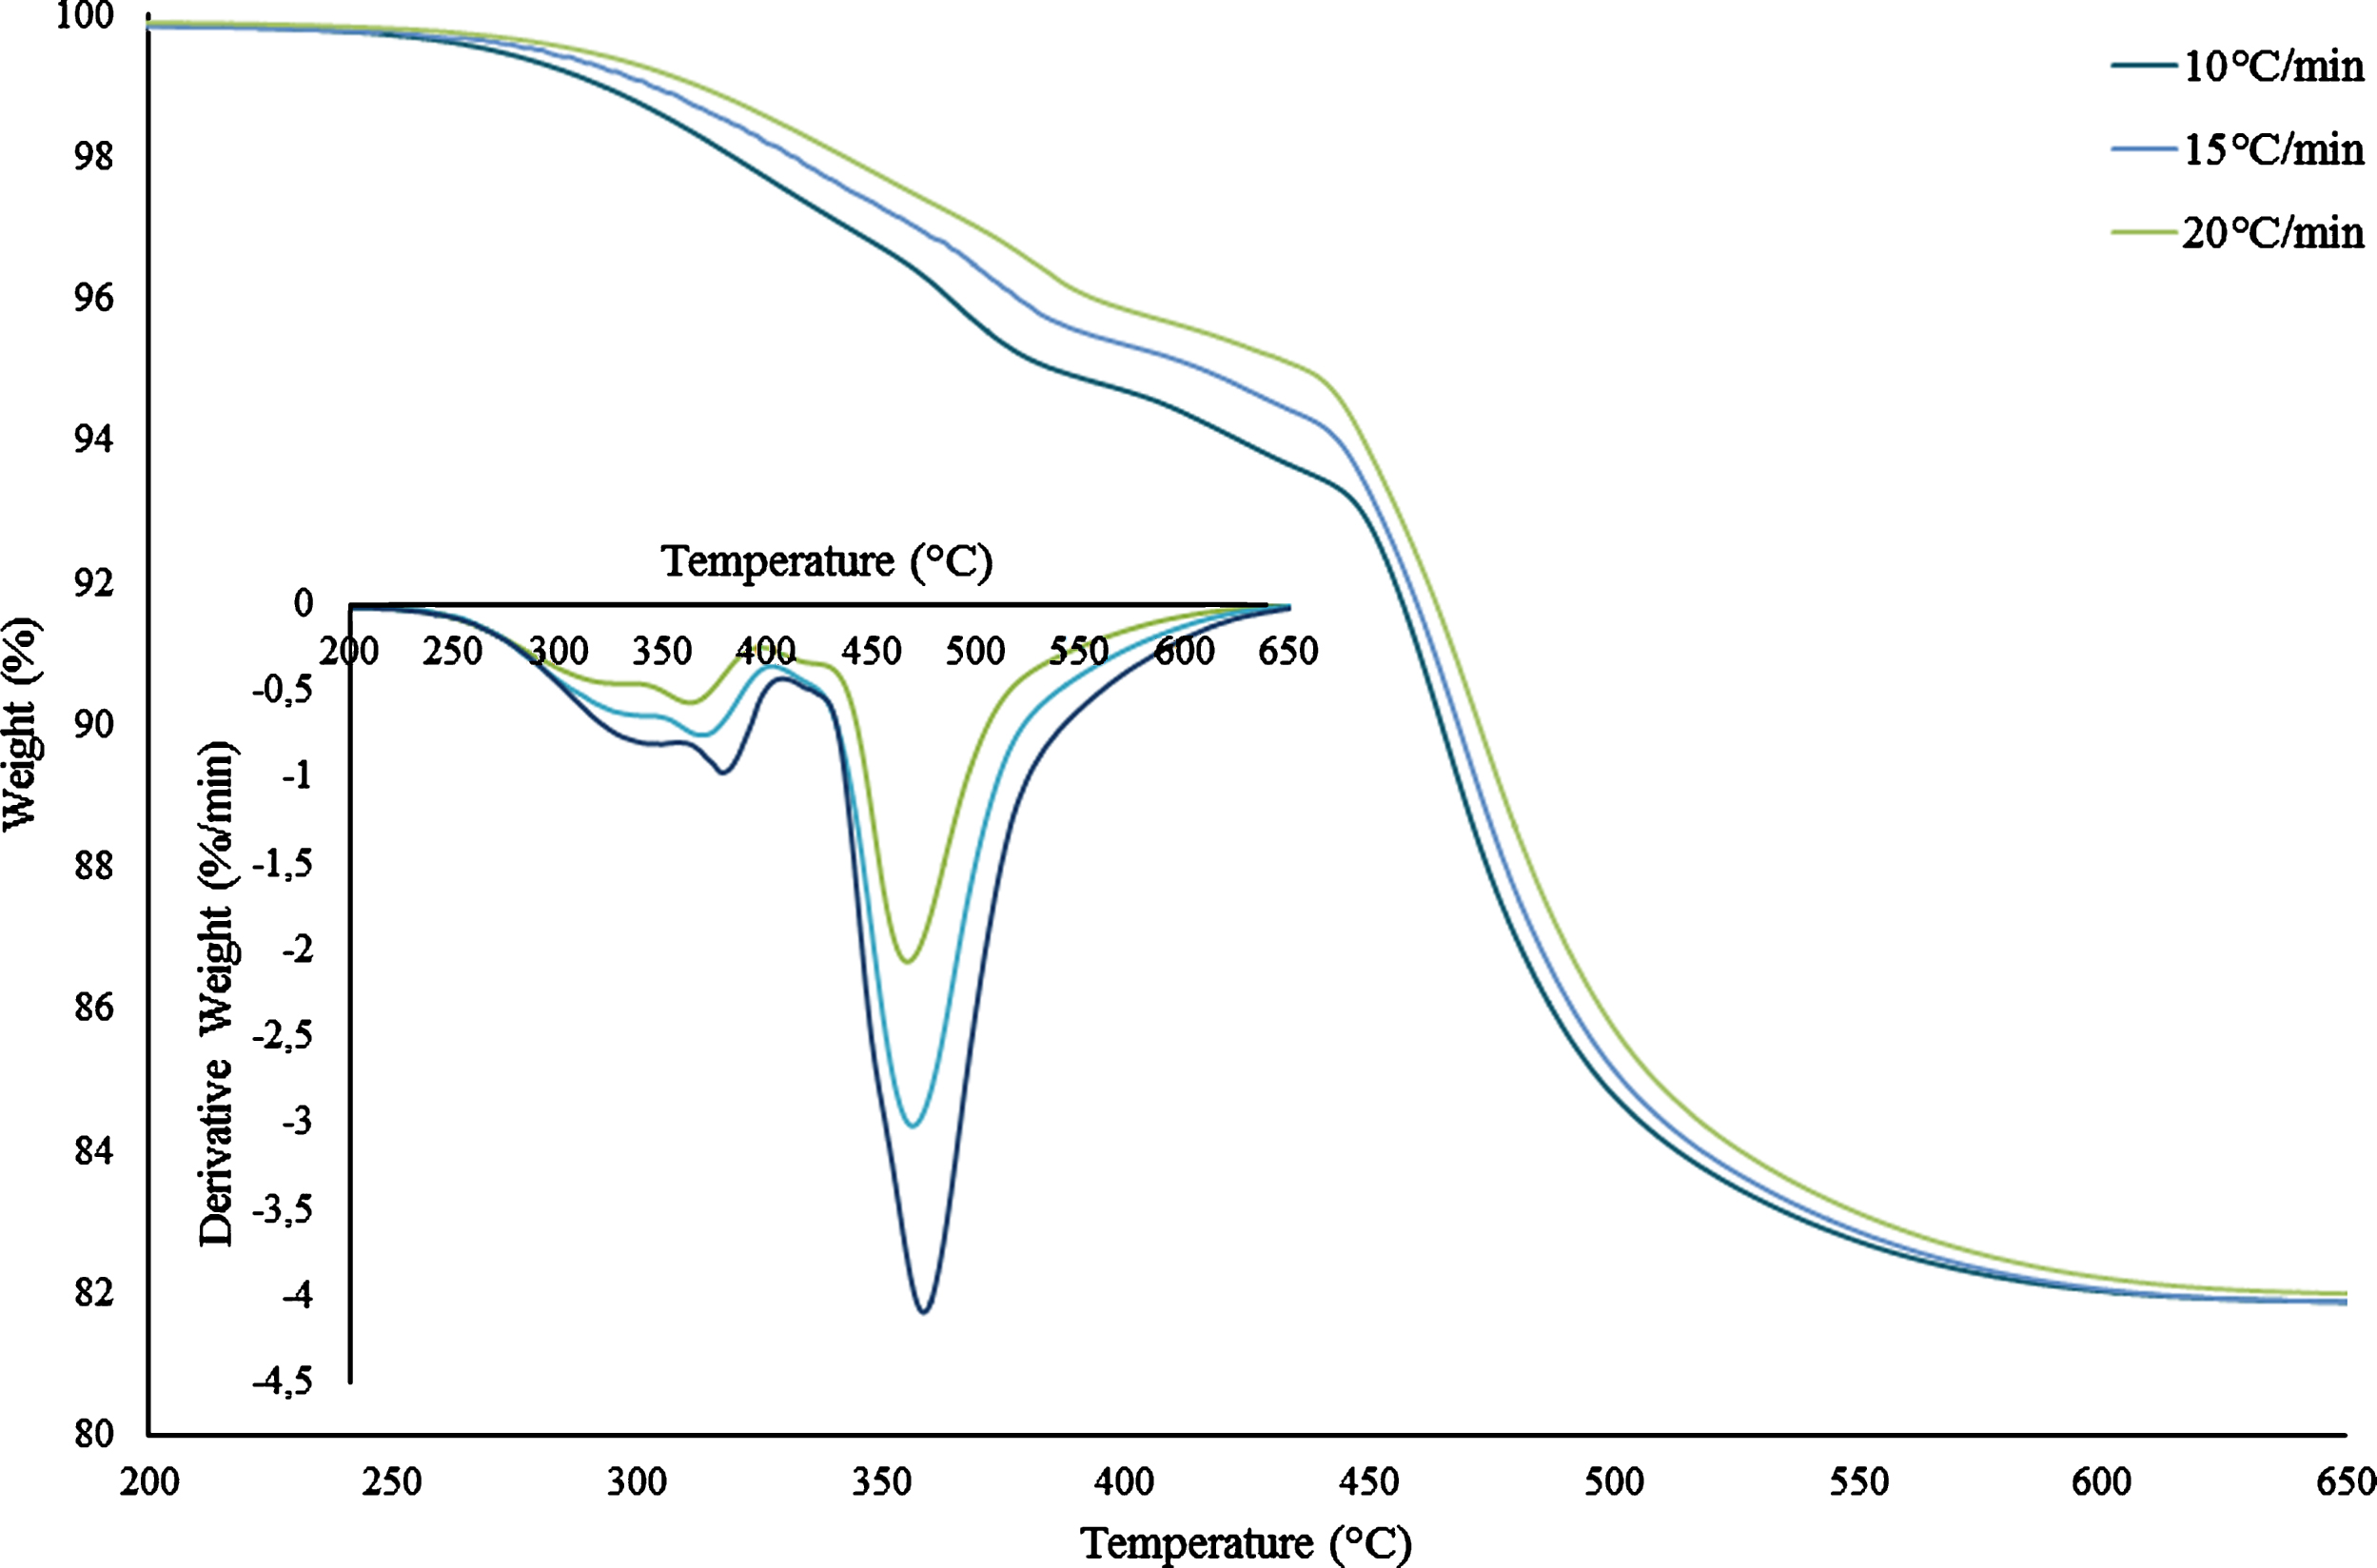
TG/DTG analyses results of Pandermite.
Thermal analyses results of Pandermite
The crystal water content of pandermite was found to be compatible with the previous studies. According to the studies of Stoch and Waclawska, thermal behavior of pandermite can be explained with the splitting off of the H2O groups, splitting off of the hydroxyl groups from borate anion, and formation of free water molecules. The rearrangement of the structure could be seen with the increasing temperature [9, 10].
OFW, KAS and Kissinger non-isothermal kinetic methods have been applied for the calculation of the activation energy (Ea) and the exponential factor (ko). Ea values were calculated for the conversion values between 0.1 and 0.9 in the methods of OFW and KAS. The calculated kinetic parameters for the OFW and KAS methods can be seen in Table 2.
Calculated parameters for the OFW and KAS kinetic methods
In the OFW kinetic method, correlation factors (R2) were found between 0.9292 and 0.9962. Average of Ea values in the first, second and third steps of dehydration processes were determined as 98.83, 136.86 and 391.24 kJ, respectively. The ko values were calculated between the –4.25×10⁷ and –3.24×10⁵, between the –1.01×10¹⁰ ––1.92×10⁷ and between the –3.02×1057 ––8.86×10⁷ during the first, second and third step of dehydration respectively.
In the KAS kinetic method, R2 values were found between 0.9959 and 0.9277. Average of Ea values in the first, second and third steps of dehydration processes were found as 89.82, 133.16 and 399.01 kJ, respectively. ko values were found between –19.68 and –0.15 for the first step of dehydration. At the second step of dehydration, ko values varied in the range of –3285.96 – –1.56. At the third step of dehydration, ko values were observed between –7.82×1050 and –21.1.
The calculated kinetic parameters for Kissinger method are given in Table 3. In the Kissinger kinetic method, R2 values varied between 0.9989 and 0.9893. Ea and ko values were found as 140.78 kJ and 1.95×10¹³ for the first step, 131.01 kJ and 2.92×10¹² for the second step, 486.22 kJ and 8.98×1033 for the third step, respectively.
Calculated parameters for Kissinger kinetic method
As it is seen from the thermal kinetic results, the activation energies were found in the ranges of 89.82–140.78 kJ for the first step, 131.01–136.86 kJ for the second step and 391.24 –486.22 kJ for the third step. In comparison with other types of boron minerals, pandermite has a higher thermal resistance than the majority of borates. The activation energies of metal are compared in Table 4 [11, 18–21].
Activation energy comparison of pandermite among the other types of borates
A non-hydrate form of the mineral was obtained from the thermal conversion of pandermite. XRD pattern of dehydrated mineral is presented in Fig. 5. According to the XRD result, Pandermite decomposes into calcium borate and boron oxide, which is compatible with the probable reaction given in Equation (6). The calcined mineral was identified as the mixture of CaB2O4 (powder diffraction file number: 00-022-0140) and B2O3 (powder diffraction file number: 01-072-0626).
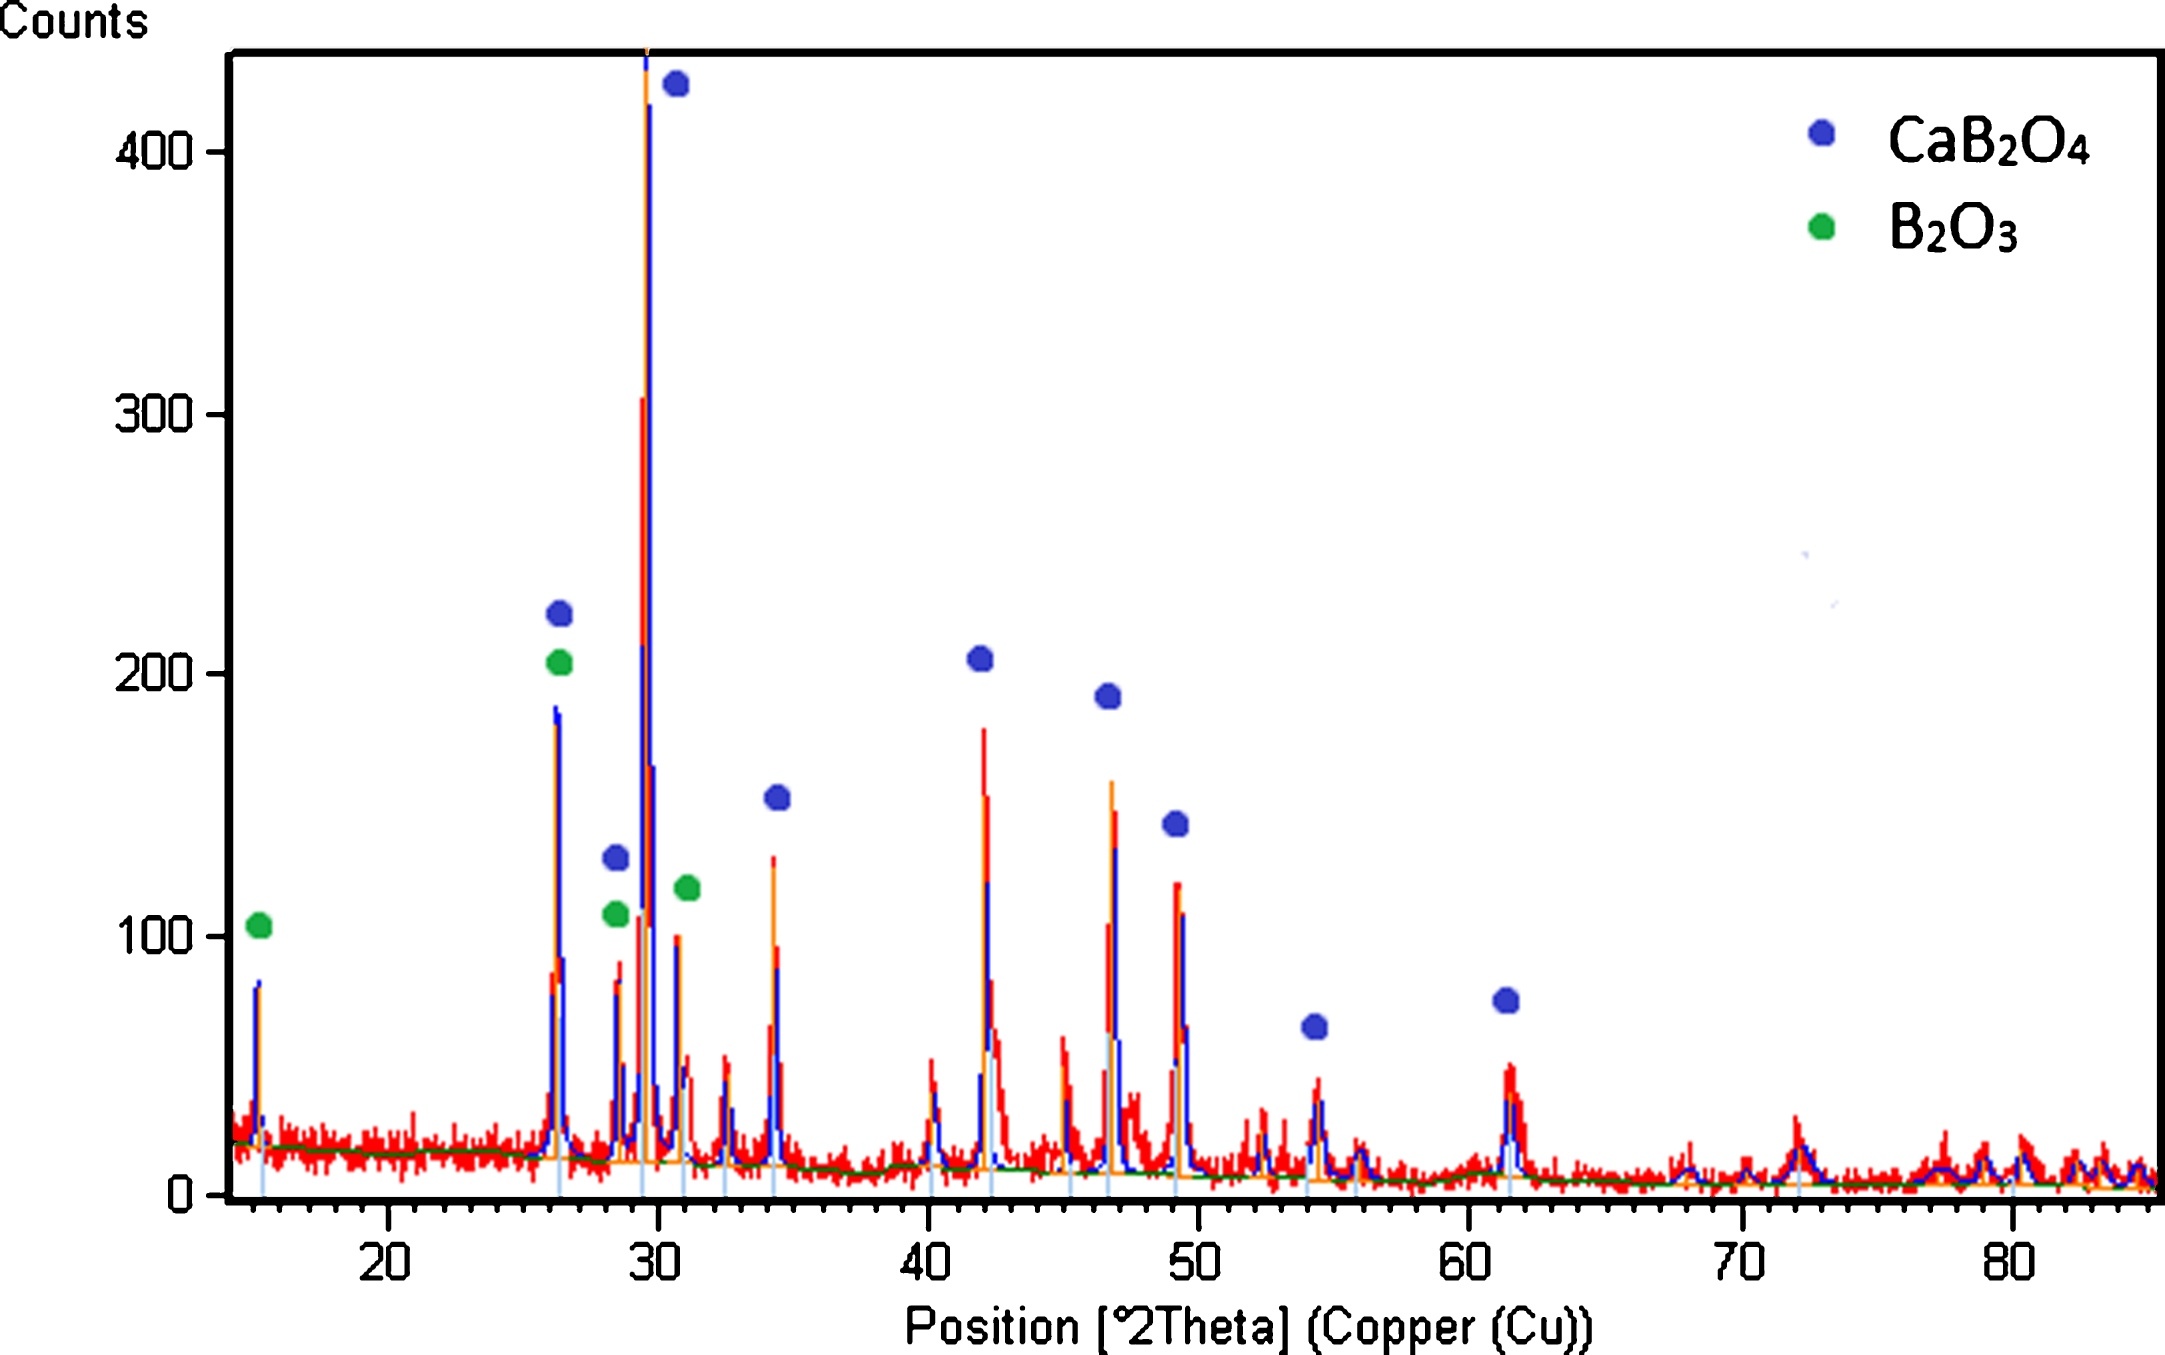
XRD pattern of dehydrated Pandermite.
FT-IR spectrum of calcined pandermite sample can be seen in Fig. 6. According to FT-IR results, the characteristic band values of the crystal water content, which were between 3547 and 1657 cm-1, disappeared. After calcination step, there were some minor changes at the band values of characteristic B-O vibrations because of the decomposition of structure.

FT-IR spectrum of dehydrated Pandermite.
The surface morphology of dehydrated mineral is given in Fig. 7. After the dehydration, some cracks and agglomerations on the angular layers of pandermite particles occur by the separation of water from the structure as well as the heat effect. The amount of sub-micron particles increase and they take the shape of polygonal structures.

SEM image of dehydrated Pandermite.
The investigation of thermal dehydration kinetics are important in the development of applications for boron minerals and compounds. In this paper, a calcium borate mineral of Pandermite (Ca4B10O19 7H2O) was investigated. Thermal analysis results showed that dehydration process of pandermite occurred in three steps. Mineral started to lose its water content at 278.40°C; however weight losses were quite low until 423.98°C. Activation energies were determined by using OFW, KAS and Kissinger non-isothermal kinetic techniques. In the OFW method, Ea values were found as 98.83, 136.86 and 391.24 kJ for the first, second and third stages of dehydration process respectively. In KAS method, Ea of the first step was determined as 89.82 kJ; Ea of the second step was found as 133.16 kJ; and Ea of the third step was calculated as 399.01 kJ. In the Kissinger method, activation energies were determined as 140.78 kJ for the first step, 131.01 kJ for the second step, 486.22 kJ for the third step, respectively. According to XRD results, Ca4B10O19 7H2O decomposes into CaB2O4 and B2O3. At the FT-IR analysis, characteristic band values are found in good agreement with the previous studies. On the basis of SEM observations of the mineral, particle size decreases and agglomerations increase with the effect of heat.
Footnotes
Acknowledgments
The author would like to express her deepest gratitude to Prof. Dr. Sabriye Piskin and Assoc. Dr. Emek Moroydor Derun for their contribution to my academic life.