
Abstract
OBJECTIVE:
To determine whether amniotic fluid volume as measured by amniotic fluid index (AFI) is influenced by maternal pre-gestational obesity as measured by body mass index (BMI).
METHODS:
This was a retrospective cohort study of pregnant women between 20 and 43 weeks gestation receiving ultrasounds with AFI measurements at Augusta University Medical Center between 2003 and 2017. A subset of 500 charts that met inclusion and exclusion criteria were reviewed to obtain maternal clinical data. The study cohort was subdivided by maternal BMI at initial obstetric visit into three groups: normal weight (18.5 kg/m2–24.9 kg/m2), overweight (25.0 kg/m2–29.9 kg/m2), and obese (≥ 30 kg/m2). Chi-square analysis was used to compare BMI groups in terms of categorical clinical characteristics and outcome variables, and analysis of variance (ANOVA) was used for continuous variables. Mixed effects regression models (MRMs) were used to evaluate AFI throughout gestation separately in each group, and MRM-based analysis of covariance was used to compare AFI throughout gestation among groups. AFI curves were constructed for the 5th, 50th, and 95th percentiles for all study subjects combined and separately for normal weight, overweight, and obese subjects.
RESULTS:
Fitted curves relating AFI percentiles to estimated gestational age (EGA) showed statistically significant differences among BMI groups. There was also a significant difference in AFI over gestation across the obesity groups.
CONCLUSION:
Fitted curves for AFI throughout pregnancy showed statistically significant differences among BMI groups.
Keywords
Introduction
Amniotic fluid index (AFI) provides an estimate of the amniotic fluid volume surrounding a fetus and can be used as an indicator of placental function and fetal well-being [1]. Amniotic fluid originates from maternal plasma, and its composition gradually changes as fetal lungs and kidneys develop [2]. The index is determined using ultrasonography and is measured in centimeters. The measurement is done by dividing the abdominal wall into four quadrants using the maternal umbilicus as the center point. In each quadrant, the largest vertical pocket of amniotic fluid within the uterus is measured. The sum of the four vertical measurements is referred to as the AFI [3]. An AFI ≤ 5 centimeters indicates oligohydramnios, and an index ≥ 24 centimeters indicates polyhydramnios [4, 5].
Multiple studies have examined the relationship between AFI and pregnancy outcomes. These studies show that women with oligohydramnios are more likely to have a cesarean section for fetal distress, have delivery at earlier gestational age, have lower birth weights, and lower umbilical artery pH levels [4, 7]. Women with polyhydramnios are more likely to have gestational diabetes, induction of labor, higher birth weight, malpresentation and preterm delivery [8].
There are few studies examining the relationship between maternal body mass index (BMI) and AFI. Studies have examined the relationship between obesity and the utility of ultrasound surveillance. Harper et al. found that the volume of amniotic fluid and fetal growth abnormalities in obese women can most accurately be made after 32 weeks of gestation [9]. Blitz et al. reported that maternal BMI was not associated with oligohydramnios in late gestation; however, this study assumed normative AFI values were independent of BMI [10].
The present study examined the association between maternal BMI and AFI throughout gestation. Recently, studies have been geared towards determining if normative curves should be constructed based on ethnicity, and there is a natural segue into determining whether BMI also should have an impact on construction of AFI normative curves [11, 12]. Establishing curves specific to BMI-based subgroups could be a useful tool to help us identify those women most at risk for complications. As a result, determining the impact of BMI on AFI curves could provide valuable normative data.
Material and methods
This was a retrospective cohort study of pregnant women between 20 and 43 weeks gestation receiving ultrasound examinations at Augusta University Medical Center. Since 2003, the General Electric ViewPoint© software has been used for report generation of all patients seen for prenatal ultrasound at Augusta University Medical Center. This study was granted approval through Augusta University’s Institutional Review Board. The software was queried for all studies from 2003 until 2017 with an AFI measurement recorded. The data was collected in 2017 accounting for the fourteen-year study period. All ultrasounds were done by attending physicians, residents, and ultrasound technicians employed by Augusta University Medical Center. The method used to obtain the AFI measurement included dividing the maternal abdominal wall into four quadrants using the maternal umbilicus as the center point then measuring the largest vertical pocket of amniotic fluid within the quadrant. The sum of those four measurements was entered as the AFI.
The inclusion criteria for the study included singleton gestation, live birth, absence of fetal anomalies (detected either prenatally or post-natally) and at least one AFI measurement obtained from 20–43 weeks. Multiple AFI measurements from individual patients who qualified for study inclusion were permitted in the analysis. Exclusion criteria for the study included multiple gestation, fetal demise, stillbirth, fetal anomaly, gestational age less than 20 weeks, or gestational age greater than 43 weeks. For patients who had given birth multiple times, only amniotic fluid indexes from their first pregnancy were included.
The first 500 individual patients who met the inclusion and exclusion criteria were selected from the cohort, which was arranged alphabetically. The clinical and demographic data for these women were then manually extracted from the Cerner Electronic Medical Record and matched with their corresponding AFI measurements. The study cohort was subdivided by maternal intake BMI into three groups: normal weight (18.5 kg/m2–24.9 kg/m2), overweight (25.0 kg/m2–29. 9 kg/m2) and obese (≥30 kg/m2). Statistical comparisons of the three BMI groups in terms of categorical demographic and outcome variables were carried out using the chi-square test. For continuous variables, analysis of variance (ANOVA) was used. The Tukey-Kramer method was used to perform pairwise comparisons among groups for continuous variables. Separately for each BMI group, and for all participants combined, mixed effects regression models (MRMs) were used to estimate the correlation between AFI and estimated gestational age (EGA). MRMs were used because they can take into account the fact that some women in the study cohort had multiple AFI readings during the course of their pregnancy. An MRM-based analysis of covariance (ANCOVA) model was used to compare the AFI over gestation relationship across the three BMI groups.
The method described in Moore and Cayle was used to construct curves relating percentiles of AFI to EGA in weeks [13]. Determination of due date and gestational age at time of AFI measurement were made using criteria published by the American Institute of Ultrasound in Medicine (AIUM) and the American Congress of Obstetricians and Gynecologists (ACOG) [14]. AFI observations were first stratified into categories based on week of gestation for all study participants combined, then for each BMI group separately. The 5th, 50th, and 95th percentiles of AFI were determined within each estimated gestational age (EGA) category. Curves were then fit to the percentiles by regressing the percentile data on EGA using polynomial regression with forward selection. Each regression model included the highest-order polynomial term that retained statistical significance at the 0.05 level. Polynomial regression models up to order four were used. Curves relating percentiles of AFI to EGA were constructed in this manner for all study participants combined, and separately for each BMI group (normal, overweight, and obese). The Kruskal-Wallis test with Dwass, Steel, Critchlow-Fligner (DSCF) pairwise comparisons was used to compare the BMI groups in terms of the 5th, 50th, and 95th AFI percentiles separately for each of the EGA categories. All statistical analyses were carried out using either SAS 9.4 (SAS Institute, Cary, NC, 2012) or SPSS Version 21 (IBM Corp, Armonk, NY, 2012). All statistical tests were two-tailed and were performed at the 0.05 level of significance.
Results
There were a total of 1744 AFI measurements for the 500 pregnant women in the study, ranging from 1 to 20 measurements per pregnancy (mean = 3.5, median = 2). After classifying the 500 women according to pre-pregnancy BMI, there were 208 (42%) in the normal weight group, 132 (26%) in the overweight group, and 160 (32%) in the obese group.
The BMI groups differed significantly with respect to pre-existing diabetes (Table 1); the normal group had a significantly lower prevalence than the obese group (p = 0.001). Chronic hypertension was significantly more prevalent in the obese group than in both the normal and overweight groups (p < 0.001 for both comparisons). The obese gravida were also significantly more likely to develop gestational diabetes than the normal group (p < 0.001). Development of hypertensive disorders of pregnancy and other complications did not vary among the BMI groups (Table 1).
Maternal demographics by pre-pregnancy BMI classification
Maternal demographics by pre-pregnancy BMI classification
*p < 0.05; Data are presented as number (percent) where applicable.
The results of the analyses examining sonographic findings and obstetric outcomes across BMI subgroups are presented in Table 2. Mean EGA at delivery did not differ significantly among the BMI groups. However, infant birth weight increased in a step-wise fashion with increasing maternal intake BMI category. The normal and obese groups differed significantly with respect to mean birth weight (p = 0.002); the overweight group did not differ significantly from the other two groups. The mode of delivery differed significantly among the BMI groups. Overweight mothers and obese mothers were more likely to have a cesarean section (p < 0.01). There was also a significantly higher incidence of five-minute Apgar scores ≤ 7 in overweight group than in the normal group (p = 0.012).
Sonographic findings and obstetric outcomes by pre-pregnancy BMI classification
*p < 0.05; Data are presented as mean±SD and number (percent) where applicable.
After adjusting for the multiplicity of AFI measurements per study participant using the MRM analysis, the correlations between AFI and EGA varied substantially across the BMI groups. In the normal weight group, the correlation coefficient was 0.057 (p = 0.189); in the overweight group, the correlation coefficient was 0.147 (p = 0.017); and in the obese group, the correlation coefficient was –0.009 (p = 0.874). After aggregating the data from all three groups, the correlation was significant but small in magnitude (r = 0.063, p = 0.036). Based on the MRM ANCOVA analysis, there was a significant difference in AFI over gestation across the obesity groups (p = 0.013).
In order to construct curves relating percentiles of AFI to EGA, the AFI values were first stratified into categories based on week of EGA (20–43 weeks). To facilitate curve fitting at the more extreme GAs and to construct clinically relevant curves, AFI values from EGA greater than 41 weeks were removed from analysis. This left 21 EGA categories (20 – 40, inclusive) on which to base the fitted curves. For all study participants combined, and for each BMI group separately, the 5th, 50th, and 95th percentiles of AFI were determined separately within each EGA category. Polynomial regression was then used to model the relationship between AFI percentile and EGA category. The resulting curves are given in Fig. 1. A visual comparison of these curves indicates that there were meaningful differences across the three BMI groups in terms of the fitted AFI percentiles. For example, at 32 weeks, the estimated median AFI was 12.6 in the normal group, 15.5 in the overweight group, and 13.9 in the obese group. The estimated AFI at the median percentile across all gestational ages demonstrated a pattern that the predicted AFI was lowest for normal weight and highest for overweight groups with the obese groups falling in between. These differences are also demonstrated in Table 3, which shows the predicted AFI for each gestational age sorted by weight category and percentile.
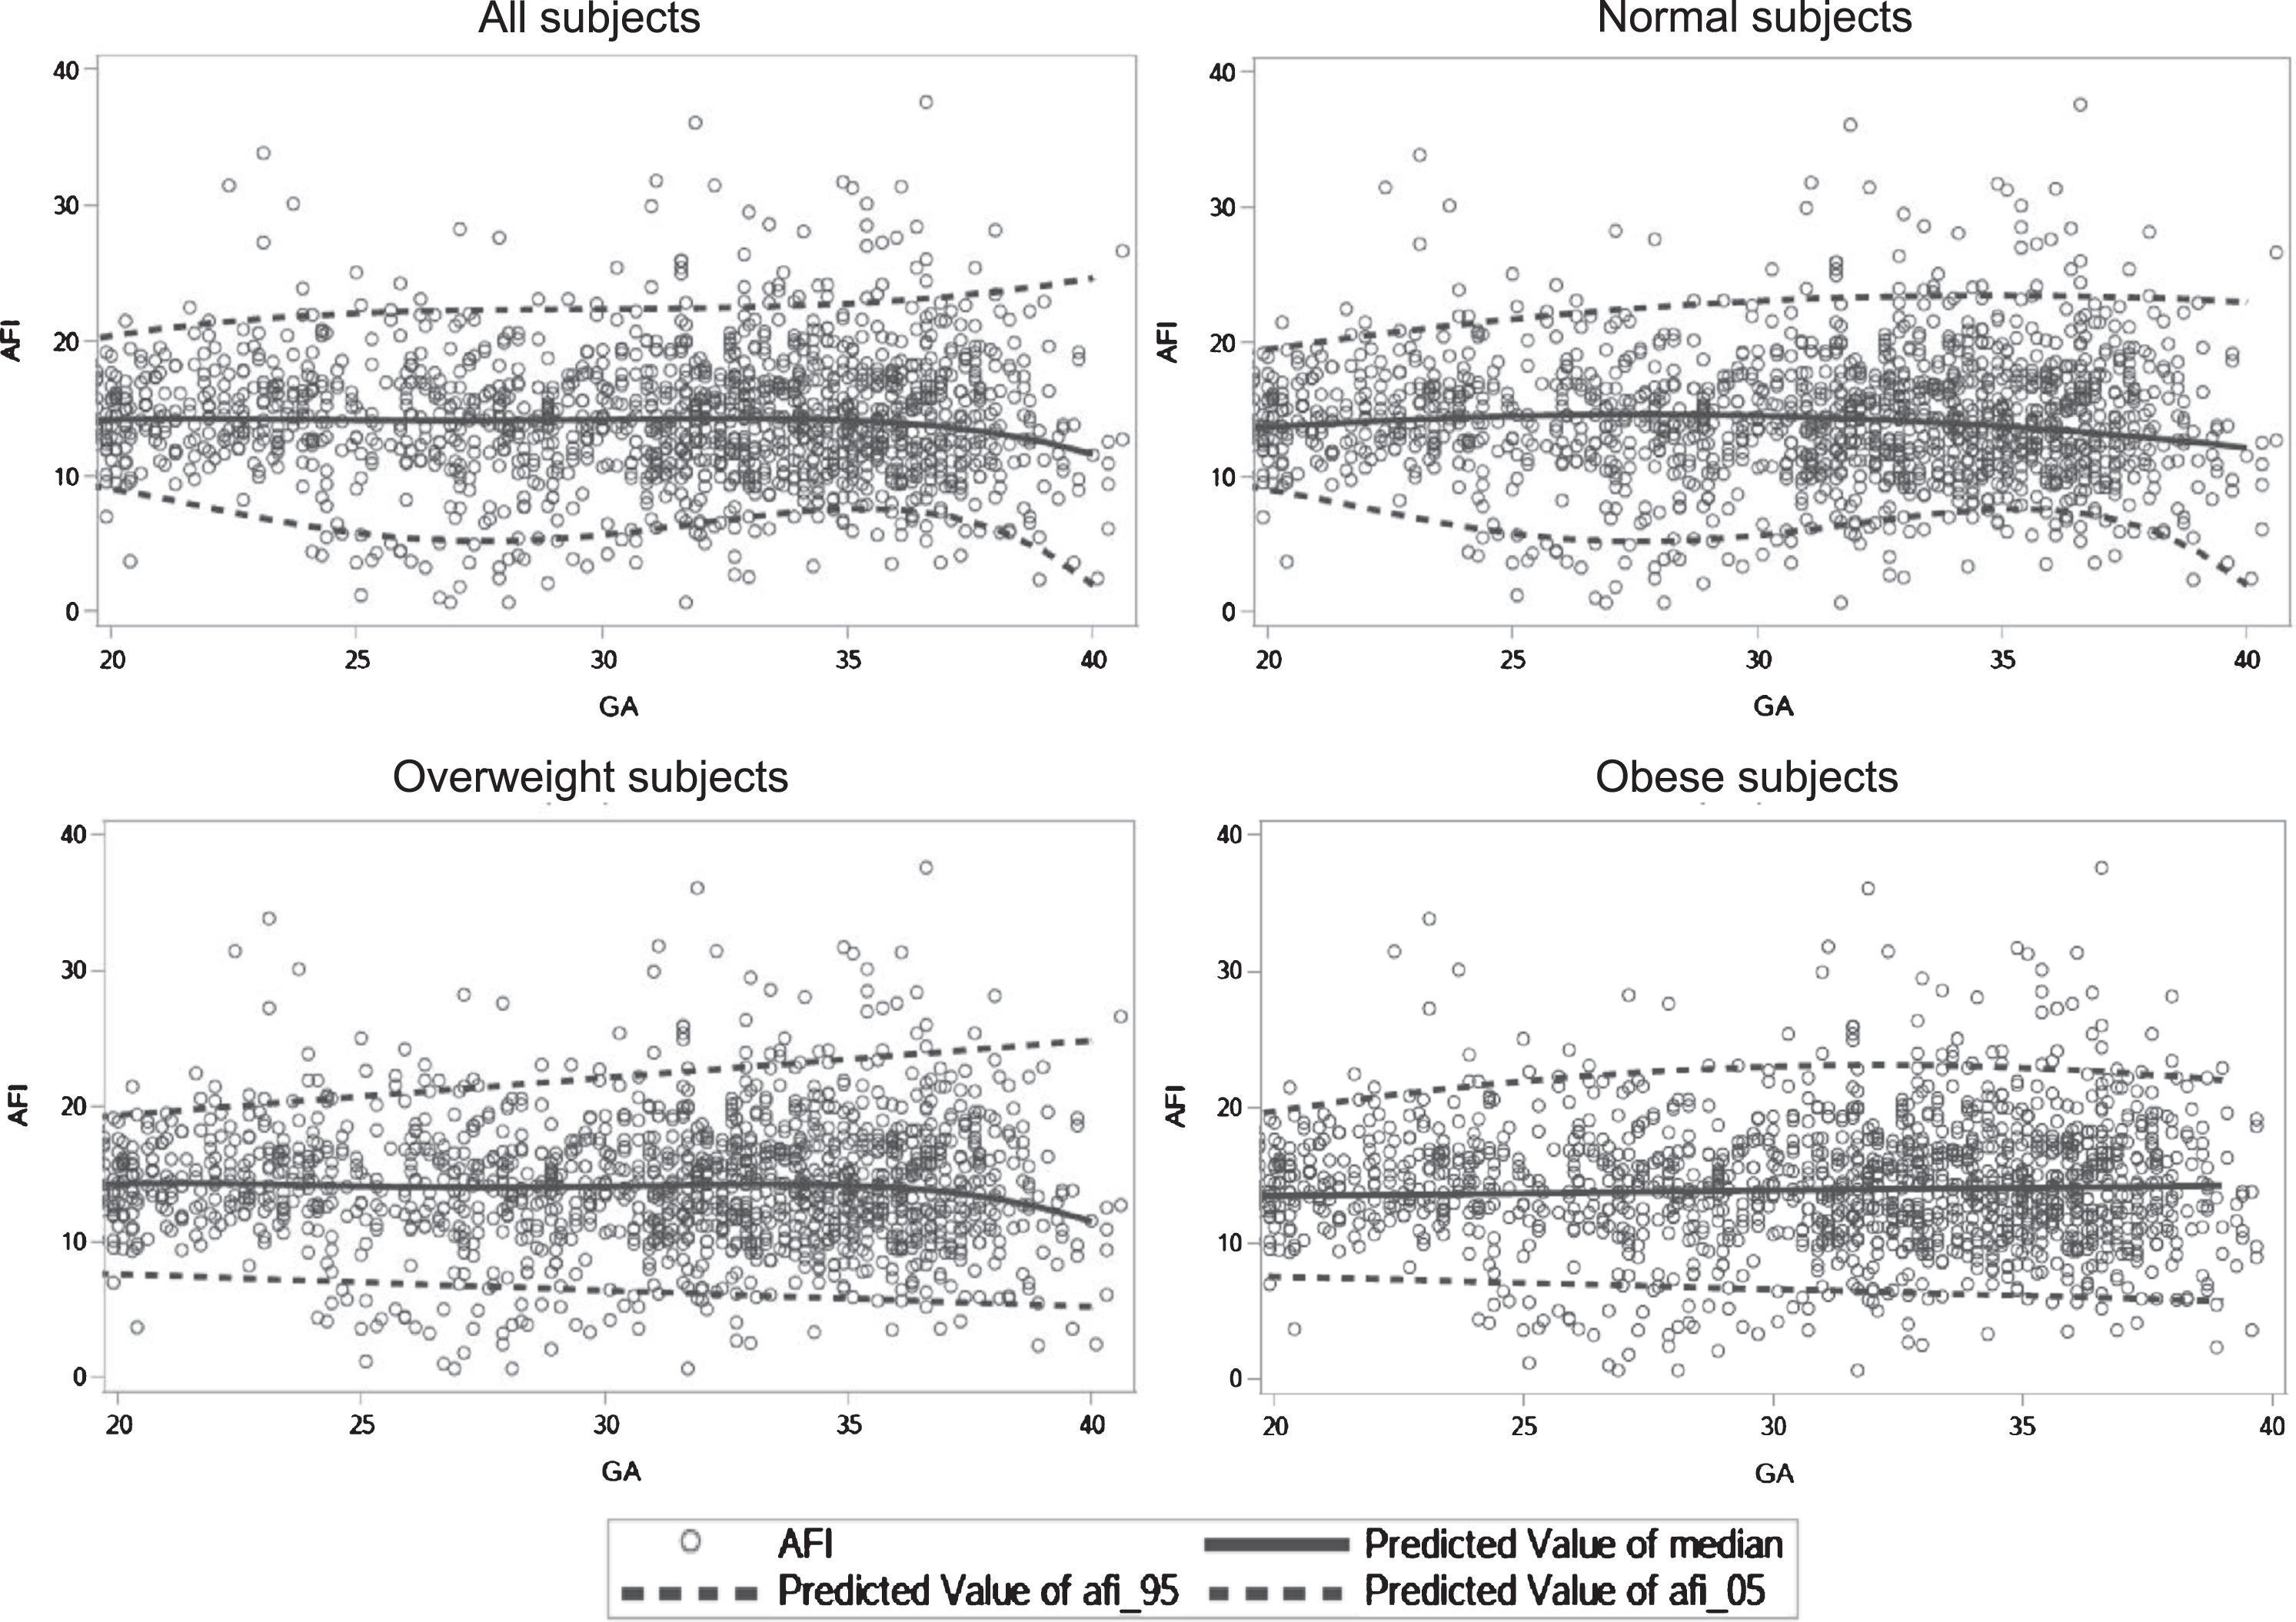
Amniotic fluid index (AFI) curves: Median, 5th, and 95th percentiles; gestational age (GA).
Gestational age-specific 5th, 50th, and 95th percentiles of amniotic fluid index, all subjects, normal weight, overweight, and obese
GA: gestational age in weeks.
When the Kruskal-Wallis test was calculated to compare the predicted AFI percentiles (5th, 50th, and 95th) by obesity category, all tests were statistically significant. This indicated that there was a difference in the AFI predicted percentiles (5th, 50th, and 95th) among obesity categories for all gestational ages (20–40 weeks). When DCSF pairwise comparisons were made, we concluded that the predicted AFI percentiles were different across all 3 obesity categories for almost all of the gestational ages (20–40 weeks). There were 4 exceptions among the 189 statistical comparisons: at week 22, normal and overweight 50th percentiles were not different, at week 23, normal and obese 50th percentiles were not different, at week 35, normal and obese 50th percentiles were not different, at week 38, normal and obese 95th percentiles were not different.
This study was conducted to determine if pre-pregnancy BMI affects amniotic fluid volume as calculated by AFI. Previous studies have assumed a “one size fits all” AFI curve in respect to patient BMI. The current study demonstrates that while there are statistically significant differences among BMI groups; however, these differences are small and are unlikely to be clinically significant.
Our retrospective cohort corroborated the findings of Miao et al. that women with a higher pre-pregnancy BMI were more likely to have pre-gestational diabetes and hypertension [15]. Increased BMI is also associated with an increase in poor maternal and neonatal health outcomes [16–18]. AFI is often used as a measure to predict the risk of these adverse prenatal outcomes, especially in late gestation [19–21]. Including these women with comorbidities in this study is both a strength and weakness of the study as these conditions are frequent in the obese gravida and improve generalizability; however, these comorbidities may also be accompanied by pathologic changes affecting AFI separate from normative values.
Recently, there has been a focus placed on determining whether or not normative AFI curves should be constructed based on specific populations. Sing et al. examined AFI curves in India and determined that population specific normative AFI curves should be used whenever possible to better target pregnancies at risk for complications without causing unneeded maternal anxiety [11]. Chama et al. reported a similar study in Nigeria and came to the same conclusion that normative AFI curves should be established for local populations to better provide healthcare to specific populations of women [22]. Arujo et al. studied Brazilian women and established normative AFI curves for their pregnant population [23]. These studies imply that racial and ethnic differences have a significant effect on AFI values during pregnancy. This is the first study which examines the relationship between maternal obesity and BMI, irrespective of race.
The current study is limited in power and does suggest that normative AFI curves differ between American women with normal BMI and American women with increased BMI. The differences in our study are small, but these differences may be found to be more dramatic in studies with a larger number of AFI measurements. The importance of determining normative curves becomes more significant when determining whether the patient’s AFI measurement should be considered oligohydramnios or polyhydramnios and how the patient should be managed clinically. Taking into account maternal factors, such as BMI, offers another tool to best identify mothers who are at high risk for prenatal complications and to better allocate healthcare resources.
Conclusion
Pre-gestational BMI is associated with statiscally significant differences in the normal AFI curve between normal weight patients and overweight/obese patients. These differences, though statistically significant, are small and may not be clinically significant. Larger studies are needed to determine whether the differences in normative AFI curves are both statistically and clinically significant.
Disclosures
The authors report no proprietary or commercial interest in any product mentioned or concept discussed in this article.
Footnotes
Acknowledgments
The authors are grateful to the Department of Obstetrics and Gynecology at Augusta University Medical Center, the Department of Maternal of Fetal Metal Medicine, and the Department of Biostatistics and Epidemiology for administrative support.