
Abstract
New business processes are increasingly data driven as sensors have become ubiquitous. Sensor data could be a valuable new data source for official statistics. To study this presumption Statistics Netherlands conducted a small-scale use case in the area of agricultural statistics in collaboration with an innovative farmer. A selection of his sensor data was explored for overlap with current data demands in surveys. The aim of the study was to obtain insights in the available agricultural data, their data structure and quality, and explore new methods of data collection for agricultural statistics. The conclusion is that these data are valuable for replacing or pre-filling (parts of) certain agricultural surveys. However, many more challenges surfaced than we expected, to which the title of this paper refers. These challenges will be discussed in this paper.
Keywords
Introduction
More and more, new business processes are becoming heavily data-driven. An example is smart or precision agriculture (PA), where sensors have become ubiquitous. The generated sensor data might also be useful for official statistics, and used instead of survey data or to (partly) complete questionnaires, thus reducing response burden. Moreover, these sensor data could contain information that is too detailed to ask for in questionnaires or could provide new insights into new agricultural production systems such as sustainable farming or natural capital. To study these presumptions Statistics Netherlands (CBS) conducted a small-scale use case in collaboration with an innovative potato farmer and the Eindhoven University of Technology (TU/e). The goal of this study was to obtain insights in the available data, the data structure and quality in order to assess the potential of sensor data for official agricultural statistics.
The paper starts with a general introduction to business data collection, and a brief discussion of new developments in the business world (smart industry), narrowing down to precision farming. Section 2 focusses on our research questions and discusses smart farming activities of our innovative farmer: the generated PA data and the overlap between these data and the data asked for in agricultural survey questionnaires. In Section 3 we will discuss the data challenges of PA data and its usability for official statistics, based on our data use case and a literature review. For this discussion we will start Section 3 with an overview of criteria on the usability of sensor data for official statistics. Section 4 concludes this paper and looks into the future with next steps.
A very brief history of business data collection
Before the 20th century, data for statistics were mainly gathered via a census approach: every individual within a population was counted. In the second half of the 20th century, sample surveys became the main method to collect data for official statistics. Sampling has proven to result in both unbiased and precise statistics, provided that they are designed and conducted carefully, and error sources as defined in the Total Survey Error framework are minimized. This makes surveys costly both for National Statistical Institute (NSIs) and businesses, who may experience high response burden, especially when they are multi-surveyed [4, 5, 24, 28]. In Europe, since the 1970s secondary data collection was increasingly relied upon for official statistics: registers and administrative data were being used to replace or supplement surveys or for data validation. These registers are maintained by other organisations such as the Tax Office, Chambers of Commerce, or municipalities in support of their own administrative goals. CBS e.g. by law [18] has access to more than 200 registers coming from governmental organisations, serving as input for social and economic statistics. In Finland e.g. agricultural statistics are mainly based on register data, although surveys are still needed to collect additional data [30].
Since a few years now, the potential of a third data source, big data, is being explored, characterised by the four Vs: volume, velocity, variety and veracity [33]. Some examples of this are satellite data, ship tracking data, and traffic loop data [7, 12]. Examples of big data that are relevant in the agricultural sector are remote sensing data like satellite images, GPS data, climate and weather data, real-time data generated by sensors [31, 50, 54]. Statistics Poland [32] and Estonia [53] e.g., studied satellite images and radar data (Sentinel 1 and 2) for identifying arable fields and crop detection in order to estimate crop yields. Unlike surveys, and as with registers, statistical institutes have no control over the data generating process of these secondary type of data [43].
Many countries nowadays have a two-step data collection policy [3, 21, 22]. Only in case secondary sources such as register data and big data do not provide the necessary information, surveys are conducted. The main driver for this policy is cost reduction, both at the NSI side and the business side, i.e. reduction of response burden.
Smart industry: Sensor data as a data source for official business statistics
Above we mentioned real-time data generated by sensors as an example of big data. In this paper we will focus on these data and discuss its usability as input for business statistics. Businesses are evolving and innovating rapidly [47, 48]. Nowadays, more and more business processes generate a huge amount of data: these (sensor) data are being generated through digitalisation and robotics, and integrated through the Internet of Things. This revolution is referred to as the development of Smart industry, also called Industry 4.0 [26].
In the agricultural industry we see a similar development, referred to as smart farming or precision agriculture (PA) [35]. In contrast with traditional ways of producing crops in arable farming, where actions are taken on field-level, in PA actions are specifically tailored for a certain section within a field. This level of detail requires good insight into the fields (see e.g. [17, 50, 52]), and requires the availability and analysis of many data provided by sensors, occasionally supplemented by manual measurements. Charania and Li [11], Pham and Stack [35], and CEMA [9] provide an overview of agricultural technologies applied in PA, including:
Machines, drones and robots with sensors. These sensors collect a large number data on crops, growing conditions, and farming activities, like soil and crop health (soil moisture and temperature, nutrients, crop diseases), spraying of crop protection chemicals. Geo-positioning Systems, to track the position of machines on the fields. Based on the soil data, the plants are treated in a tailored way. Internet of things, enabling the communication between the machines, the Farm Management Information System (FMIS), the farmer, and other stakeholders.
An overview of PA data sources that could serve as input for official statistics is given by Arnold et al. [1]: satellite data, sensor-generated data, use of robots, use of drones, FMIS, and apps to be used on the farmer’s smart phone. FMISs are the core registration system and database used by farmers. Based on FMISs farm data on crops, planting, fertilization, and harvesting can be produced. Apart from being a database, an FMIS also enables communication with e.g. sensors on the one side (data input), and data deliveries and reports to end-users like the farmer himself, but also wholesale buyers of the products, banks, and government agencies like the Ministry of Agriculture and statistical institutes (data output). For a discussion on FMIS functionalities in PA we refer to Kaloxylos et al. [29]. FMIS might be a good source for official statistics.
In the discussion on using sensor data for agricultural statistics we also need to take into account the farmers perspective. In the Netherlands sample surveys are still an important collection method for agricultural statistics. However, collecting data via questionnaires is becoming more and more cumbersome which was reflected in low response rates as low as 45% for voluntary agricultural surveys. In 2017 most of these surveys became mandatory by law [20], which increased response rates to about 75% with voluntary surveys staying at the same low response level [44]. At the same time, the attitude of farmers towards completing questionnaires did not change: it is time consuming, and requires a lot of internal data retrieval from their FMIS where data are electronically available [46]. Farmers considered this a waste of time; their typical reactions was: “What is in it for me?”.
In addition to PA data sources offering potential to create more real-time and detailed statistics, and lowering the response burden on farmers [43], these data can be combined with existing administrative and survey data to address relevant current policy questions regarding new production systems and indicators such as sustainable farming and natural capital. This research question was however not part of our study.
A data use case of sensor data: A PA potato farmer
Research questions
In order to study the potentials of PA sensor data for official statistics, a small-scale data use case has been carried out whereby CBS joined forces with an innovative arable farmer and the Eindhoven University of Technology (TU/e). The farmer applies precision farming technologies, and made a selection of his (sensor) data available to CBS.
Two research questions lie at the heart of this case study:
Is this data source fit for purpose with regard to replacing (parts of) agricultural survey questionnaires by these data? And if so, how can these data be collected: can PA data be collected without using questionnaires, or can the data be used to automatically complete (parts of) a questionnaire? Which quality and utility criteria can we develop to assess the use of sensor data for official statistics?
This section summarises the main findings of this case study [36, 37, 38], and will focus on the first research question by investigating the overlap between the data generated by the farmer and the data needs of NSIs. In this sense, the study has a qualitative nature and looks at the level of the different variables in the data of one farmer. It has neither the possibility nor the ambition to make extrapolations to other farmer data and will only make some assumptions on what could be possible for official statistics when more data became available. In Section 2.2, we discuss the data on the supply side, including the data generating process at the farm, the data infrastructure (i.e. the data flow and the systems in place used for data storage), and the quality of these data. In Section 2.3, we discuss the demand side: data that are asked for in agricultural surveys targeted at arable farmers. In Section 2.4, the data selection made available by the arable farmer is analysed with respect to the data asked for in these surveys, i.e. the overlap with the surveys where we will aim to address the first research question.
The farmer’s data infrastructure.
The data generating process: The PA cycle
The farmer in our study produces potatoes, sugar beets, and corn, with potatoes as the main crop. The business area is more than 500 hectares spread over more than 100 fields. On the farm many sensors are used to monitor and optimize the farming processes. The farming activities depend on the season of the year. This process starts in the winter: field borders are drawn in to determine the location and size of each field; variables such as soil moisture and nutrients are measured through a soil scan using sensors that measure electrical conductivity; tractor lanes are determined in this season to maximise yield. In spring, the seed potatoes are planted. The yield potential within one field is not uniformly distributed; certain sections in the field may contain more or less nutrients, are more or less humid, and get more or less sunlight. Based on these parameters, the farmer varies the planting distance within a field. In the summer, the potato plants are supplemented with water, nutrients and pesticides. On the basis of the measurements of the humidity sensors and the weather station, the system manages the water supply. In addition, there is also data gathered on the condition of the plants. The sensing consists of deriving vegetation indices. In addition to sensing, the farmer also makes use of manual sampling. Around eight different samples are done per field in a given cycle. Potatoes are harvested in the autumn where the farmer monitors the crop yield closely using a custom-made harvester: information on the weight of the potatoes, GPS information to determine the exact location within a field, and the speed of the tractor and treadmill on which the potatoes move towards the storage bunker. By combining these three sources, it is possible to create insightful maps of fields and their yield performance.
In addition, the farmer uses open data like satellite and weather data to make decisions. Van Dijk and Kempenaar [50] describe various open data sources that can be used within precision farming. These data include satellite data, meteorological data from the Dutch meteorological institute (KNMI), and soil type data.
The farmer’s data infrastructure
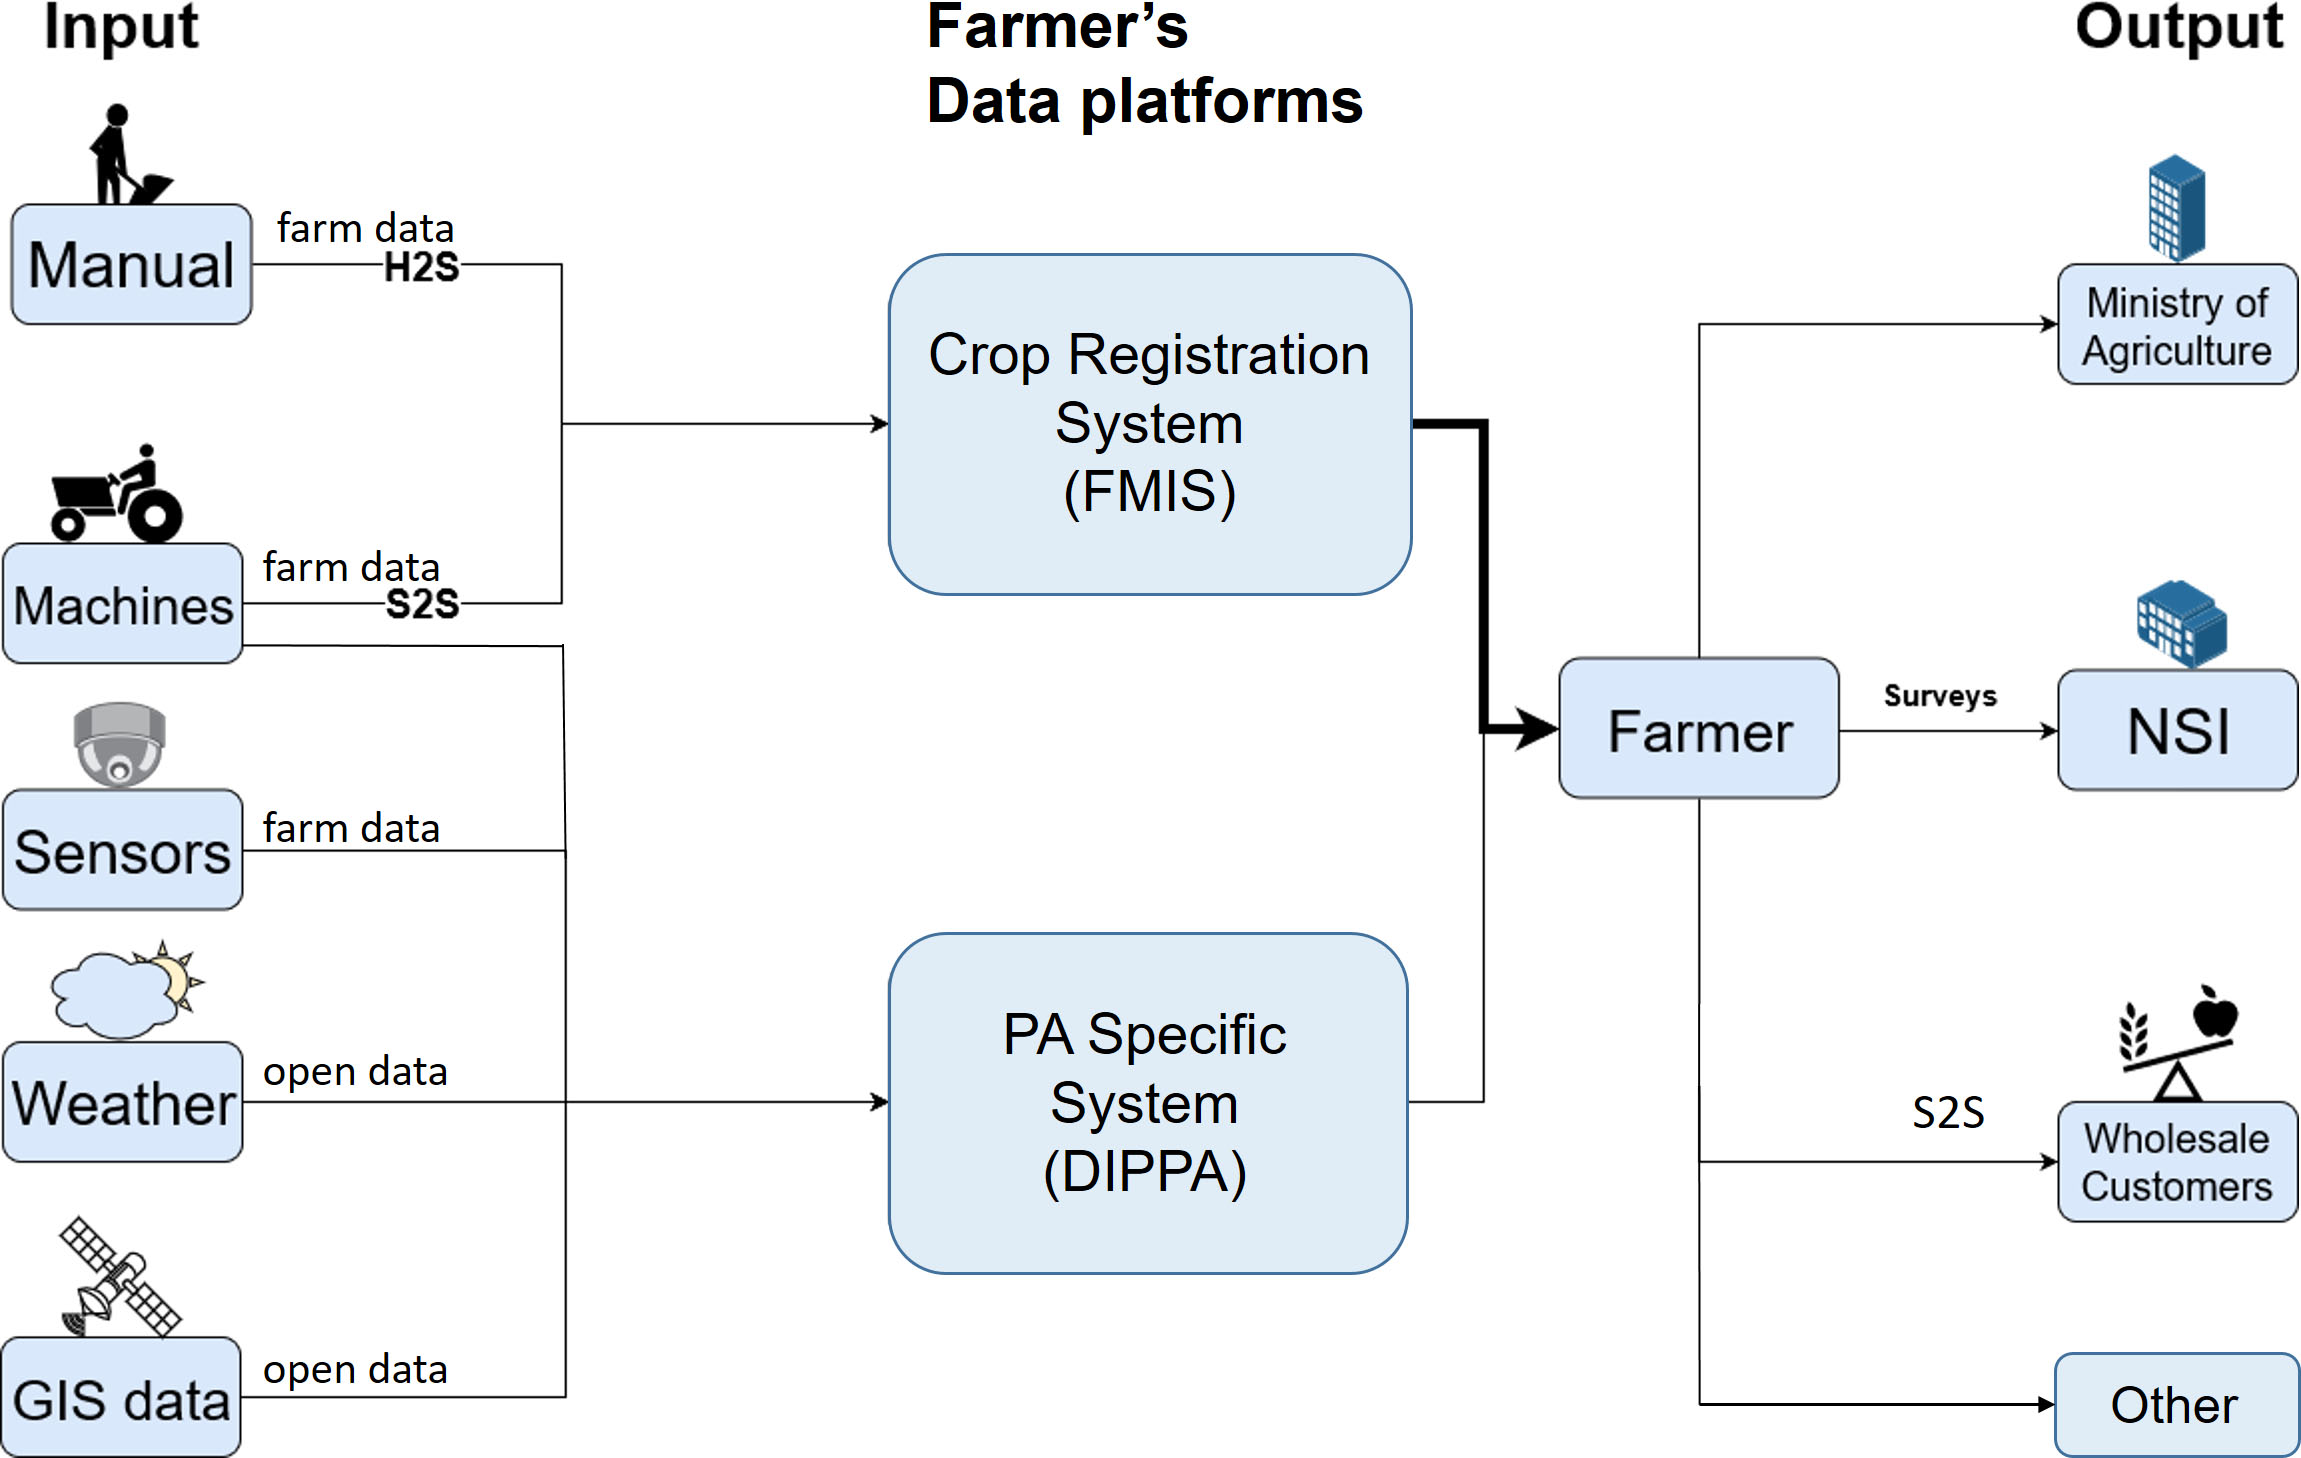
The farmer’s data are stored in two different data platforms: the farmer’s ‘Crop Registration System’ (CRS; which is his Farm Management Information System, FMIS), and a platform for PA data (called DIPPA: Data Integration Platform for Precision Agriculture [19]), as is shown in Fig. 1. DIPPA was designed and developed by the farmer in close cooperation with the Eindhoven University of Technology. The DIPPA platform is specifically tailored to the farmer’s needs and houses most of his sensor-generated data. This system stores PA data and makes it easy to be used by domain experts and data analysts. This PA-Specific System is a small-scale, not-standardised system with the sole purpose of storing and managing ‘new’ data such as sensor data and other PA data.
The farmer’s CRS is a commercially available software package, and is widely used in the agricultural sector, such as Dacom and AgroVision [27]. These FMIS systems are designed to store all farm data that farmers are required to register by law and to manage the farm. These have the following characteristics: ‘diary’ of the parcels of the farm, including registrations of the fields, crops and yields; registration of usage of pesticides, manure, etc.; data on managing the farm like financial data and data on his staff; export functions to report to third parties like wholesale customers, the Ministry of Agriculture, the Tax office, and CBS; industry harmonised data formats (EDI-Crop [23]). This CRS is the farmer’s major data system; this is his FMIS [14, 29].
In a CRS it is possible to keep digital records of all farm activities. To start, a farmer enters the coordinates of his fields into the system. This can be done by uploading a Shapefile or by drawing the fields on a map using a selection tool. Afterwards, the farmer can assign crops to the fields with additional information such as crop strain and purpose of crop e.g. human consumption, fodder or bio-energy. Once the farm records have been set up, farming activities can be added to these records during the cultivation season. These activities usually fall into a category associated with standard farm practices: planting, irrigating, fertilizing, crop protection and harvesting. These activities can be entered manually, i.e. human to system (H2S) data communication, or they can be imported directly from the farmer’s machines, i.e. system to system (S2S) data communication. Variables like the event timestamp, the field on which the activity takes place are also stored in the records making it a potentially real-time event-based database. Another interesting feature of these CRSs is the export functionality. More importantly, the data can be transformed into a harmonised data format (EDI-Crop [23]), making data communication with other systems easier.
The CRS used by our farmer proved to be insufficient for storing and analysing all his PA data and monitoring the crop production. Therefore, a second data platform (DIPPA) was developed specifically for managing his PA data (see PA-Specific System in Fig. 1). It may however not be very efficient and error prone to use two systems. Recent versions of CRSs support the storage and analysis of PA data: Dacom [14] e.g. offers Cloudfarm, a tool to link PA data to the CRS and options to include open data.
The quality of the sensor data
The farmer’s sensor data in DIPPA could not be analysed straight away. First, a complete and accurate description of the metadata was missing. Secondly, the data needed to be cleaned: the data suffered from e.g. missing values, measurement errors (e.g. incorrect values), and duplicate records [19]. Some errors could be corrected by checking the data, but in order to get a complete understanding of the content of the data the farmer’s expertise about the data and the data generation process was indispensable.
Since these PA data are a secondary data source, we used a quality assessment checklist that had been developed by Daas et al. [13] for quality evaluations of administrative data sources in the context of official statistics. Here, we focussed on assessment of the metadata and the quality of the data. In terms of the metadata we detected some of the following issues in the DIPPA data:
The documentation about the variables in the system (like a code book) is missing; for quantitative variables the units of measurement (like kg, ha, kg/ha) is not specified. Unique keys. A key enables individual records within a database to be linked to different tables or other data sources. The DIPPA keys are not standardised; they are specific to this database and cannot be used to link to other data sources. Data treatment by database administrator. The original, raw data, as provided by the farmer’s data manager in Excel, were cleaned before it was handed over to CBS. It was therefore hard to know the changes that were made to the data.
The original raw DIPPA data contained a number of quality issues [19]:
Depending on the period of the growing season, the data are entered manually. Some samplings and actions are recorded, but not systematically for all fields. Consequently, the database contains a lot of missings (null or zero values): item missings, as well as missing and empty records of farming activities. Data are stored in inconsistent ways, using various formats. E.g., ‘28 May 2016’ is stored as “28/mei”, “28-05-16”, or “28/5/2016”. Because of inconsistent spelling or spelling errors, data are represented in various ways, like for fertiliser products: “zeugen mest” or “zeugenmest” (sow manure). Also, some data is measured in ranges and stored in inconsistent formats: 50/60, 50 60, 50–60. Some variables appeared with different spelling in the database. In the original database records and columns were duplicated to make comparisons on the outcomes of the previous/current year or weeks. The database contained redundant information.
This resulted in a lot of data inspection and cleaning introducing errors because of the missing data documentation, and the required domain knowledge [19]. In this data cleaning process, outliers were not detected, and wrong values of data were not modified. All these data quality issues has lead TU/e to improve the DIPPA system and develop DIPPA 2.0 [41].
Overlap between agricultural surveys and farm sensor data.
Thus far we have discussed the farmer’s data (the data supply side), now let us turn to the data demand side: the data users. The two platforms taken together (CRS and DIPPA) contain the data that are needed for reports to be sent to other parties, like the Ministry of Agriculture, wholesale customers, the Tax office, commercials banks, but also to the Netherlands Enterprise Agency (RVO) and CBS. The reports to RVO and CBS include the following four surveys, specific for arable farming:
The Combined Survey (conducted by RVO annually, and sent out in May; data are shared with CBS). Crop Yield Survey (CBS, sent out annually by the end of October). Crop Protection Survey (CBS, sent in mid-December once in four years). Grassland Usage Survey (CBS, sent in mid-December every year).
The surveys conducted by CBS are part of the mandate that CBS has to collect data for European agricultural statistics. This mandate is based on European regulations [20] and falls under the European Statistical System (ESS). These statistics are mandatory since 2017 (with exception of the Grassland Usage Survey). The data are collected by means of conducting a sample survey: an electronic questionnaire is sent to the sampled farmers, which they have to complete and submit.
The Combined Survey deals with all kinds of topics such as number of employees, farm area, manure, farm animals, horticulture, floriculture, mushrooms, and subsidies. The Crop Yield Survey deals with the (expected) yields of a number of crops (like wheat, barley, rye, corn, and potatoes), and the sowing of winter crops (e.g. winter wheat, barley, and rye). The Crop Protection Survey asks the farmer of their use of chemical, mechanical and biological measures taken in order to protect their crops. Finally, the Grassland Usage Survey asks about the harvesting of grass on the farm: how much, how it is stored and for what purpose?
Data overlap between the farmer’s data and surveys
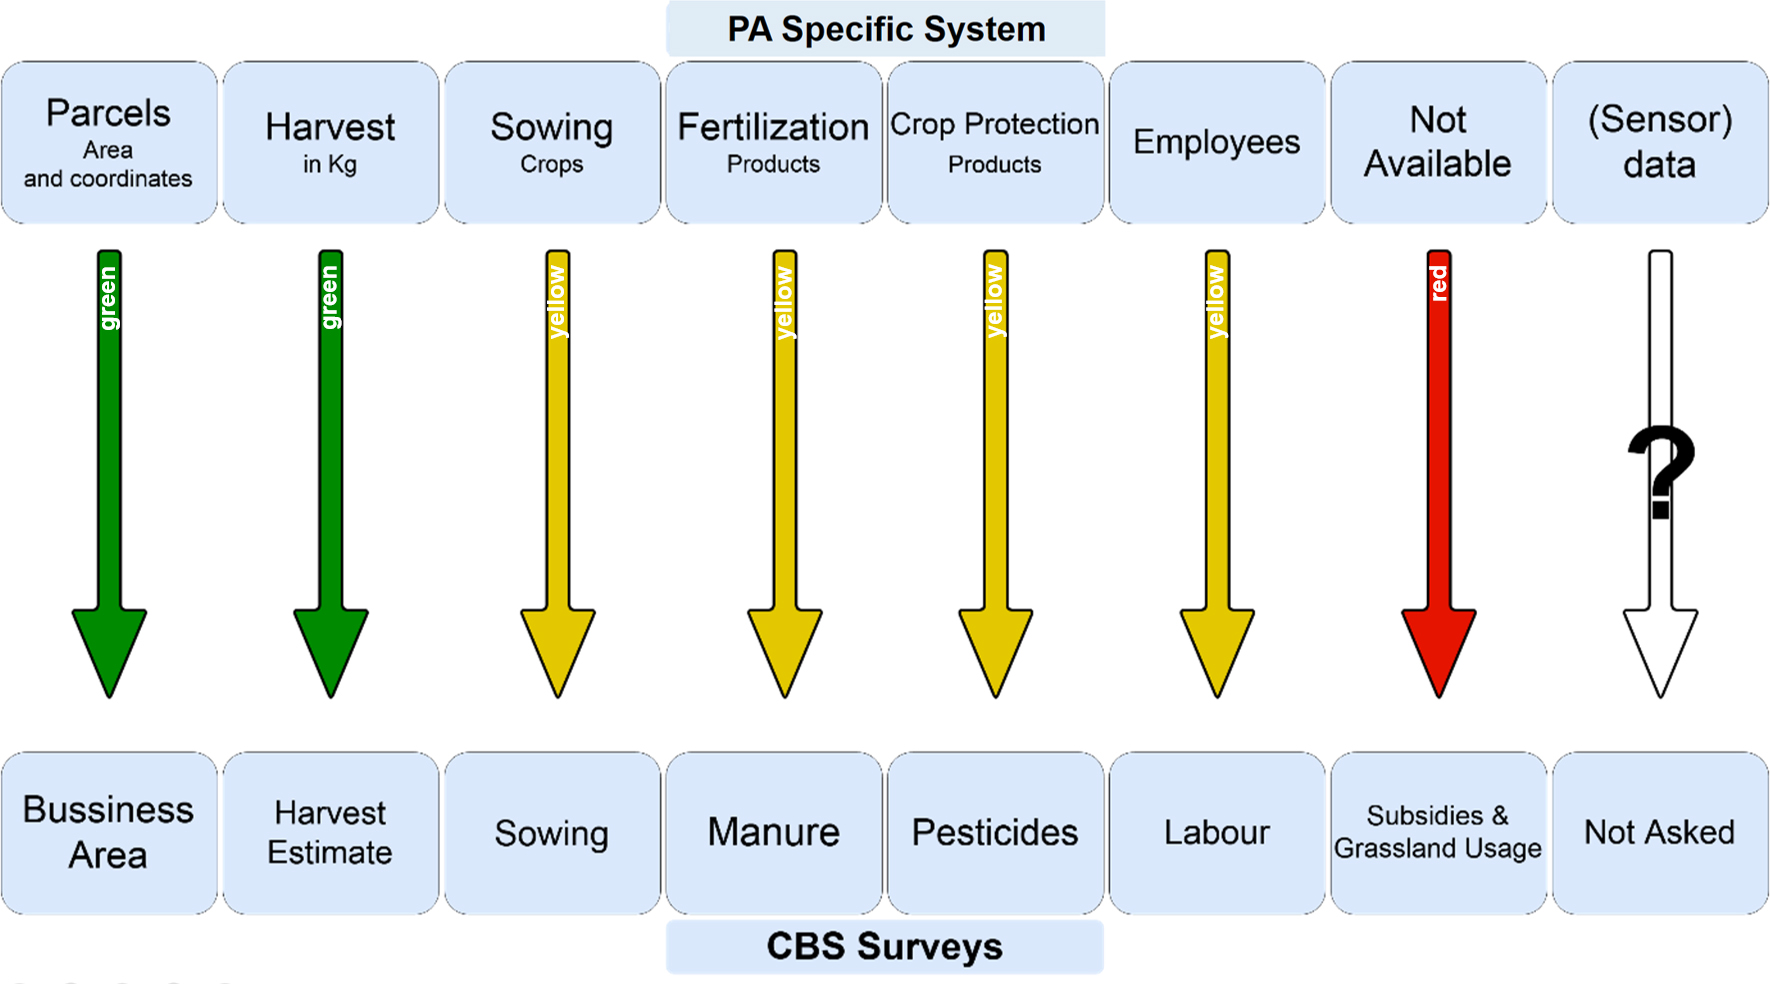
We have seen that our farmer uses two different systems. Therefore, in the analysis with respect to the overlap with the surveys, it was decided to include both. First, with respect to the PA-Specific System (DIPPA [36]): The analysis of the sensor data showed that a lot of the questions asked in the surveys can either be directly answered or indirectly deduced from the data in the DIPPA database. One of the most interesting findings in our study was that in the case of the Crop Yield Survey, the production part of the survey could be retrieved directly from the database. We make therefore the assumption that when sensor data of other crops than potatoes are available, likewise, crop yield surveys do not need to be filled in by the farmer anymore. The more complex Combined Survey, can be partly filled out: surface area and fertilization. The section that deals with employees can potentially be filled out using the database, however key details about the relationships to the farm owner and contract specification are still missing. Figure 2 shows the subsections of all surveys and how well they overlap with the PA-Specific System (DIPPA), where green indicates a strong overlap, yellow meaning partial overlap and red indicating no overlap at all.
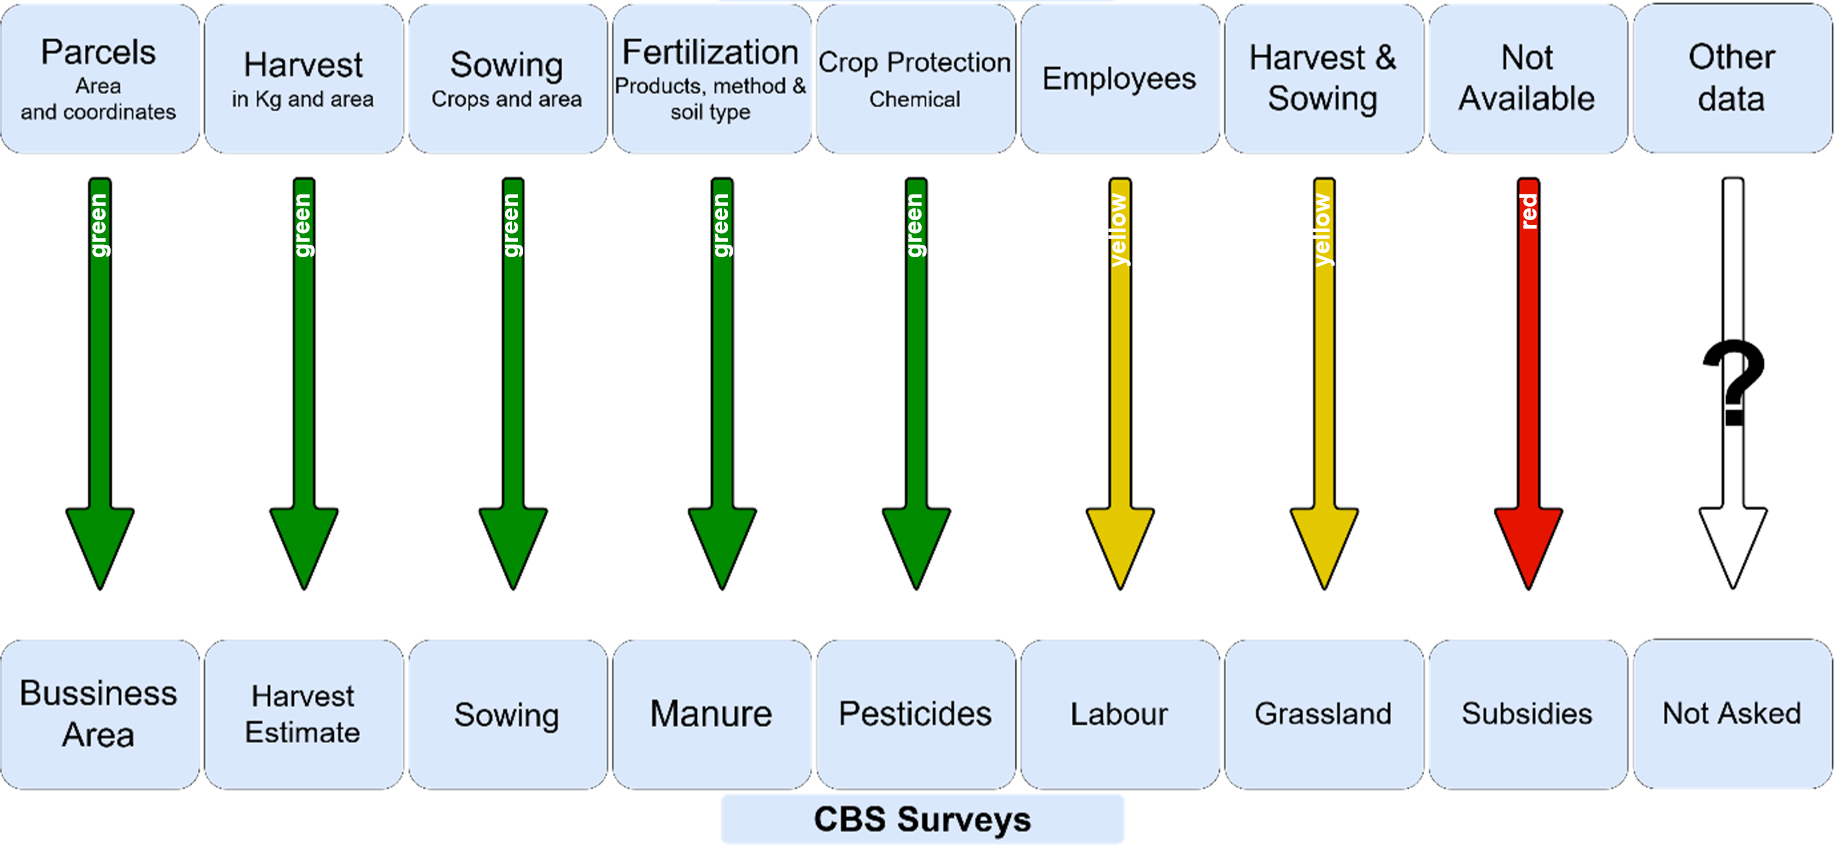
For the CRS/FMIS used by our farmer, a similar analysis has been conducted: Here also all variables related to pesticide and fertilizer usage are available, as well as the sowing of (winter) crops. The combined results for both data systems are shown in Fig. 3. Neither of the two systems are useful to gather information about subsidies. The CRS/FMIS houses the more traditional information about a farm and has therefore, unsurprisingly, more in common with the surveys sent out by CBS, whereas, the PA-Specific System has very detailed information about the farm (collected with PA technology).
Overlap between agricultural surveys and data in the two farmer’s data systems.
Sensor data: Criteria for their utility
So far, we have discussed the data of one farmer in relation to the data needs of an NSI. Sensorized harvesters collect e.g. geolocated data about crop yields like wet mass and average moisture percentage. These sensor data can be used to complete parts of the Crop Yield Survey Questionnaire (see Fig. 2). We have concluded that there is some overlap between his PA data and data asked for in surveys. This could make these data a good source to replace (parts of) surveys. We also observe that the data quality needs to be improved, both metadata and the data quality. However, going back to our first research question (Is this data source fit for purpose with regard to replacing (parts of) survey questionnaires by these data?), more issues need to be considered in order to assess its fitness for purpose, i.e. the utility of these data. In this section we will discuss PA data and its fitness for purpose.
The use of sensor data also requires a separate and new IT architecture and infrastructure, presenting investments by NSIs. Furthermore, businesses (like farmers) may not be willing to share the data. We could state that sensor data are candidates to enrich or replace survey data when a survey is relatively costly and/or inaccurate, when sensors are relatively cheap and/or accurate, produce timely and accurate statistics, and when businesses are willing to share sensor data. Fitness for purpose criteria are considered from three perspectives: the survey quality-costs, the sensor data collection quality-costs, and the respondent (the business) perspective [15]. Here we have adapted these criteria for social surveys to business data collection processes.
From the survey perspective existing survey topics may be candidates for enrichment or replacement with sensor data, when they satisfy at least one of the following criteria:
Burden: The survey topic(s) are burdensome for a business, in terms of time, cognitive effort, or data retrieval; Centrality: The survey topic(s) are non-central to businesses, i.e. the topic is of no relevance to business owners or does not have any added value to them; Conceptualisation: The survey topic(s) do not lend themselves to a conceptualisation through a survey question-answer approach to begin with.
Examples that satisfy the first criterion are topics that require a lot of data retrieval from business records, and additional data processing to calculate the requested answers to the questions. Business records often are event based (harvesting or fertilizing fields) whereas questionnaires ask for aggregated numbers on the business level. The second criterion is applicable to many business surveys. Often businesses ask: “why do you need all these details?” And: “What is in it for me?” [46]. The third criterion could apply to complex (economic) concepts, e.g. sustainable agriculture. However, even for seemingly simple concepts (like the number of jobs in a business, or what fields need to be included in the counting) developing a valid measuring instrument can be quite complicated.
From the sensor data collection point of view, the main criteria are:
Omnipresence: The sensor(s) are applied within a business covering the entire business process and by most businesses in the population, i.e. that many farmers would use PA technology and collect these data; Data access: Data generated by the sensor(s) can be collected (in some way) and processed; Quality: The sensor data are of good quality, including e.g. unbiased, accurate, comparable, and reproducible; this also includes the availability of the metadata defining these data; Costs: Any costs associated with the use of these sensor data or implementation of the sensor collection process are affordable for an NSI.
These four criteria all link to the utility of the resulting sensor data. The omnipresence criterion refers to the coverage. This relates to the question how many farmers do actually apply PA technology, and use specific sensors. The data access criterion means that sensor data can be accessed, collected, manipulated, processed, evaluated and interpreted. This does not necessarily mean that the sensor data themselves have to be collected and stored by an NSI, it may as well be that e.g. farmers grant access to their sensor data, and that the requested data are calculated and submitted. The quality criterion originates from the statistical objective to produce accurate (i.e. unbiased and precise) statistics [5], and to be able to compare statistics between persons or companies and in time. Sensor accuracy is the equivalent of survey accuracy, and sensor data should be evaluated on equivalent error sources, as defined in the Total Survey Error Framework [24, 25]. For instance, location data can be used to establish the position of fields but are subject to missing data, measurement errors, sensor data drift and potentially also device effects. The final criterion refers to costs associated with the development and implementation of new data collection processes using sensor data.
From the respondent (farmer) point of view, sensors may vary in their intrusiveness. Four criteria follow:
Willingness: Businesses are willing to consent to provide access to or share the sensor data; Data ownership: Businesses can retrieve, revise and delete sensor data on demand, i.e. they have ownership and control over the data; Burden: Businesses are willing to devote the effort needed to grant access, collect and handle the sensor data (as compared to the burden that comes with completing of business survey questionnaires); Feedback: Businesses may retrieve useful knowledge about themselves from their sensor data in connection to statistics.
In order to employ sensors, businesses need to be asked for consent to grant access to sensor data, or activate sensors and to store and send data. Even without the technical necessity to ask for consent, there are legal and ethical reasons why consent is imperative. Willingness to consent varies per type of sensor and depends on the context and purpose of the measurements. Sensor data can be collected passively or actively. Sensor data are collected passively when there is no respondent intervention or feedback, apart from consent. This is the case when sensor data are collected directly from a central data hub. In active sensor data collection, respondents are asked to check, revise, accept and/or supplement sensor data, i.e. the respondent (the farmer in our case) is involved in the data collection. Motives for active sensor data collection are increased willingness to provide the data, increased data quality and hybrid forms of survey and sensor data: the data may also be shown to respondents for quality checks and for enrichment of sensor data. Finally, the sensor data may be fed back to businesses in an aggregated form and may provide them with valuable benchmarking information.
Combining our experiences and the results from the data use case and these above criteria, we can now define a number of methodological challenges with regard to the use of sensor data as a source for official statistics. In addition, relevant papers on precision farming have been checked to validate and supplement these challenges.
Methodological challenges
Utility of the sensor data
From the survey quality-costs perspective, we can argue that for the agricultural surveys (as included in our data use case) the response burden would be substantially lower if the data could be collected using the existing sensor data instead of the farmers having to fill in the entire questionnaires. For the second criterion, centrality, it depends very much on the data requested, but in general farmers do not see any value in completing questionnaires, as can be concluded e.g. from a Crop Protection Survey questionnaire pre-test [46]. Calculating the requested data based on existing data (in FMISs) and sensor data would help to overcome this challenge.
The third criterion is conceptualisation. This is an important aspect of the use of sensor data since we are dealing with secondary data. The question is: are the data actually correlated with the concepts for which statistics are to be produced? This relates to validity of the data [24, 25]. In our case study we found that the most promising data source was the CRS/FMIS, since there is the greatest overlap in variables in both the questionnaires and the CRS. However, for every concept for which statistics are to be produced, a detailed analyses of concept definitions and their relationship with available sensor data needs to be carried out.
In our case study we used the farmer’s data platforms to study the overlap between the data in these platforms and data that is asked for in the questionnaires. The first criterion from the sensor data collection perspective was omnipresence (coverage). It is obvious that coverage and representativity is an important criterion to utilize PA sensor data as input for official statistics for the agricultural sector. The utility of PA data therefore depends very much on the market penetration. A study conducted by the Rabobank [51] in the spring of 2020 shows that this still is limited to 10–15% of arable farmers, but depends on the PA technology. About 50% of the farmers use Crop Registration Systems (CRS/FMIS). Estimates of the penetration of different PA technologies is summarised in Table 1. (For this survey, a sample of 2650 Rabobank customers active in arable farming were contacted, 233 (8.7%) responded.)
Precision farming technologies penetration in Dutch arable farming (
233)
Precision farming technologies penetration in Dutch arable farming (
Source: [51].
The costs involved in buying this innovative technology, the lack of needed skills and realisation among farmers to use the data for daily practises, issues of data ownership and trust, and farm size, among other reasons, put a limit on the coverage [42, 49, 51]. (A detailed overview of challenges with regard to the adoption of PA is presented by Bacco et al. [2] and Delgado et al. [16]). Therefore, we feel that for the moment standardized FMIS are a more interesting source than PA systems. The second sensor quality-cost criterion we discussed was data access. In Section 3.3 we will discuss a number of methods to collect or get access to these data. This in turn affects costs for NSIs.
Data quality is a very broad concept and includes e.g. measurement errors, unit and item non-response, and representativeness [24, 25]. In terms of sensor data quality one can additionally think of repeatability (the dispersion between consecutive measurement obtained from a given sensor), reproducibility of the measurements with different sensors, stability of the sensor, and data drift (the capability of the sensor to maintain its performance characteristics over a sufficiently long time) and limit of detection (the lowest concentration of a substance that can be significantly differentiated from zero concentration) [39]. An attempt for a sensor data quality framework from an official statistic perspective has been made by Beinhauer [6].
An important aspect of data quality is the definition of the data: the availability of metadata. Good and complete metadata is vital for the interpretation of the data. As we have seen in our study, the meta data was poorly documented. In a study on big data issues for use in agro-environmental science, Lokers et al. [33, p. 499] come to the same conclusion: “… datasets often are not documented with appropriate metadata.” Furthermore, they state that data consumers “… should have trust in the reliability and correctness and completeness of associated metadata.” In a discussion on the main functional requirements for farm software ecosystems, Kruize et al. [31] mention smooth data handling and seamless data exchange between ICT components as the first requirement: to enable the re-use of data, metadata are needed.
Finally, from the respondent perspective, we identified willingness, data handling, burden, and feedback. Willingness is linked to privacy issues, data sensitivity and data ownership. In our use case the farmer was willing to share his data with CBS. However, this was not automatic and many meetings were needed to enable the data access and develop trust through a common business case between the farmer, CBS and the university of Eindhoven. It is very important that the farmer has ownership of the data, not only to handle the data himself for his own purposes but also to determine what happens with the data when shared with other parties as some of the data of a farmer is very sensitive. While CBS will never share microdata with regulatory institutions, trust and respect for privacy and security are extremely important in the negotiations with the farmers. Furthermore, a debate is going on with regard to data ownership: whether the data that are generated at the farm belong to the farmer or the manufacturer of the sensor equipment (see e.g. [10] and [34] for a discussion.)
Existing sensor data do not represent a burden from the respondent perspective. An important part of developing a good relationship and trust with the farmer (business owners) is to address their question: “what is in it for me?”. Providing feedback on the data analyses and results is one way of addressing this question. In our discussions with farmers and farming organisations [46], this question was coming back again and again, indicating the importance of closing the data circle and giving feedback to farmers. The question would be: what kind of information would be of relevance to farmers? This was however not addressed in our study.
Under the assumption that many farmers will start using precision farming, and omnipresence is guaranteed, there probably will be a diversity in sensors and machines used. Each farmer will use its own equipment and machines produced by multiple manufactures. Consequently, the data that are being generated, is very likely to be structured and defined differently. It is therefore important with the goal of statistics in mind that the data are harmonised. Insights from the business case indicate that the CRSs have developed their own data format and standards that facilitate easy data exchange which speaks in favour of using the systems as a data source for future official statistics.
Above we mentioned that the adoption rate of PA is still low, and we listed a number of reasons. An important additional reason is this lack of data harmonisation. Even though data are considered essential in PA [2], according to Delgado et al. [16, p. 5] “… the variety of data formats, velocity of data coming off of a variety of platforms, and volume of data have led to a fragmented and siloed data management infrastructure for agriculture”. Also Lokers et al. [33, p. 499], in a study on data usability in agro-environmental science, mention that “a lot of data is still stored in silos”, and indicate that “interoperability has to be targeted”. Interoperability and harmonisation is mainly needed to increase the business case for stakeholders such as NSIs when farmers start using modern agricultural data technology and get the machinery for it. For the farmer, harmonised data is a precondition for S2S data exchange between the systems he uses, as such reducing the burden to use his data and creating more data value [31, 33].
Data collection systems, IT infrastructure and costs
With the growing availability of PA sensor data, integrated in FMISs, and having overcome the challenges as discussed above, more modern data collection methods become feasible, like S2S data collection, or Electronic Data Interchange (EDI) (see Buiten et al. [8] for a discussion on EDI). This can be implemented in various ways:
Starting with surveys, we can link electronic questionnaires to the farmer’s database, extract the required data, calculate the requested data and fill in those numbers in the questionnaire. Alternative ways would include the uploading of e.g. csv files in the questionnaire, which have been extracted from the farmers FMIS [46]. The farmer would still have control over his data, as the filled-in/uploaded answers can be checked and finally submitted. This would still be a sample-based primary data collection method. Moving away from the questionnaire, we could get access to farmer’s databases directly. This would need specific software with the farmer’s consent and trust. In this way, an NSI could extract the required detailed data on a continuous basis. This could be sample-based or could cover the entire population of farmers making use of (PA extended) FMISs. If PA data is omnipresent, the data collection process turns into integral observation [8]. Another solution would be to connect to data hubs or cloud solutions from e.g. agricultural machine producers, like John Deere and CNH, using APIs [35, 40, 45]. These data sources store data from many farmers. Now, we are moving away from primary data collection and going into secondary data collection.
We will return to these options in the discussion.
Depending on the developments in the agricultural sector, investments in a chosen data collection solution need to be worthwhile. Once all of the above has been dealt with, we also need to include the time dimension: statistics are especially useful when published over time. Therefore, it is of the utmost importance that the data delivery is constant and consistent over time, so time series can be produced.
Assuring the interconnectivity and interoperability between all stakeholders through all steps in an integrated business data chain [8], and depending on the applied data collection method(s), technical standards that are easily and widely accepted, have to be put in place. In the role of stakeholder, for NSIs it’s important to see the potential and establish the statistical output using agricultural sensor data. NSIs can then set the requirements and develop (or stimulate the development of) systems that make it possible to process and filter data on the fly during the data collection process. Data can be treated at farm or field level, reducing drastically both the IT costs associated to the storage and possible big data capacity issues. Both businesses as well as an NSI need to invest in these intelligent systems.
Conclusions and discussion, and next steps
Conclusions and discussion
The aim of our research was to address two research questions with regards to the use of existing PA data in farm businesses for official statistical purposes:
Are these data source fit for purpose with regard to replacing (parts of) agricultural survey questionnaires by these data? And if so, how can these data be collected: can PA data be collected without using questionnaires, or can the data be used to automatically complete (parts of) a questionnaire? Which quality and utility criteria can we develop to assess the use of sensor data for official statistics?
In this paper, we discussed the first research question by investigating whether sensor-generated PA data could be used to (partly) substitute surveys, with a focus on data collection and data quality issues. This question was examined in the context of precision agriculture and sensor data of one innovative arable farmer was used. The aim of this data use case was broadened as we looked into the data infrastructure at this farm and general FMISs used by farmers in the Netherlands.
It was found that the generated PA data from our farmer are stored in two different platforms: a PA-specific system (called DIPPA) and a CRS (or FMIS). The first system is tailored to the needs of the farmer and houses most of the PA data. An initial exploratory analysis of this platform showed that parts of questionnaires can be completed using these data, while other parts still have to be completed manually. Questions about the area of the farm and the harvest estimate can be filled in to a large extent, but the sections on planting, fertilization and the number of employees can only be partially answered. Financial information requires a completely different data source. It was concluded that parts of the sensor data are matching with some of the concepts and data asked for in the agricultural survey questionnaires.
In addition to the PA-specific data system, we also investigated the farmer’s CRS. This is the FMIS that houses the more traditional information about farm activities. FMISs are used by many farms in the Netherlands. In the system it is possible to import, save, interpret and share data about the fields. These systems can be entered manually as well digitally via farm machines. We found that these systems showed the most overlap with the agricultural survey questionnaires. These include sections about field and crop registration, pesticide use, fertilization and harvesting. Due to the limited number of used systems in the Netherlands there is some standardisation; data harmonisation by EDI-Crop [23] is supported by these systems. At the moment these FMISs may be a better source to investigate than farmer specific data systems. A pre-test study for the redesigned 2020 Crop Protection Survey questionnaire confirmed this conclusion [46].
With regard to the second research question we looked into utility criteria for the use of sensor data and other challenges that need to be taken into account when assessing the fitness for purpose of this data source in the context of official statistics. These included getting access to the data, data ownership, omnipresence and market penetration, IT infrastructure, standardisation, costs, data harmonisation and interoperability. From this small-scale data use case study we concluded that still much has to be improved to use these sensor data. Precision Agriculture data offers potential as input for official agricultural statistics but the fruit is not hanging so low as we thought! The question arises if NSIs should take a more active stance as stakeholders by communicating closely with farmers and other stakeholders (like FMIS developers, PA machine producers offering cloud solutions).
CBS has defined an innovation strategy with a clear focus on making policy-relevant statistics based on new methods and new data sources. Sensor data offer potential. For an NSI the challenges lie in data access to privately owned data, concept validation, data quality, data harmonisation and interoperability. In order for sensor data to be of any use, these issues still need to be addressed in order to use sensor data as a data source for official business statistics. As long as PA technology is not widespread in many parts of the farming sector (except for horticulture), there is still a chance to influence these new data systems and processes. The role of an NSI in these emerging data infrastructure systems could be, through and in close collaboration with software and IT developers, to set the requirements for standardisation and harmonisation, consider new technical options such as edge computing (pushing computation out), assist in the analysis and processing of the data, enrich the data with relevant statistical information based on other data sources, and develop new statistics that address policy and users’ needs.
Next steps
In the short-term the most promising data sources are sensorized agricultural machinery data and FMIS data. Based on the data use case and the literature review we have identified a number of next steps. The future work consists of three pillars with regard to innovating data collection for agricultural statistics:
Scouting and following of data infrastructure projects within the agricultural sector. Development of data collection method to automatically collect PA data from farmers. Exploration of FMISs as a possible data source for official statistics.
Above we concluded that CBS should not stand aside with regard to new data solutions, but should be actively involved as a stakeholder. We have learned that many data infrastructure projects in the agricultural sector have been initiated. We also mentioned open data sources (like big data) as a source for agricultural statistics [1, 50] but these were out of scope of our data use case study.
Innovating agricultural data collection also entails collection of PA data from individual farmers using APIs. Some of the main manufacturers of precision arable farming machines in the Netherlands (John Deere, CNH Industrial, and Claas) provide access to their clouds through software interfaces (Application Programming Interfaces, APIs [40]). These clouds are promising data sources because they store detailed PA data about field operations, machine data, agronomic service providers activity, soil conditions and environmental conditions, as we have seen. For a proof of concept of this S2S architecture applied to agricultural surveys, we refer to Snijkers, Gómez Pérez and De Broe [45].
Above we have concluded that FMISs are a good source for data that are asked for in official surveys. We will further investigate the applicability of these FMISs for statistical purposes. This includes a more detailed exploration of the FMIS data contents and IT systems, aimed at the development of S2S data communication tools.
The demand for information is obviously wider than the information that surveys are designed for and aim to collect. In order to fully assess the potential of PA data, one would need to investigate whether the current surveys sufficiently address current policy issues and questions with regards to sustainable farming and natural capital. For these phenomena new indicators are required where PA data offer possibilities.
Footnotes
Acknowledgments
The work presented in this paper is an internship project at Statistics Netherlands by Tim Punt (Maastricht University, currently employed by De Nederlansche Bank, the Dutch National bank, Amsterdam), and was carried out in collaboration with Jeldrik Bakker and Ralph Meijers (CBS). The authors are grateful to Prof. Dr. J. de Vlieg (Eindhoven University of Technology) for his support in this project, and an arable farmer for providing the data. The authors like to thank three reviewers and Joep Burger (CBS) for reviewing a draft of this paper.
This study has been presented at the 2019 UNECE Workshop on Statistical Data Collection ‘New sources, New technologies’ 14–16 October 2019, Geneva, Switzerland [37], and the 2019 ESS Workshop on the use of administrative data for business, agriculture and fishery statistics, 17–18 October 2019, Bucharest, Romania [![]() ].
].