
Abstract
Coronavirus disease 2019 (COVID-19) has been considered a global threat spreading to Nigeria and posing major public health threats and concerns. This led to the introduction of internationally acceptable non-pharmaceutical interventions (NPI) such as lockdowns, social distancing, and mandatory use of face masks by the Nigerian government to curtail the disease. This study aims to develop an Autoregressive Integrated Moving Average (ARIMA) model to predict COVID-19 cases vis Total Confirmed Cases (TCC) and Total Discharged Cases (TDC) in Nigeria based on the daily data obtained from the Nigeria Centre for Diseases Control (NCDC) from 27
Introduction
The new SARS-COV2 virus which causes COVID-19 now a pandemic comes with its unique challenges for public health and policy workers limiting the ability to plan appropriately for interventions that could limit its spread, prevent new transmission, and reduce both mortality and mortality effectively. Since reports of the first cases in late December 2019 in Wuhan, China, the COVID-19 virus has rapidly spread across many countries raising major global concerns [1, 2].
In Nigeria, the first case was reported on the 27
However, to address the uncertainties around the nature of this disease outbreak in terms of spread, various mathematical models were employed to provide guidance. The application of mathematical models to disease surveillance data can be used to address both scientific hypotheses and disease-control policy questions in short and long-term disease forecasts.
In the past years, studies have shown the use of different statistical methods like multivariate linear regression [6], simulation-optimization [7], generalized growth model, and generalized logistic model [8], and grey model on epidemic and pandemic cases to predict their occurrence [9]. However, random factors such as vaccination skepticism, complex dynamic processes behind infections on both small and large scales, and lack of synchronization between population, reduce the likelihood of pathogen eradication on a global scale. In addition, as long as migration is allowed in some form that is common with epidemic and pandemic data, these methods of modeling are inadequate for analyzing outbreak data [10].
To address these limitations, other studies have used SIR, SEIR models to analyzed and predict COVID-19 data, and these models mostly depend on complex statistical methods [11, 12]. A Susceptible Exposed Infection and Recovered (SEIR) model was used to both predict the trend of COVID-19 in China and to provide pandemic prevention approaches which helped in the decision making [1, 13]. The Least square method of SEIR and Poisson were compared with the results showing that the COVID-19 will not end quickly in Japan [14] and other related work on the SEIR model [15]. In Nigeria, various models such as Poisson and Negative binomial [3], ARIMA, Prophet, and Holt-Winter ES models [4, 5] were used to estimate and predict the number of confirmed, discharged, and deaths cases of COVID-19.
The challenges with forecasting the dynamics of health events have been widely published as stated above with the Autoregressive Integrated Moving Average (ARIMA) model of those in use for forecasting accuracy. This model is formed by merging two models, the autoregressive (AR) model and the moving average (MA) model. These models can deal with the stationary behavior of the series cases and non-stationary cases via differencing to make it stationary [16]. The ARIMA model has been used to predict confirmed, recovered, and death cases. In Italy, an ARIMA model was used to predict COVID-19 data, improved by updating the data set to show how consistent the prediction was with the actual spread [17]. Other few related works on COVID-19 using ARIMA models were done in Italy, and India [1, 2, 10, 18]. The reliability, and accuracy of the model were based on the Autocorrelation factor (ACF), and Partially autocorrelation factor (PACF).
Methods
The ARIMA model is an extension of autoregressive AR(p), moving average MA(q), and ARMA(p,q) models. The letters p, d, and q correspond to order of autoregression, degree of difference, and order of moving average. They generally represented an ARIMA model as ARIMA(p,d,q). The general formula of AR(p) and MA(q) models can be expressed as in Eqs (1) and (2) respectively.
Here
We aimed to develop a time series forecasting model for COVID-19 cases using total confirmed cases (TCC) and total discharged cases (TDC) in Nigeria from 27
Public published data were obtained from the official website of the Nigeria Centre for Disease Control (NCDC) (
Step by steps ARIMA modeling
The 4 critical steps in ARIMA modeling were applied to forecast the possible number of total confirmed cases and discharged cases over the next three months (estimated calendar date).
In step 1, the stationarity of the confirmed and discharged cases were checked using a time series plot of the observed values with the corresponding time (days), and were it not stationary, a transformation technique was applied. ARIMA model is one of Box and Jenkin’s models where stationarity is one of the assumptions. Stationarity means constant mean and variance, if the series is not stationary, the result of the forecast will be misleading. The transformation helps to reduces the variation in the series by making the data smooth using the forward difference, i.e. first-order difference.
In step 2, the autocorrelation (ACF) and partial autocorrelation (PACF) plots of the stationary time series (statistical properties such as mean, variance, autocorrelation, etc. are all constant over time) were done and the order of lag (days) of the AR and MA models were determined for the confirmed and discharged cases.
In step 3, Akaike information performance criteria measures were applied to estimate the parameters for the good fit model and in step 4 the future values were forecasted using the good fit model
Results
A total of 12495 and 3959 confirmed and discharged cases respectively were obtained. The mean confirmed cases were approximately 123 per day and the mean discharged cases were approximately 39 per day. The maximum number of confirmed cases recorded were 553 while discharged cases were 206 per day as described in Table 1.
Summary statistics of confirmed and discharged cases of COVID-19 in Nigeria
Summary statistics of confirmed and discharged cases of COVID-19 in Nigeria
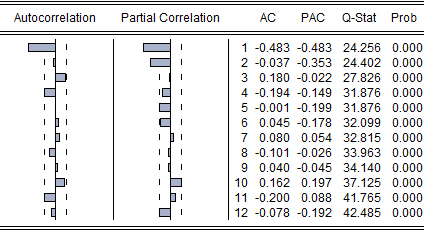
ACF and PACF on confirmed cases of COVID-19
Time series analysis (critical step 1) showed exponential growth, as the number of confirmed cases increased daily, so the number of discharged cases also increases from 2
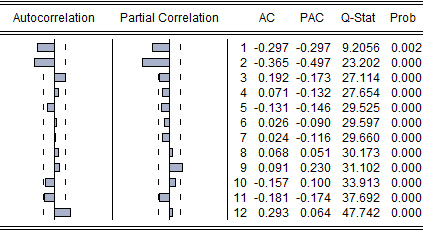
ACF and PACF on discharged cases of COVID-19
ARIMA (2,1,1) model on confirmed cases
Non-Stationarity plot of Confirmed and Discharged Cases of COVID-19 in Nigeria from the period of 27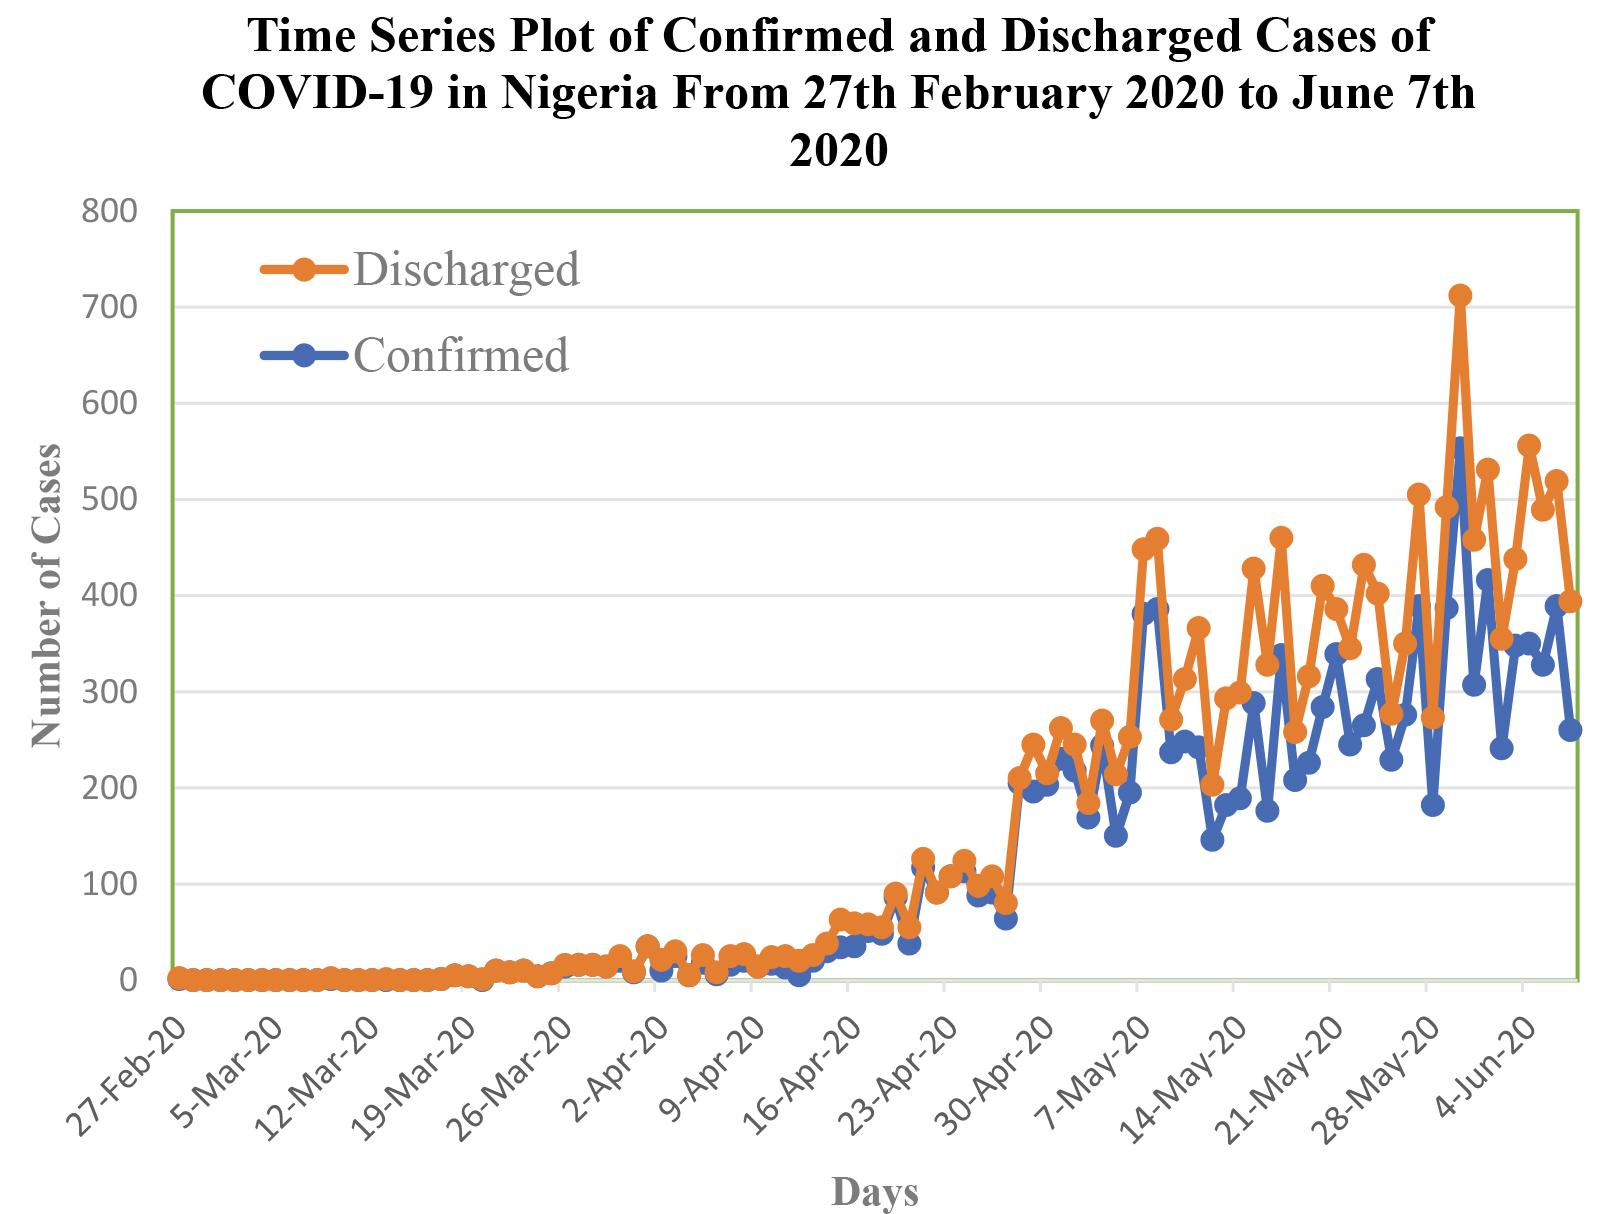
Since the ARIMA modeling requires a stationary series, a transformation on the observations were done with the first-order difference operation (a technique for numerical differentiation) based on the logarithmic sequence as shown (Fig. 2). This resulted in the time series to be stationary at the first-order difference (i.e.
Construction of the ACF and PACF
With the appropriate ARIMA model selection depend on the ACF and PACF of the stationarity time series obtained from the criteria of stationarity (Fig. 2), the ACF and PACF were tested for 12 lags to determine the appropriate model for confirmed and discharged cases of COVID-19.
Stationarity plot of Confirmed and Discharged Cases of COVID-19 in Nigeria from the period of 27
The ACF display one spike and the PACF displays two spikes (Table 2) resulting in the selection of the ARIMA (2,1,1) model for confirmed cases of COVID-19, and ARIMA (2,1,2) model for discharged cases as a result of the ACF displaying two spikes, and the PACF also displaying two spikes as seen in Table 3.
Based on the ARIMA model established above, the ARIMA (2,1,1) model was constructed to fit the transformation sequence of the confirmed cases as shown in Table 4, and the model was significant for most parameters at 0.05 and also the ARIMA(2,1,2) model was constructed for discharged cases as shown in Table 5 with significant parameters at 0.05.
ARIMA (2,1,2) model on discharged cases
ARIMA (2,1,2) model on discharged cases
A 95% confident interval forecast is shown in Figs 3 and 4 below for the confirmed and discharged cases of COVID-19 for the next 200 days starting from 8
200 days forecast for confirmed cases of COVID-19.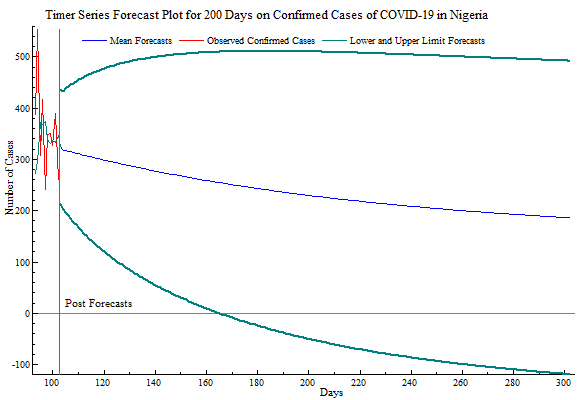
200 days forecast for discharged cases of COVID-19.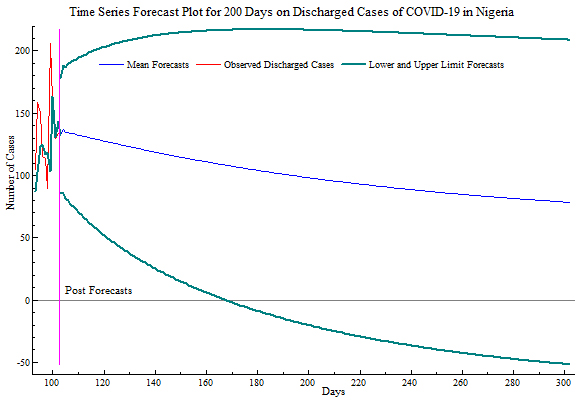
In this study, we predicted the number of new cases of COVID-19 in terms of confirmed and discharged cases using the ARIMA model. The results showed that there would be an increasing trend in the number of new cases in the following days. And starting from June 8
The forecast obtained using the ARIMA model can be used to guide management of the pandemic as there was an observing decrease in the forecasted cases with the containment interventions. Repeating the model at targeted 21 days periods alongside the various interventions will provide information that can be beneficial in managing the pandemic.
Footnotes
Acknowledgments
We kindly thank the NCDC for access to this publicly available data.