
Abstract
The COVID-19 pandemic has presented unprecedented challenges to global healthcare systems, underscoring the critical need for accurate prediction of infection cases to facilitate effective resource allocation and decision-making. This study evaluates the performance of two widely used time-series forecasting models, ARIMA and LSTM in predicting COVID-19 infection trends. Using a dataset of daily infection cases spanning January 2020 to June 2020, both models were trained and evaluated. The results demonstrate that the LSTM model achieves superior performance compared to the ARIMA model, as evidenced by lower Mean Absolute Error (MAE) and Mean Squared Error (MSE). The LSTM models ability to capture complex patterns and non-linear relationships in the data contributes significantly to its enhanced predictive accuracy. These findings highlight the potential of LSTM models to deliver more reliable forecasts of COVID-19 infection cases, providing healthcare authorities with valuable insights to inform strategic planning and preparedness for future outbreaks.
Introduction
The COVID-19 pandemic has been one of the most disruptive global health crises in modern history, with over 700 million confirmed cases and 6.9 million deaths reported by the World Health Organization (WHO) as of May 2024 (Benvenuto et al., 2020) World Health Organization (WHO) (2020). Governments and health organizations worldwide have struggled to predict infection waves, allocate medical resources, and implement timely interventions due to the virus’s unpredictable transmission dynamics. Traditional epidemiological models, such as compartmental SIR (Susceptible-Infectious-Recovered) models, rely on assumptions about disease parameters (e.g., reproduction number R0) that often fail to capture real-world complexities like new variants, vaccination rates, and human mobility patterns (Borges and Nascimento, 2022) Centers for Disease Control and Prevention (CDC) (2020). However, such models often falter when faced with real-world complexities, including abrupt policy changes, super spreader events, and evolving virus variants. In contrast, time-series forecasting techniques offer a data-driven alternative, utilizing historical case data to predict future trends without relying on explicit biological or social assumptions. This adaptability makes them particularly suited to dynamic and rapidly changing environments like the COVID-19 pandemic. The unpredictability of COVID-19 transmission dynamics driven by factors such as viral mutations, vaccination rates, and non-pharmaceutical interventions (NPIs) has complicated traditional epidemiological modeling (Borghi et al., 2021). Early-stage forecasts relied heavily on compartmental models (e.g., SIR, SEIR), which require assumptions about parameters like transmission rates and recovery periods (Box et al., 2015). However, these models struggle with real-world noise and abrupt shifts in trends (e.g., lock-downs, new variants). Time-series approaches, in contrast, leverage historical data to infer future trends without explicit mechanistic assumptions, making them adaptable to rapid policy changes. ARIMA, a classical linear model, has been extensively used in epidemiology due to its interpretability and robustness for stationary data (CDC, 2020). However, its performance degrades when handling non-linear patterns or long-term dependencies (Chaurasia and Pal, 2022). Conversely, LSTM, which is a type of recurrent neural network (RNN), excels at capturing complex, non-linear relationships in sequential data, as demonstrated in recent studies on influenza and dengue fever forecasting (Ge et al., 2022).
This research focuses on analyzing the temporal patterns of COVID-19 in India by evaluating and comparing the performance of two prominent time-series forecasting models:
Literature Review
Hanif et al. (2023) proposes a simple econometric model, Auto Regressive Integrated Moving Average (ARIMA), to predict the spread of COVID-2019. It uses Johns Hopkins epidemiological data to predict the prevalence and incidence trends. The model is subject to potential bias, and real-time case definition and data collection are necessary for future comparisons and comparisons. Hochreiter and Schmidhuber (1997) assesses models like ARIMA, SVR, LSTM, and Bi-LSTM for time series prediction of confirmed cases, deaths, and recoveries in ten major countries affected. The Bi-LSTM model outperforms in terms of endorsed indices, with the lowest MAE and RMSE values for deaths in China. The best r2score value is 0.9997 for recovered cases in China. Bi-LSTMs robustness and enhanced prediction accuracy make it suitable for pandemic prediction, improving planning and management. Kumar et al. (2020) compares five deep learning methods for forecasting COVID-19 cases, including Recurrent Neural Network (RNN), Long Short-Term Memory (LSTM), Bidirectional LSTM, Gated Recurrent Units (GRUs), and Variational Auto-encoder (VAE). The results show promising potential for the deep learning model and superior performance of VAE compared to other algorithms, based on daily confirmed and recovered cases from six countries. Mahmud et al. (2025) applied a two-stage method using LSTM and Prophet models on data from the municipality of São José dos Campos. Although the models were not verified using benchmark data sets, they presented a Prophet-LSTM ensemble approach that performed better than benchmarks. MAE=0.99 was the stated performance metric. Mostafiz et al. (2022) analyzed 6406 photos from many sources to diagnose COVID-19 and chest infections using a region-based convolutional neural network (R-CNN) and generative adversarial network (GAN) for data creation. With the use of GAN-generated data, R-CNN performed better than conventional techniques. Neither benchmark data sets nor hybrid models were investigated in this study.
Summary of Forecasting Studies Including Datasets, Methods, Findings, and Limitations.
Summary of Forecasting Studies Including Datasets, Methods, Findings, and Limitations.
Despite extensive research on COVID-19 forecasting using statistical and deep learning models, notable gaps persist in existing literature. Many studies apply either ARIMA or deep learning approaches independently, while hybrid or comparative analyses often lack methodological consistency, such as uniform preprocessing, identical datasets, and standardized evaluation metrics. Several works focus primarily on short-term forecasting, offering limited insight into model performance over extended horizons where prediction uncertainty increases. Moreover, prior studies frequently emphasize accuracy metrics without examining how model effectiveness degrades over time or how well models capture non-linear dynamics and abrupt changes inherent in pandemic data. Additionally, comparisons are often conducted across different regions, datasets, and time spans, making direct performance evaluation challenging. Few studies provide a systematic, multi-horizon comparison of classical statistical models and deep learning techniques under controlled experimental conditions. These limitations highlight the need for a comprehensive and consistent comparative framework to evaluate ARIMA and LSTM models across short-, medium-, and long-term forecasting horizons using robust error metrics.
ARIMA Model
One of the most popular methods for analyzing time series is the Auto Regressive Integrated Moving Average (ARIMA) technique. The evolving variable is regressed on its own prior values, according to the AR portion of the ARIMA model. The variance of a stationary time series is represented by 
Here, 
By combining the AR(
If the time series is non-stationary, differencing can be applied 
The general ARIMA(
The value of 
A machine learning approach with a recurrent neural network architecture is called long-short term memory (LSTM). As a model, it retains the knowledge acquired over a brief period of time and applies it to training over an extended period of time. Thus, “memory blocks” are units found in the hidden layer of long short-term memory. Traditionally, recurring neural networks use these memory blocks as hidden units. The memory blocks include one or more memory cells. Input and output ports are present in every memory block to regulate the information flow. The output doors regulate the flow of output activation information in the memory cell, whereas the input gate regulates the flow of input activation information. The memory blocks were later modified to include a “forget gate.” Prior to the input activation through the cell’s repeated link, the forgetting gate resets the cell’s memory and scales its internal state ?. Examining the model’s steps is necessary to gain a better understanding of the LSTM model. The network to be built must first reset the output from the preceding model at time 
The information to be stored in the cell is determined in two steps. First, the input gate decides which values to update, and then a candidate vector 

The new cell state is then computed as:

Finally, the output gate and the new hidden state are obtained from:


Here,
This section provides an in-depth overview of the dataset utilized for the analysis, outlining its source, structure, and any relevant characteristics
Dataset and Data Pre-processing
Dataset
The dataset used in this study comprises daily confirmed COVID-19 case data in India, sourced from the COVID-19 India API. The time spans from 1st March 2020 to 31st December 2021, covering a total of 670 days, and includes two key features: daily confirmed cases and cumulative confirmed cases. Daily confirmed cases reflect the number of new COVID-19 cases reported each day, which are crucial for capturing temporal fluctuations, trend shifts, and epidemic wave patterns Cumulative confirmed cases represent the total number of reported infections up to each date, useful for validating overall trends and assessing long-term progression. A COVID-19 API is a web-based tool that gives users extensive access to information on the COVID-19 pandemic. This service is an essential resource for developers, academics, healthcare professionals, and the general public who want to comprehend the pandemic’s changing environment. A COVID-19 API can provide a number of data needed to monitor the virus’s progress and effect. Key data elements often include total cases, vaccination rates, state and country-specific breakdowns, historical trends, and daily updates.
The dataset spans from 1 March 2020 to 31 December 2021, comprising 670 daily observations. During this period, daily confirmed cases increased from 1 to 16,764, while cumulative cases rose to approximately 34.8 million.
Data Pre-processing
Before model deployment, a sequence of pre-processing operations was performed to guarantee the reliability, consistency, and appropriateness of the dataset for time-series forecasting.
Missing Values Handling: The completeness check in the data set identified five missing daily observations, representing approximately 0.7%of the total records. To ensure temporal continuity and prevent distortions in the learning process, these missing values were filled by linear interpolation. This was adopted due to its simplicity and efficiency in dealing with small gaps in sequential data.
Stationarity Assessment: Stationarity is one of the key assumptions in ARIMA modeling. To determine this, the Augmented Dickey-Fuller (ADF) test was run on the raw time series of each day’s confirmed cases. The
Train-Test Splitting: To assess model performance on previously unseen data, the dataset was split into a training subset and a testing subset according to an 80:20 temporal ratio. The period for training comprised from 1st March 2020 to 30th September 2021 (536 days) and that of testing comprised from 1st October 2021 to 31st December 2021 (134 days). The temporal split ensures that the data remains in chronological order, as this is imperative for time-series modeling, and permits rigorous evaluation of the accuracy of forecasts.
Normalization for LSTM Modeling: recurrent neural networks, and specifically LSTM models, are vulnerable to the input feature scale. To facilitate better model convergence and predictive performance, the values of daily confirmed cases were normalized by applying Min-Max scaling to map all the input features into the range [0, 1]. The normalization was applied solely to the LSTM model utilizing the MinMaxScaler tool in the scikit-learn library. The scaling parameters were computed using only the training data to prevent information leakage into the test set.
Model Building
ARIMA Model
The first step of the ARIMA model involved choosing parameters of the model. The partial autocorrelation function (PACF) plot revealed a cutoff at lag 2, indicating the requirement for two auto-regressive (AR) terms, resulting in a choice of
LSTM
The architecture of the LSTM model was tuned to process time series data with a look back period of 14 days. The input shape of the model was set to (look back
Performance Evaluation
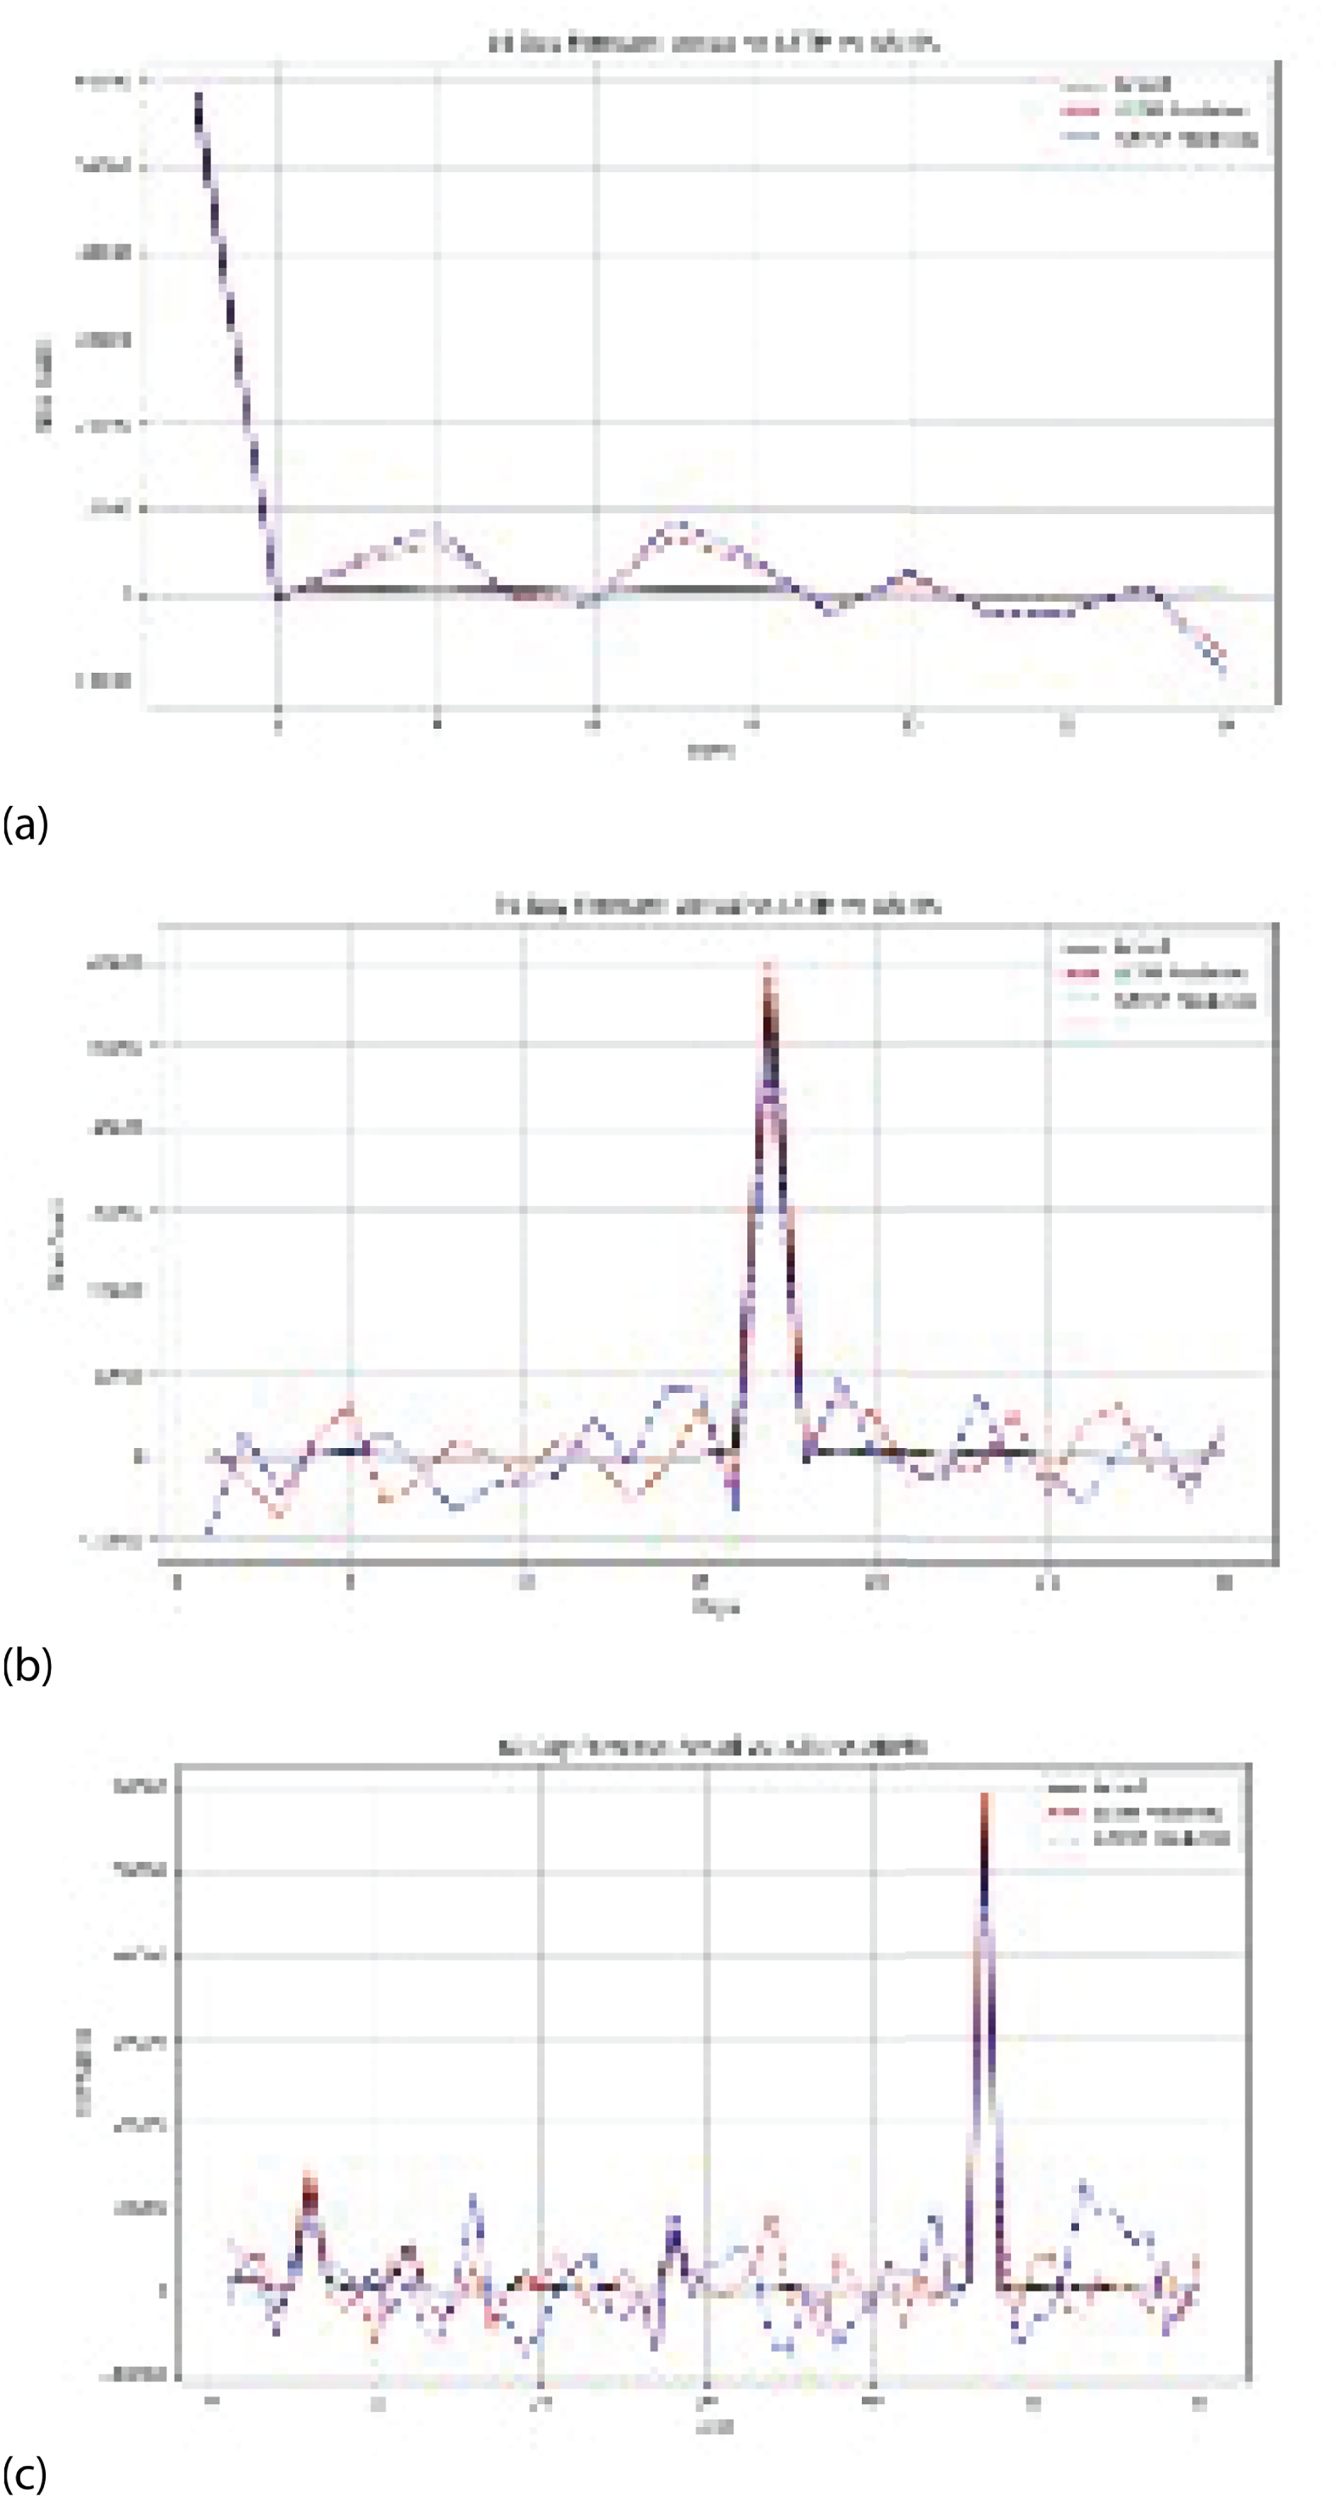
The performance models are evaluated using Root Mean Square Error (RMSE), Mean Absolute Error (MAE), Mean Square Error (MSE), and
Mean Absolute Error (MAE): MAE measures the average magnitude of the errors between the predicted and actual values without considering their direction. It is the average over the test sample of the absolute differences between prediction and actual observation. It is defined mathematically as:

I & Results
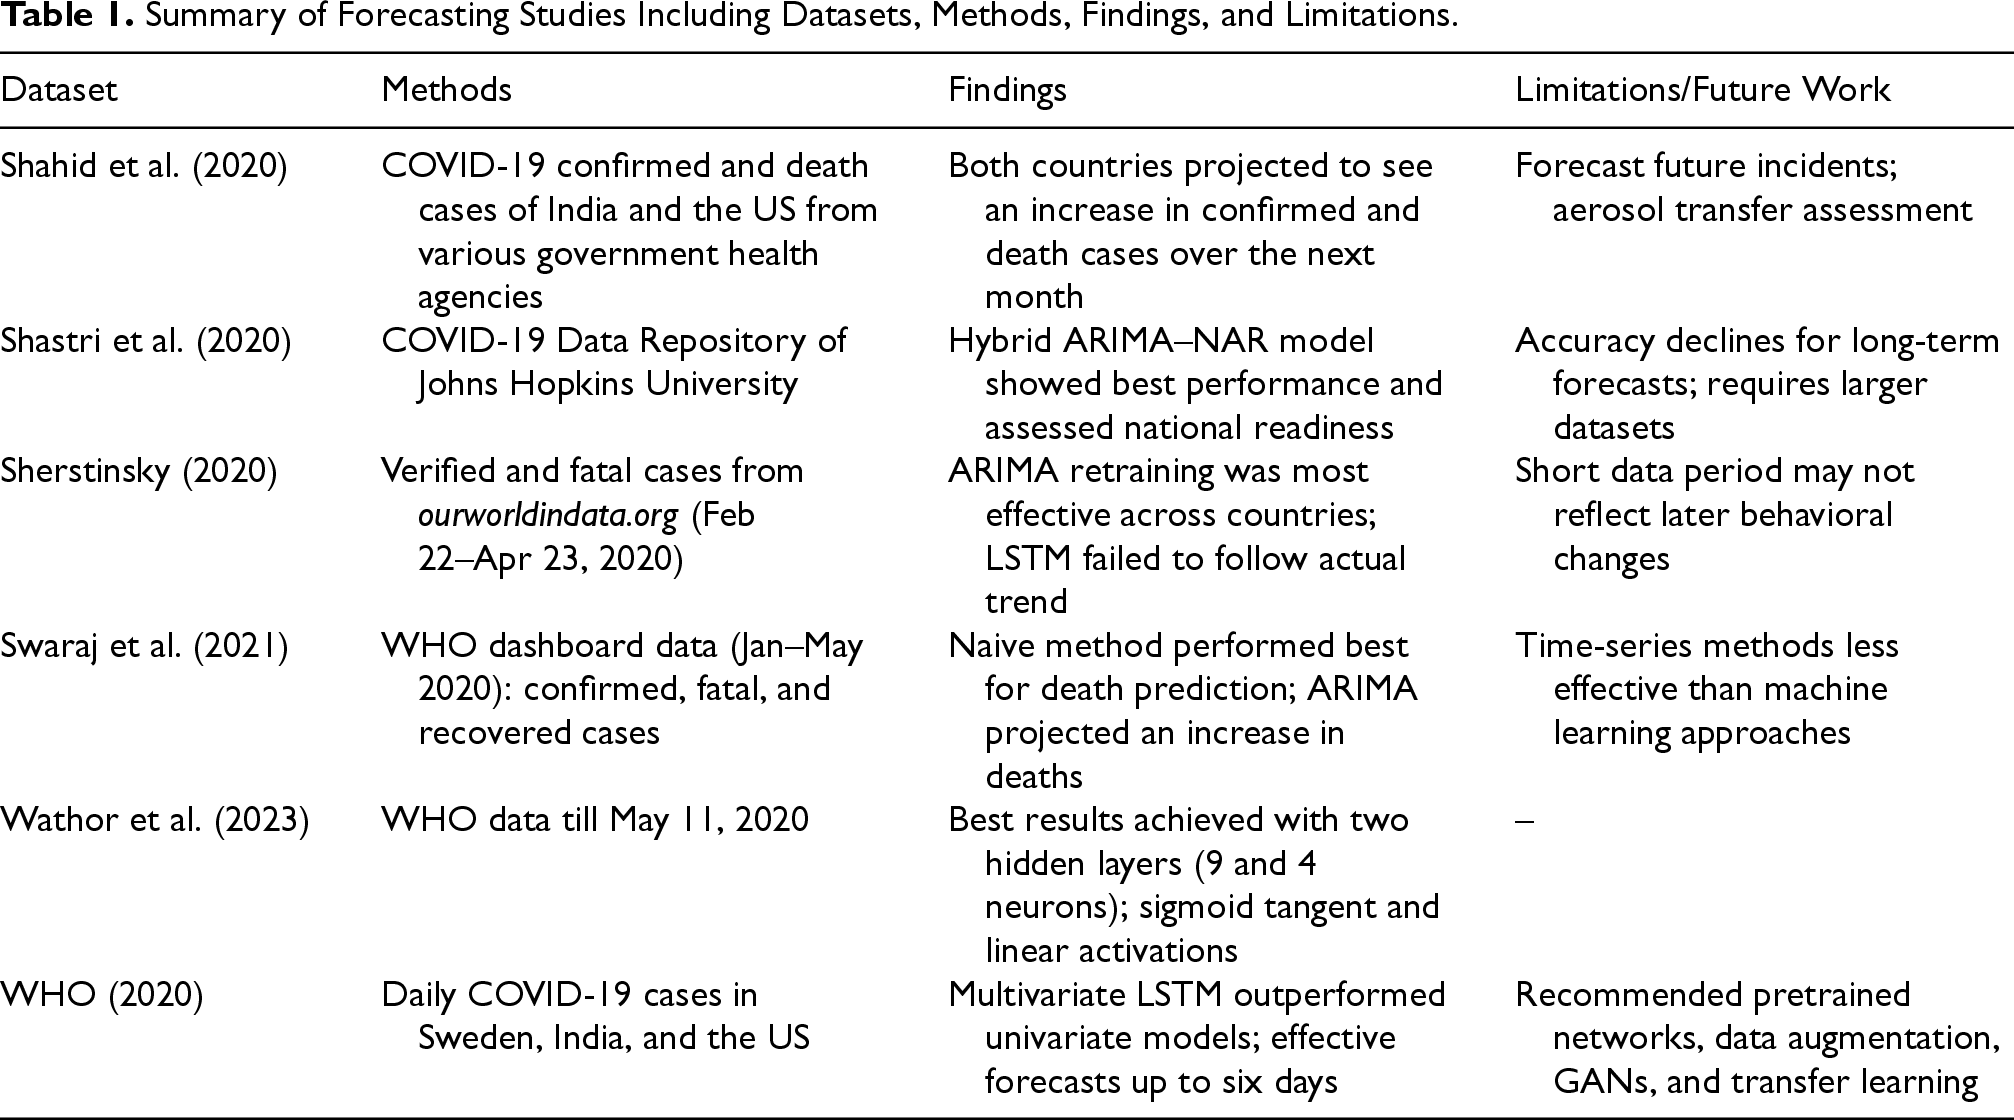
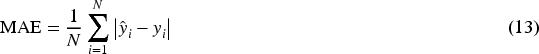
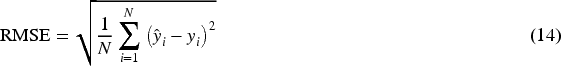
On the respective actual vs. predicted cases graph presented in Figure 1(a) to (c), the LSTM prediction.(red dashed line) and the actual (black line) track very well across the 60-day timeline, accurately identifying small fluctuations and the large peak on day 48. However, the ARIMA prediction shows wider oscillations and larger deviations, mostly under- and over-estimating highs and lows, to produce quite worse tracking of actual case behavior.
Actual and predicted values using LSTM and ARIMA models across different forecasting horizons. (a) 14-day forecast: Actual vs. LSTM vs. ARIMA, (b) 30-day forecast: Actual vs. predicted values and (c) 60-day forecast: Actual vs. predicted values.
Forecasting Accuracy Comparison. The comparison of LSTM and ARIMA performance across the 14-day, 30-day, and 60-day forecasting horizons reveals clear differences in their predictive capabilities, as summarized in Table 2. The LSTM model consistently achieves lower RMSE and MAE values, indicating a stronger ability to capture complex and non-linear relationships in the data. Although ARIMA performs reasonably well for short-term forecasts, its effectiveness declines as the forecasting horizon increases. This degradation is particularly evident in the 60-day forecast, where the
Forecasting Accuracy Comparison of LSTM and ARIMA Models.

In contrast, the LSTM model demonstrates a strong ability to learn long-term dependencies and non-linear relationships in the data. This advantage is particularly evident in the 30-day and 60-day forecasting horizons, where LSTM consistently outperforms ARIMA. By learning complex temporal patterns, LSTM maintains higher
Table 3 provides a comparative assessment of several forecasting models across distinct prediction horizons. Our research demonstrates that the LSTM model regularly surpasses the conventional ARIMA model in 14-, 30-, and 60-day predictions, attaining reduced RMSE and MAE values with elevated
Comparative Forecasting Accuracy of Different Models.

The analysis of the forecasting performance of LSTM and ARIMA across varying time windows (14-day, 30-day, and 60-day) provides a useful benchmark for evaluating model effectiveness and their respective strengths and weaknesses. The results indicate that the LSTM model consistently outperforms the ARIMA model, particularly as the forecasting horizon increases. This outcome highlights LSTM’s ability to capture non-linear patterns and long-range dependencies in the data, making it more suitable for complex forecasting tasks. In contrast, the performance of the ARIMA model deteriorates over longer forecasting horizons, as evidenced by a pronounced decline in its
Conclusion
The Results in this study present a clear leaning toward LSTM over the long forecasting term, though it is paramount to acknowledge limits existing in the two models. One primary limit is limitations of data. The success of both ARIMA and LSTM highly depends on data quality as well as quantities. LSTM requires ample data sets for effective capture of long-term dependence and subtle patterns. Insufficient data can lead to overfitting, thus compromising the effectiveness of the model. ARIMA’s reliance on stationary data makes it less suitable for datasets with non-stationary trends, where additional pre-processing steps are required to ensure proper predictions. Future research should explore the combination of hybrid models that tap into the strengths of both LSTM and ARIMA. Using ARIMA to forecast linear trends in data but allowing LSTM to detect non-linear patterns can be used to increase forecasting effectiveness. Further studies can also consider the use of LSTM in systems with limited data, using approaches like transfer learning or few-shot learning to offset data insufficiency. Another promising line of action is the use of ensemble techniques, where predictions of different models are combined to reduce overall error. Future studies might focus on improving the interpretability of deep learning models like LSTM. While LSTM yields high accuracy, its lack of transparency might hinder its application in industries requiring transparency, like healthcare decision-making. Researching methods to clarify the workings of LSTM models like attention mechanisms or explainable AI frameworks might help bridge the gap between accuracy and interpretability. In addition, further work on hybrid approaches combining the strengths of statistical and machine learning models can lead to more robust forecasting systems capable of handling a wider range of real-world conditions.
Footnotes
Funding
The author(s) received no financial support for the research, authorship, and/or publication of this article.
Declaration of Conflicting Interests
The author(s) declared no potential conflicts of interest with respect to the research, authorship, and/or publication of this article.