
Abstract
Official statistics on monthly export values have a publicity lag between the current period and the published publication. None of the previous researchers estimated the value of exports for the monthly period. This circumstance is due to limitations in obtaining supporting data that can predict the criteria for the current export value of goods. AIS data is one type of big data that can provide solutions in producing the latest indicators to forecast export values. Statistical Methods and Conventional Machine Learning are implemented as forecasting methods. Seasonal ARIMA and Artificial Neural Network (ANN) methods are both used in research to forecast the value of Indonesia’s exports. However, ANN has a weakness that requires high computational costs to obtain optimal parameters. Genetic Algorithm (GA) is effective in increasing ANN accuracy. Based on these backgrounds, this paper aims to develop and select an AIS indicator to predict the monthly export value in Indonesia and optimize ANN performance by combining the ANN algorithm with the genetic algorithm (GA-ANN). The research successfully established five indicators that can be used as predictors in the forecasting model. According to the model evaluation results, the genetic algorithm has succeeded in improving the performance of the ANN model as indicated by the resulting RMSE GA-ANN value, which is smaller than the RMSE of the ANN model.
Introduction
The value of exports significantly impacts Indonesia’s economic growth, while the value of Indonesia’s imports is not the case. The positive correlation is that an increase in exports means increased domestic production will promote economic growth [1]. The importance of exports to the Indonesian economy is the cause of up-to-date information on the development of export value is indispensable for planning and policymaking by the government. The Directorate General of Customs collects export data in Indonesia. Since 2015, export data has also been completed by obtaining more information from PT Pos Indonesia, records from other agencies, and the results of cross-border trade surveys [2]. As a result, the value of oil and gas and non-oil exports is published by BPS on a monthly basis [3]. However, there is a lag in publicity between the current period and the published publication. For instance, the published data on May 2021 is the temporary data for March 2021.
Lag publicity is an impact of several conditions: the complexity of data collection phases, the complexity of compiling the result of several surveys, and the length of processing data needed. Therefore, the collected data will not be released or disseminated at that time. However, overcoming the lag in the publication of export value data can be solved by predicting when the lag occurs. Several studies have conducted forecasting models to get the predicted value of exports using data published by BPS-Statistics Indonesia [4, 5, 6]. But, the data used is usually in the form of annual data series, so the predictive activity carried out by researchers is to predict the export value for the following years. Nonetheless, if the dissemination lag occurs in the monthly period, it will be more helpful to make predictions in the monthly period. Also, the monthly export value prediction can provide information on the latest export value compared to the annual forecast.
There is a challenge in predicting Indonesia’s export value’s current condition because it must also obtain supporting information describing the latest export condition. In addition, the supporting information can produce a reasonably good level of accuracy or predictive accuracy, at least equal to the performance of a model that makes predictions using annual data series. However, it is tough to get or determine indicators and information that can meet these two conditions.
Automatic Identification System (AIS) is one example of data in shipping and marine traffic, which is large in size and is real-time. AIS was developed by IMO (International Maritime Organization) as a standard to help ships avoid collisions and help port authorities control sea traffic efficiently. IMO requires AIS to be installed on international shipping vessels weighing 300 gross tonnages (GT) or more and all passenger ships [7]. The AIS mounted on the ship transmits a radio signal every second resulting in continuous and real-time information. As a result, AIS is widely used to predict ship trajectories.
Based on the results of academic research [8], besides having the benefits of being AIS-based ship traffic data, currently, AIS is also a source of big data that broadcasts trading activities in real time [7, 8]. Therefore, AIS has the nature of real-time data and big data’s classification. It means AIS is a hope to find indicators for supporting Indonesia’s foreign trade, which has good performance.
Indonesia’s export-import activities which are dominated by sea transportation would increase the potential use of AIS data as a provider of information on Indonesia’s foreign trade [9]. However, research or exploration of AIS data as supporting data that can be used as an initial signal regarding foreign trade conditions in Indonesia does not exist or has never been carried out. On the other hand, big data has become a research area with great potential in academia and the IT community [10, 11]. Therefore, this paper article aims to investigate and determine the AIS indicators, which we believe could play a role in providing initial signals of Indonesia’s foreign trade conditions. Then, input them into the predictive model to be used as additional information that can predict Indonesia’s export value in a more real-time period. The prediction model was built using the ARIMA statistical method and the artificial intelligence (AI) method, namely Artificial Neural Network (ANN). The ARIMA model is quite efficient for short-term forecasting, but ANN provides a better accuracy level than other prediction models [12, 13]. Thus, we will use the ANN method to predict the value of Indonesia’s exports using AIS data and compare it with the results of the ARIMA model.
On the other hand, ANN also has limitations; it requires high computational costs to obtain optimal parameters [14]. Based on the literature, this article will fill the gap of previous studies [4, 5, 6, 14], that is, predict the latest export value to cover the lag time of Indonesian export data dissemination monthly, and then overcome the limitations of the ANN method to find the best parameters. This process allows generating a more comprehensive and accurate model to predict the value of Indonesia’s exports in the monthly period.
Indonesian exports
All activities which issue or sell goods or services from within to abroad are called exports. Exports in economic growth aim to meet the needs of foreign markets and increase a country’s consumption to increase foreign exchange and per capita income [15, 16]. Indonesian exports constantly fluctuate both in volume and value [3]. Several factors that affect Indonesia’s export activities are exchange rates, interest rates, economic growth, inflation, and others [17].
The exchange rate is one indicator that affects stock and money markets activity because investors tend to be careful in making portfolio investments. The rupiah exchange rate is the price of the rupiah against the currencies of other countries [18]. So, the rupiah exchange rate is the value of the rupiah currency translated into the currencies of other countries. The strengthening of the rupiah exchange rate to a certain extent means that the performance in the money market shows an improvement. However, if there is an acceleration in the inflation rate, the domestic exchange rate will weaken against foreign currencies. As a result, it reduces the performance of a company and investment in the capital market.
Fluctuations in banking interest rates or interest rates set by Bank Indonesia significantly affect the movement of stock prices on the stock exchange. The interest rate is the ratio of interest to the loan amount. Suppose there is an increase in interest rates. In that case, the company’s cost burden will increase, thereby reducing company profits and increasing company risk because every company is always looking for sources of financing for operational activities through debt [19].
The money supply has a significant effect on exports. It has a positive relationship between the money supply and exports, which means that any increase in the money supply can increase exports [20]. Research on “The Effect of Exchange Rates, Indonesian Interest Rates and Gross Domestic Product on the Volume of Imports and Exports in Indonesia” was concluded that Interest Rates had a simultaneous effect [15, 21].
Automatic Identification System (AIS)
AIS is an international maritime communication system that is transmitted by most ships and is used to track the movement of ships. The AIS signal is automatically sent every few seconds via very high-frequency radio waves equipped with a GPS system. The United Nations Statistics Division [22] states three categories of information contained in AIS: static data, dynamic data, and shipping-related data. Static data includes characteristics about the ship, and dynamic data consists of the position and movement of the ship, data related to shipping. Data related to shipping provides information about shipping at that time. In its development, various fields and purposes use AIS data such as estimating CO2 exhaust on ships, helping fishery statistics and others.
AIS is also a ship tracking data that can indicate the volume of trade in goods of a region when the amount of seaborne trade is high [23]. Thus, we could use AIS data to forecast trading volumes in real-time by selecting and using the right indicators. However, suppose the coverage area of the AIS transmitter and receiver is small or poor in the area, the use of AIS data as a particular indicator must also be careful.
AIS data can be used as a data source because it meets the criteria of quality data: relevance, timeliness, accessibility, accuracy, coherence and comparability, and interpretability
Selecting variable method
When exploring AIS indicators that have the potential to be used as export predictors, we use a stepwise forward selection to select indicators that play a major role in export value. This method determines indicators by considering increasing criteria for each variable. This method starts with a model without variables. Then for each iteration, the variable that gives the most significant increase in criteria will be entered into the model. However, there are also considerations to exclude variables if they do not improve the model. So that this selected indicator can represent other variables, the impact of which is that the resulting model will remain efficient, simple and produce a comprehensive and good predictive model [12].
Forecasting method
Forecasting methods for time series data can use conventional statistical methods or use machine learning methods. Conventional methods such as ARIMA are better used for linear patterned data [24]. Meanwhile, it is also potential to apply machine learning techniques such as Artificial Neural Network to data with linear and non-linear patterns [25].
ANN can perform as well or even better than conventional methods, namely holt winters and the box Jenkins [26]. Moreover, ANN require fewer prior assumptions and can achieve higher accuracy compared with traditional approaches [27]. Empirical results obtained also showed that the ANN model is superior to the ARIMA model [28].
Auto regressive integrated moving average (ARIMA)
The ARIMA model is the simplest single-variable time series forecasting model because it only involves the behaviour of the variable itself. ARIMA is effectively used to perform short forecasting [29]; besides, the ARIMA model is a statistical method that is often juxtaposed with forecasting methods using artificial intelligence techniques [30]. The ARIMA equation can be seen in Eq. (1)
The ARIMA model is divided into non-seasonal ARIMA (ARIMA (
The ARIMA or SARIMA models are sometimes not enough to forecast data influenced by other indicators. Therefore, when we add the X variable into the ARIMA or SARIMA model, the model formed becomes the ARIMAX and SARIMAX models.
Time series data is often influenced by a special event or condition such as the Covid-19 pandemic, policy changes and other similar things that can be referred to as intervention events. The equation for the analysis of the step function intervention in ARIMA or SARIMA can be seen in Eq. (5.1).
The ANN method can be used for classification or prediction. ANN has many advantages compared to other methods. ANN is able to work on multidimensional data, easy to adapt and able to predict well [30]. Besides being used on non-linear data [31], ANN can also overcome noise or incomplete data [30, 31, 32]. ANN can perform as well or even better than conventional methods in econometric methods. It refers to the fact that the ANN method is a machine learning modelling algorithm insped by the workings of biological neural networks. Based on this analogy, ANN is built from a set of interconnected units or neurons, where each neuron will take several input values and produce an output value. The resulting output can be input for other neurons.
Processes that occur in neurons.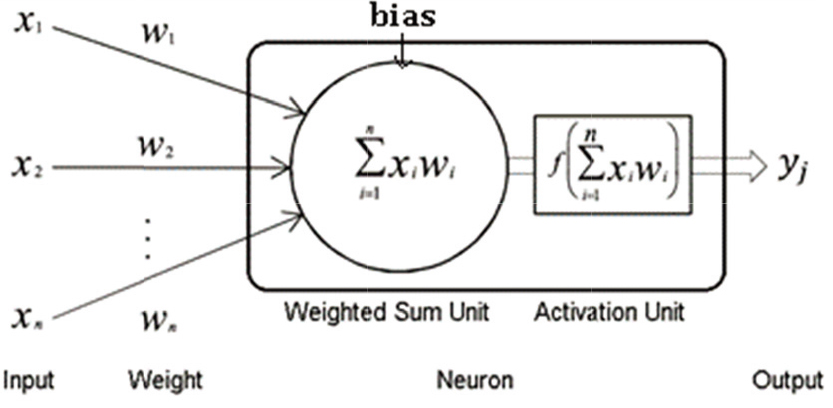
The ANN method has a function called the activation function or transfer function to process the information input to the neuron. The activation function changes the input, which already has a weight and can be output value. The processes that occur in neurons can be seen in Fig. 1. Several types of activation functions include linear functions, sigmoid functions, tanh functions, and so on [33].
The ANN algorithm has three main parts, namely the input layer, hidden layer and output layer. Each layer consists of several neurons. The architecture of the ANN includes a Single-layer Feed-forward neural network, a multilayer Feed-forward neural network and Recurrent neural network, an example of an architectural image can be seen in Fig. 2. The popular ANN learning algorithm is the Backpropagation Algorithm which modifies the weight backwards [33, 34].
Several algorithms are applied to the Backpropagation algorithm, which aims to produce the most optimal weight. The Descent Gradient Adaptive Moment Estimation (ADAM) algorithm produces optimal weight by minimizing the square of error in the Backpropagation algorithm.
ANN architecture with an input layer, two hidden layers, and an output layer.
The problem with the ANN algorithm is that there is no definite rule in determining the parameters or the number of hidden layer neurons in the ANN. Therefore, determining the parameters and the number of hidden layer neurons can affect the accuracy of the ANN prediction results. In contrast, the search for the optimal parameter or number of neurons requires a high computational cost. Therefore, the ANN algorithm needs to be hybridized with an optimization algorithm to obtain optimal parameters to overcome these problems.
A genetic algorithm is a search algorithm that is inspired by the principle of evolution in nature or Darwin’s Theory of Evolution. By imitating the processes of natural selection and reproduction, genetic algorithms can produce quality solutions to various problems involving search, optimization and training [35]. Compared to other algorithms, genetic algorithms can optimize globally, handling noise problems, solve complex problems well, and have high flexibility to be combined with other algorithms. The main components in this algorithm are genes, chromosomes, population and generations. At the same time, the stages include selection, crossover and mutation.
Forecasting model evaluation method
Several evaluation techniques are used to evaluate the resulting forecasting model, including the Root Mean Squared Error (RMSE) and another technique by calculating the Mean Absolute Percentage Error (MAPE). The smaller the value of both, the better the performance of the model in predicting. The formula for calculating RMSE and MAPE can be seen in Eqs (4) and (5).
Data collection method
The data used in this study are AIS data, export values, BI interest rates, and the dollar exchange rate against the rupiah. In the form of messages sent by ships, AIS data will be selected and processed into several indicators or variables ready to be used as predictors in export forecasting models. The data source is from the database of the UN Global Platform. The scope of AIS data used is AIS data sent by ships in the Indonesian bounding box area, especially in the ports registered on the Maritime Safety Information (MSI) website, which is 123 ports. Research references include reference data from December 2018 to December 2020, with 660 million messages originating from ships totaling around 16.616 ships.
AIS data is transmitted via radio waves and is in the form of a message code. for dynamic AIS data is transmitted automatically every two to ten seconds, and one of them sends the position of the ship coordinates. In our processing, we filter the ais data, which is to eliminate the ais data sent by ships whose time in port is more than 3 days, with the aim of reducing ships that do not contribute to export activities. The description of each attributes can be seen in Table 1.
The description of attributes in AIS data
The description of attributes in AIS data
The source of export data used in this paper is from the BPS website on the export-import page. The data is the value of Indonesia’s exports in US dollars per month. The data used as series monthly data with a period adjusted to AIS data, which is between December 2018 to December 2020. We obtained BI interest rate data and currency exchange rates from BPS-Statistics Indonesia and the Indonesian Ministry of Trade.
Selection of AIS indicators
The AIS data attributes used in this paper consist of unique Maritime Mobile Service Identity (MMSI) vessel number, date of observation (DTG), vessel type, vertical distance between the waterline and the bottom of the hull (meters), longitude coordinates in WGS 84 (decimal degrees), Latitude coordinates in WGS 84 (decimal degrees), Ship speed/Speed over Ground (knots), and cruise navigation status.
The types of ships covered in this study are cargo vessels and tanker vessels. Position coordinates are used to check the movement of ships in six months. If the coordinates are less than 0.1 decimal degrees, which means that the distance or change in position when sending the first message and six months later is not too far away from the change or movement of the ship, then the message is not covered in this research. The types of ships covered in this study are cargo ships and tankers because we suspect that both ships have a close relationship with export activities. Based on these attributes, the process of generating predictors that will be used in the forecasting model is as follows:
Time of ship in port (timeInPort). This indicator calculates the average time spent by ships in a port in seconds. The method used is to calculate the time difference between AIS messages sent by ships while in the port area so that if the next message is outside the port, it is not included in the count. Then the difference in time is added up by each ship per port. Unique number of ships in port (numVessel). This indicator calculates the unique number of ships that enter or are in the port area based on their MMSI number (ship identity number), so this indicator is calculated in units of the number of ships. Number of ship visits (numVisit). The number of ship visits can be calculated using the coordinates of the AIS messages sent by the ship. For example, if the previous message is sent outside the port area and the next message is sent in it, it is counted as one visit to that port. The number of changes to the ship’s draft (numDraughtDiff). This indicator calculates the number of ships that experience changes in the ship’s draft while in port. The ship’s water density is the vertical distance of the water from the bottom of the ship. The greater the distance, the deeper and heavier the ship. The change in ship draft is calculated by differentiating the ship’s draft in the next AIS message with the ship’s draft sent in the previous message. These changes will be divided into ships that experience an increase and ships that experience a decrease in ship water draft. Ships experiencing an increase in ship draft can be shown from a positive value difference and indicate an increase in load/weight on the ship; this indicator will be used to see the value/volume of exports-Vice versa. The amount of change in the draft of the ship’s water (sumDraughtDiff), This indicator calculates the amount of change in the draft of the ship’s water while at the port in meters. The method of calculating changes in the ship’s draft is the same as the previous method. The difference, This indicator calculates the amount of change that occurs on each ship in the port.
AIS data is available on detailed ship level data, data on messages sent by ships every time. We aggregate the data by forming indicators every month to be able to predict exports. For example, to form the timeInPort indicator, we divide the time a message sent by a ship later with the previous time at a port. The data is aggregated by adding up every month so that we have data on the time of ships in a port every month, and later it will be added up for each port so that it becomes a national timeInPort indicator. Likewise for other indicators.
Export data preparation
To find out how the development of export value during the period December 2018 to December 2020, the export value growth is calculated using Eq. (6)
where
The determination and selection of the AIS indicator with the largest contribution in predicting the value of exports is carried out using the forward stepwise selection method. In addition to using predictors derived from AIS data, the forecasting model will also be carried out using macroeconomic indicators that have a relationship and influence on the value of Indonesian exports, the two variables that will be used are the USD exchange rate and the BI rate interest.
Stages of prediction model formation
SARIMA and ANN algorithm is used as a method of forecasting export values using AIS data. The determination of the parameters and topology of the model ANN will be optimized by the Genetic Algorithm, so that this research method is called a hybrid algorithm GA-ANN. The research data consisting of 16,616 ship IDs and millions of messages will be divided into two datasets, 80 percent of the total data will be used as training data, while 20 percent of the data will be used as testing data.
SARIMA step function intervention analysis
In this study we use SARIMA step function intervention analysis, because there are seasonal indications in export activities in Indonesia and there is intervention conditional as long as our periodic time reference. The seasonal effect is that every year in Indonesia there is a long ramadan holiday in which has an impact on export activities in Indonesia. The intervention condition that happen in our period data is COVID-19, that is first found in Indonesia on March 2020. The prediction model will use indicators from AIS data and macroeconomic variable as exogenous variables to forecast export values data. When we add the auxiliary variables into ARIMA or SARIMA, then the model’s name become ARIMAX and SARIMAX.
Artificial Neural Network (ANN)
The ANN architecture used is a Multilayer Feed-forward Neural Network, which has more than one hidden layer and a backpropagation learning algorithm use ADAM, where the weight of each layer will be adjusted to get the smallest possible error between the prediction results and the actual target data.
As for the number of neurons, the default hidden layer uses one hidden layer with the number of neurons as many as 100. However, the values of these parameters should vary according to the characteristics of the data. To find the right parameters according to the characteristics of the data requires a large computation time, especially if the data size is also large. Thus we need a method that can reduce the time to be shorter. One way is to use an algorithm that can provide information about the most optimal parameters. These algorithms are usually called optimization algorithms.
ANN optimization with Genetic Algorithm (GA-ANN algorithm)
Compared with other optimization methods, GA is effective in overcoming the combination or complex problem and gives good results [26]. In addition, GA can find global optimization, supports parallel processing, and is not affected by noise, and is suitable for continuous learning [36].
Previous research has discussed the problem of time series modelling to predict a certain characteristic value in the future period using Artificial Neural Network (ANN) and Genetic Algorithm (GA). The study concluded that the application of the ANN and GA models was able to provide fairly accurate prediction results shown from the proximity between the target and the output [37].
The Genetic Algorithm in this study aims to obtain optimal ANN parameters such as the number of hidden layers, the number of neurons, the determination of the learning rate and the momentum value. The stages of implementing the Genetic Algorithm to optimize the parameters of the ANN are described as follows:
Create an early generation.
Initial individuals can be created by initializing genes, namely by coding using real numbers for the parameters and topology of the ANN network to be searched. Gene values will be generated using uniform random numbers with constrained values:
The number of hidden layers used in this study is four with a range of neurons number is [1, 20], [ For activation function parameter values, gene values will be generated with random real numbers as many as available functions. Then rounding will be done to an integer that represents the sequence of the activation functions. For parameter values of type float, learning rate and momentum, gene values will be generated by real random numbers in the range [0.001, 2.0] and [0.0, 1.0].
The determination of parameter values such as mutation rate, pop size, etc., based on the reference from the Genetic Algorithm book [36]. We state the population size is 20. The increasing of the population size will require fewer generations to reach a solution. We state the maximum generation is 50. However, the computational and memory requirements increase with the population size, and we typically aspire to find a moderate population size that will provide a solution within a reasonable amount of time. The mutation rate usually occurs with a very low probability, according to the reference we determine the mutation rate is 0.3. and for the cross operator is typically applied with some (high) probability value, so based on the reference we used cross over rate as 0.9 [36].
Calculate the fitness value. The fitness value is used to show how well the individual parameter values in the ANN model are. The higher the fitness value, the better the results of ANN modeling with individual parameters. Calculation of fitness value using RMSE in Eq. (8).
RMSE calculation refers to Eq. (4).
Selection.
The selection method is used to select the best individual as a parent for the next generation, in this case two parents are selected. The selection method used is rank-based selection, which is choosing based on the probability of the highest individual fitness ranking. This method was chosen because it gives better results than other methods [11, 12].
Crossover.
Gene crossing occurs when the generated random number is less than the crossover rate, which is 0.1. The crossover method uses the Simulated Binary Crossover (SBX) method, because it can produce better values if the gene values are real numbers or continuous values [7]. The SBX formula is like Eqs (10) and (10).
where
where
Mutations.
Gene mutation occurs when the generated random number is less than the mutation rate, which is 0.01. The mutation method used is a uniform random number (random uniform).
Regeneration.
Individual offspring resulting from crossovers and mutations will be included in the new generation if they have a fitness value greater than the previous generation. The new individual replaces the previous generation individual who has the lowest fitness value.
Criteria for termination.
The Genetic Algorithm will continue to regenerate until it reaches the termination criteria. In this study, the criterion used is if the generation produced reaches the maximum generation limit, which is as many as 50 generations. Then the best individual in the final generation will be selected based on their fitness value.
The summary statistics of five indicators generated from AIS data, interest (BI) rate, exchane rate and exports values
a. Plotting exports values from dec 2018–dec 2020, b. Plotting standardized exports values from dec 2018–dec 2020, c. Plotting Growth rate exports from dec 2018–dec 2020, d. Plotting Standardized Growth Rate export from dec 2018 to dec 2020.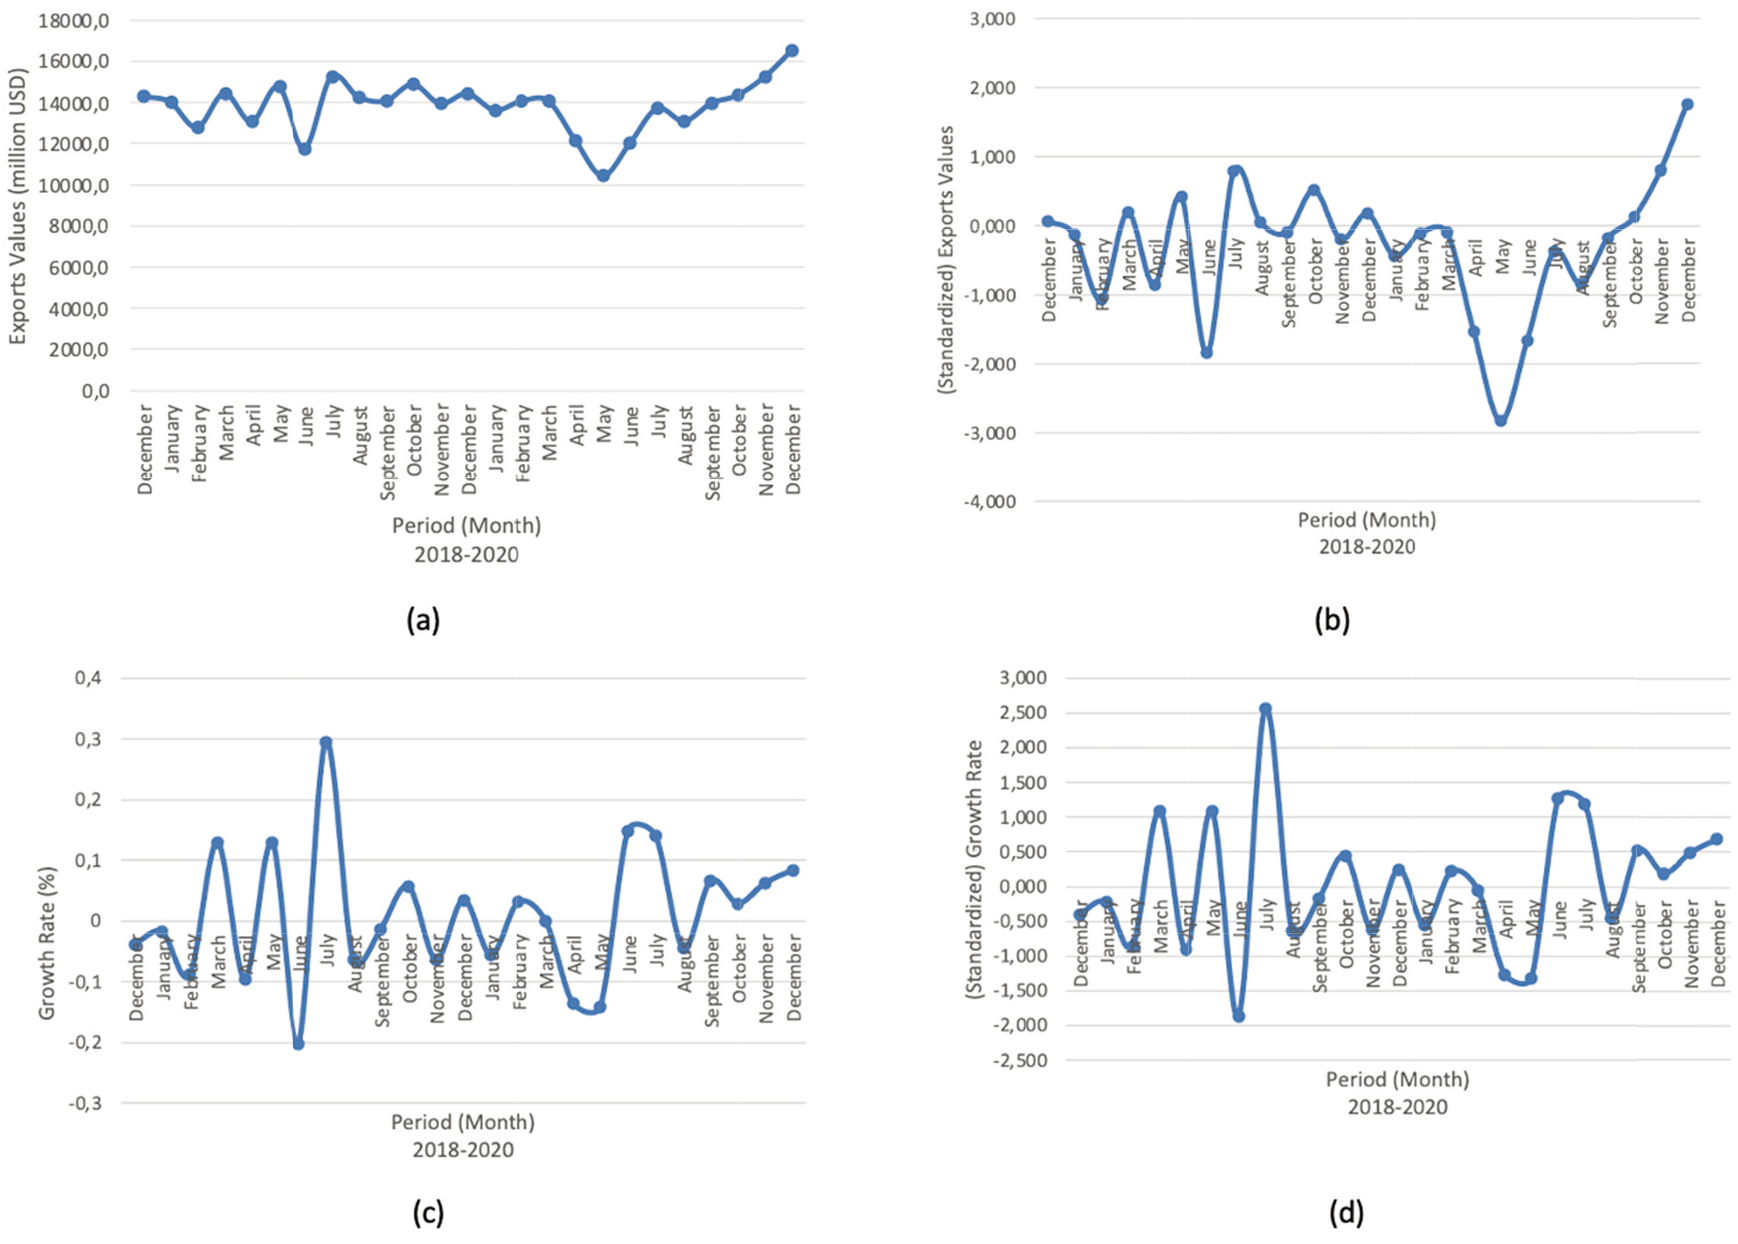
The plotting of indicators AIS, interest (BI) rates, exchange rate and exports values in indonesia December 2018–December 2020.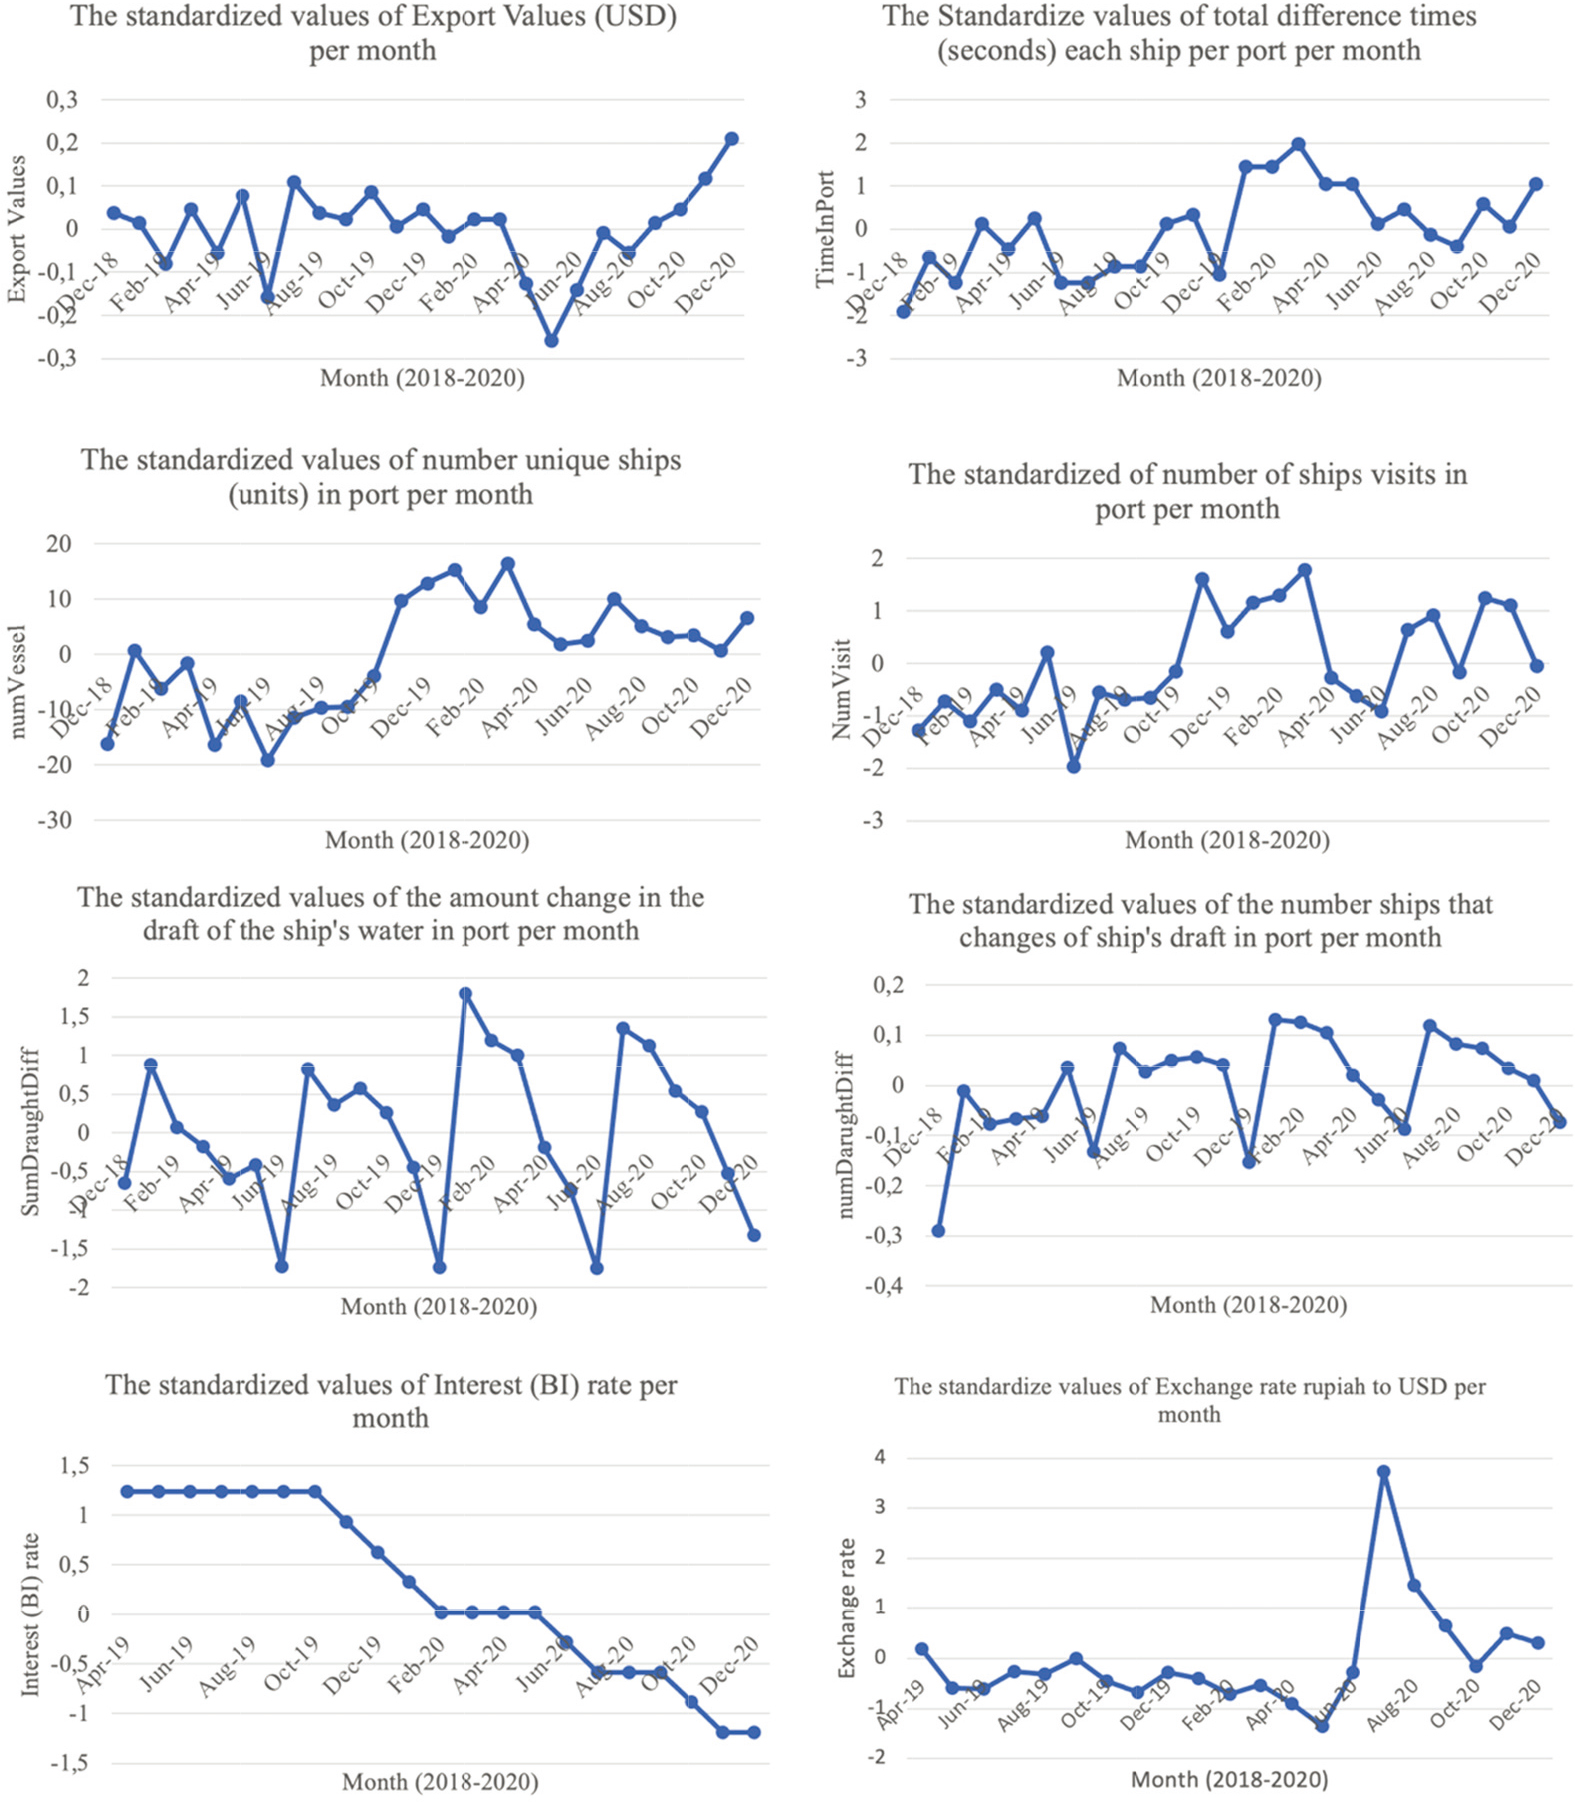
The movement of the actual and standardized export values can be seen in Fig. 3a and b. while the movement of export growth rate and standardization results can be seen in Fig. 3c and d. The pattern of movement in the growth rate of export values is more stationary than exports values. So, the growth rate of exports values become the choice to become a variable response in forecasting model.
There is an extreme movements in June 2019 t0 July 2019 and also May 2020 to June 2020. This caused by the condition of seasonal effect in Indonesia that is long Ramadhan holiday. The increase in exports in July 2019 and June 2020 was partly due to the industrial working period which had started to return to normal after the long Ramadan holiday.
Indicators generated from AIS data and the selection of indicator AIS
The condition of five indicators produced from AIS data, the movements of BI rate, the exchange rate can be seen in Fig. 4. They have so various pattern that fluctuated. The summary statistics of exports values, each of indicators AIS, BI rate and Exchange rate can be seen in Table 2.
The main objective of this paper is to select the AIS indicator that has the most contribution to predict export values. Based on the results of the selection of variables with the forward stepwise selection technique produced indicators numVisit as the main contributor to predict export values.
The parameter of ANN, GA-ANN and values (
) (
) of SARIMA method
The parameter of ANN, GA-ANN and values (
RMSE of several models forecasting of exports values with several combination of auxiliary variable.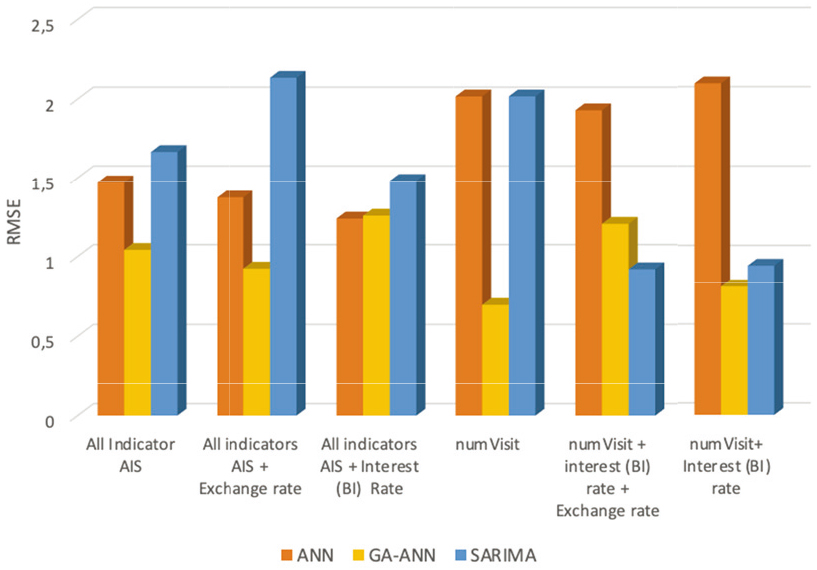
The second objective of this research is to obtain optimal ANN parameters. The search for optimal ANN parameters such as the number of neurons in the hidden layer, the activation function to be used, the value of learning rate and momentum (updating weight) are searched using genetic algorithms. The optimal parameter can be seen in the Table 3.
To determine the best forecasting model, plotting the RMSE value between conventional ANN, GA ANN and SARIMA models with various combinations of predictors is carried out as shown in Fig. 5. Based on the method, commonly GA-ANN has better performance than conventional ANN. The performance of SARIMA is fluctuated for each kind of combination of predictors.
Then based on the auxiliary variable, the use of the selected variables (NumVisit) in the model produce the lowest RMSE value for GA-ANN method with number of hidden layer is 1, number of neurons are 15, activation function is ‘tanh’, learning rate is 0.05029 and momentum is 0.376.
Evaluation values of ANN and GA-ANN model
Evaluation values of ANN and GA-ANN model
Plotting actual exports values and predicting of export values by GA-ANN.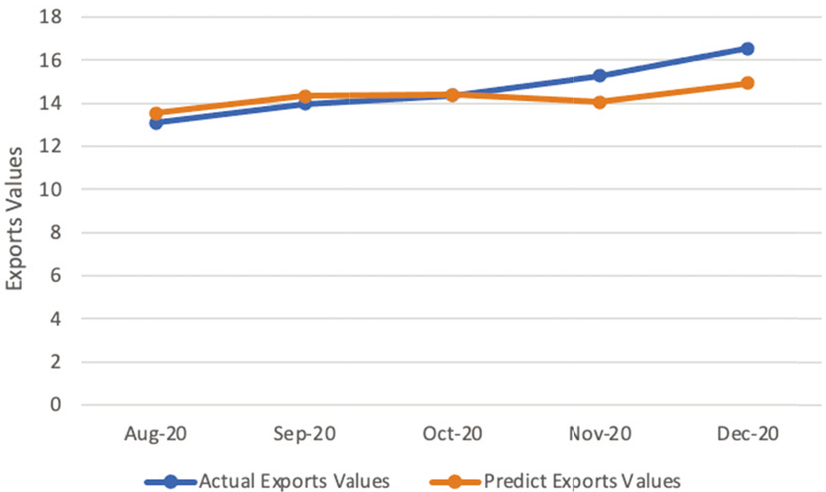
In this study we find that GA-ANN is better at predicting the value of exports compared to ANN conventional. The Table 4 shows that almost in whole model, GA-ANN method has better performance than ANN. It means Genetic Algorithm can result the optimal parameter for ANN.
Next, this study compares the role of macroeconomic indicators and AIS data in forecasting export values. And as a result, AIS data can predict the value of exports well without comparing it with other macroeconomic indicators. Although, this means that AIS data can be used as an alternative data that can provide an initial signal of information as an indicator of exports or foreign trade, one must be careful and use the right method to produce the right prediction [38, 39].
The GA-ANN model as the chosen model in this study was then used to predict the value of exports on the period August 2020 to December 2020. The prediction value in October 2020 has the highest accuracy rate compared to the other four time points and only has a difference in prediction value of 18 million USD. Or the difference of the prediction values about 0.13 percent from the actual value. The biggest difference in value occurred in December 2020, but the change of the growth rate of export values from November 2020 to December 2020 have the same rate. The biggest different prediction is in November 2020. It happens because in the history of series data used in this research, the condition of the export values in November 2019 has been decrease from the previous month. So, it is effect to the result of prediction on November 2020.
Apart from these three findings, we consider things that need to be improved in forecasting export values using AIS data. First, more effort is required to explore and filter the AIS indicator as supporting data for official statistics. Millions of messages in one month make AIS data has great potential in providing information on foreign trade. The next thing that is not less important is selecting and determining methods that can handle large data types with all their complexity so that the right method can produce the best output. Although, in general, machine learning or Artificial Intelligence methods have the potential to provide more accurate results than conventional methods [35, 36, 37, 38, 39, 40, 41], future research can explore methods such as Support Vector Machine, Naive Bayes and so on to gain new insights.
The range of AIS data available and used in this study is limited from December 2018 to December 2020. The main reason is AIS data available since December 2018. It causes the export data series, BI rate and the exchange rate used in this study to also start from December 2018; the total monthly series is 25 points. This number is relatively small. As a result, the number of testing data series used is only 5-time points. For the next research, it is expected to obtain a longer data series so that the model’s accuracy can be improved.
There are two macroeconomic indicators that we use, the BI interest rate and the exchange rate. Other macroeconomic indicators can be used to forecast export values, such as inflation [42, 43]. Selecting other macroeconomic indicators combination is the potential to produce the best forecast. We can also ignore macroeconomic indicators in predicting foreign trade indicators, as is the case in some areas, where macro variables do not really influence the prediction of the economy [41, 42, 43]. This is what happened in the case of this study.
As this study only focuses on forecasting the value of exports, the following research opportunity will be to apply AIS data in predicting export volume or import value and volume to assess whether this AIS data is as effective as predicting the value of Indonesia’s exports. Currently, academics and researchers indicate that AIS data has many benefits for generating information outside of marine information [42]. In addition, there is a great opportunity for researchers to develop various analytical methods for Big Data [44].
Footnotes
Acknowledgments
We would deliver our gratitude to the Director of Distribution Statistics of the Central Bureau of Statistics Indonesia, Mrs. Ir. Efliza ME, who has introduced AIS Big Data and its use, also provided challenges and access for us to explore AIS data and provide benefits to official statistical data. In addition, we would like to thank all ranks of the distribution directorate of BPS Statistic Indonesia, who has shared knowledge and experience regarding the recording of Indonesian export official data and export activities themselves. And thanks also to UN for giving us the opportunity to explore AIS data to the fullest.