
Abstract
Predictors of macroeconomic indicators rely primarily on traditional data sourced from National Statistical Offices. However, new data sources made available from recent technological advancements, namely data from online activities, have the potential to bring about fresh perspectives on monitoring economic activities and enhance the accuracy of forecasting. This paper reviews the literature on predicting macroeconomic indicators, such as the gross domestic product, unemployment rate, consumer price index or private consumption, based on online activity data sourced from Google Trends, Twitter (rebranded to X) and mobile devices. Based on a systematic search of publications indexed on the Web of Science and Scopus databases, the analysis of a final set of 56 publications covers the publication history of the data sources, the methods used to model the data and the predictive accuracy of information from such data sources. The paper also discusses the limitations and challenges of using online activity data for macroeconomic predictions. The review concludes that online activity data can be a valuable source of information for predicting macroeconomic indicators. However, one must consider certain limitations and challenges to improve the models’ accuracy and reliability.
Introduction
Traditionally, empirical economic research has been based on data from National Statistical Offices (NSOs) using censuses, sample surveys, administrative data or combined data. However, most macroeconomic outcomes are often published with time lags, i.e., with a certain amount of time elapsed between the end of a reference period and the publication of the corresponding preliminary or definite estimates.
Recent technological advances, such as Internet development and digital transition, led to the advent of big data and resulted in new data sources boosted by advancements in analytics software, cloud solutions and high-processing computer capacity at affordable prices. Technology companies like Google, Apple, and Microsoft, as well as large-scale administrative data repositories, such as transactional data from electronic payments or business traffic, can offer additional data to those from NSOs, potentially influencing economic research. These sources can grant real-time data, provide additional perspectives and enhance economic forecasting.
Using data sources derived from Internet development and digital transition to forecast a macroeconomic outcome is gaining popularity in the economics literature, driven by timelier and more frequent updated information access. These sources can offer valuable insight into predicting macroeconomic trends, empowering researchers and policymakers to make more informed decisions. In particular, data derived from search engines, social media and mobile devices constitute a significant fraction of online activity data, as they provide communication and search tools for Internet users.
The Internet and mobile devices have assumed a daily role globally, with a noticeably growing audience (Appendix A). Current estimates indicate that approximately 66.3% of the world’s population, totalling 5.3 billion individuals, are active Internet users [1]. Moreover, there are about 5.31 billion unique mobile users worldwide, constituting 67.1% of the world’s inhabitants, and the number of active social media users is estimated at 4.62 billion, representing 58.4% of the global population [2]. The Internet adoption rate has grown significantly from 2009 to 2022, increasing from 25.4% to 66.3%, more than doubling its prevalence in the meantime [1]. In 2009, the web traffic predominantly originated from desktop devices (99%, with mobile accounting for 1%), while in 2022, the market share of mobile devices had increased to 58.3% while desktop usage had declined to 39.4%, and tablets constituted 3.3% [3]. Accordingly, the primary motivations for Internet usage are intrinsically related to search engines and social media platforms, given that the most prominent reasons are “finding information” (61.0%), “staying in touch with friends and family” (55.2%), and “keeping up-to-date with news and events” (53.1%) [2].
An effective way to find information online is by using search engines,1
Search engines are web-based software of universal use that allows users to search for keywords or terms to retrieve relevant results.
This paper presents a structured review of the predictive capabilities of data generated from online activities, like data from Google Trends, Twitter and mobile-generated data, focused on macroeconomic indicators, namely the gross domestic product (GDP), unemployment figures, inflation and private consumption. The review aims to evaluate the current status of scientific research on the predictive ability of online activity data for macroeconomic indicators, thus addressing concerns regarding the applicability of such data to various economic indicators and countries e.g. [4, 5, 6]. To this end, publications obtained from searches conducted on indexed databases, such as the Web of Science and Scopus, and manual searches serve as the basis of this review. This structured review extends the research provided by [7] and focuses on predicting macroeconomic indicators using online activity data sources. Also, this review offers a state-of-the-art understanding of the literature about predictions using such data sources, addressing answers on how to collect public data, which econometric methods are prevalent in the literature, which countries the literature focuses on, what the data limitations are and whether the outcomes converge to similar conclusions.
Flow of publications selection.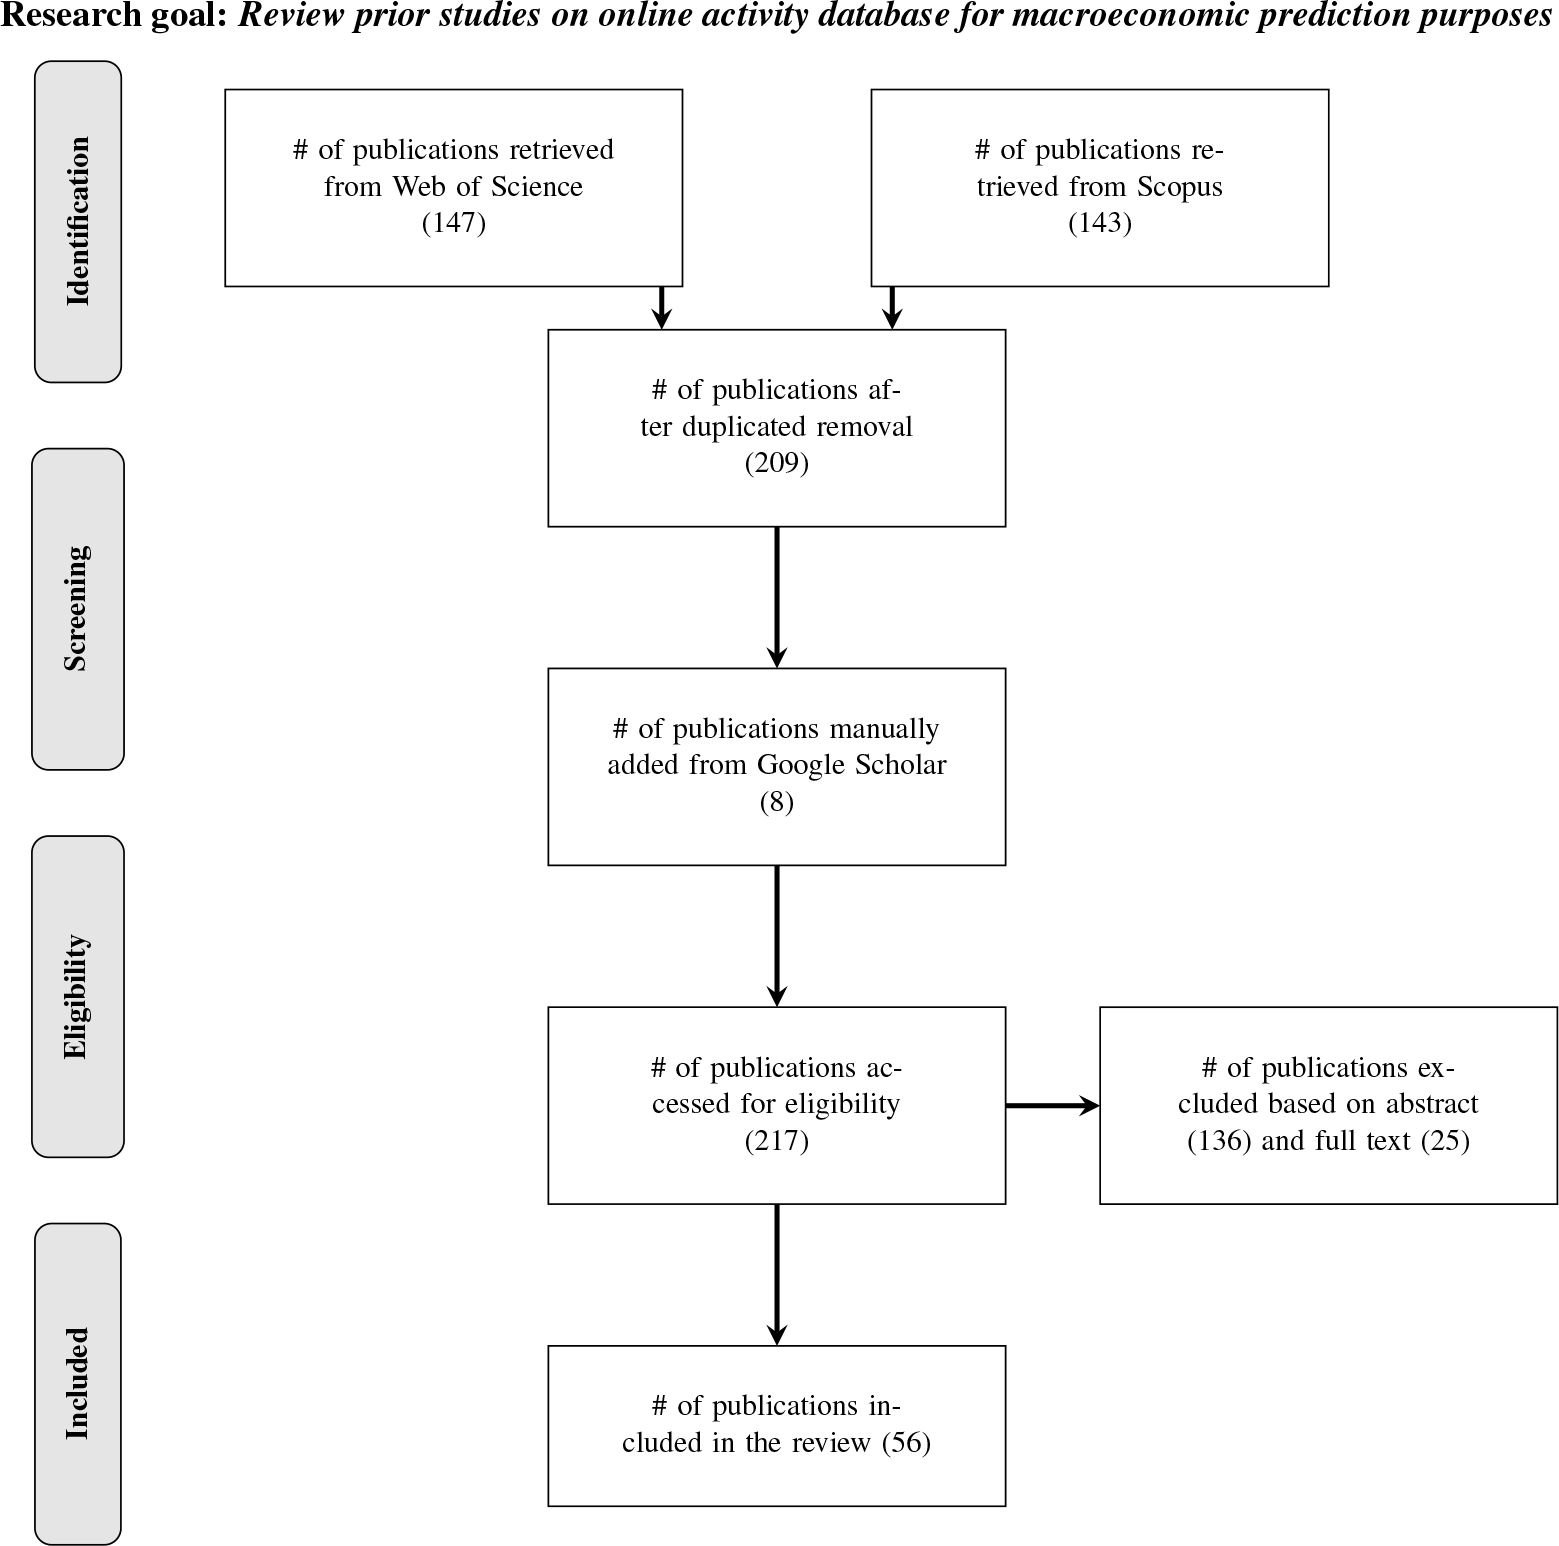
The remainder of this paper is structured as follows: Section 2 establishes the methodology applied to gather and analyse relevant literature; Section 3 provides a bibliometric summary of the selected publications, characterises the online activity data sources, encompassing solutions to collect public data as well as the data collection strategies and limitations found in the literature, and systematically reviews the prediction strength of online activity data; and Section 4 exhibits the concluding remarks.
Following the methodology provided by [8], this systematic review uses as a primary source the publications indexed on the Web of Science and Scopus databases, as well as publications from manual searching over Google Scholar, to answer the central question: What is the current state of scientific research on predicting macroeconomic indicators using online activity data?
The authors of this paper discussed and defined the search strings used in this review, which are composed of three sets of keywords related to the research question:
macroeconomic indicators, mi
data sources, ds
prediction keywords, pk
On the 30th of March 2023, searches for relevant publications were performed on the Web of Science and Scopus databases using a boolean query based on the sets of keywords abovementioned, mi AND ds AND pk, and considering their occurrence in the publication title, abstract or keywords. The search criteria are limited to studies written in English, classified as articles or review articles, and related to one of these research areas: economics, business, business finance, management, social science or computer science. No restriction in terms of publication date was applied.
Annual scientific production of studies using online activity data to predict macroeconomic indicators (2005–2022).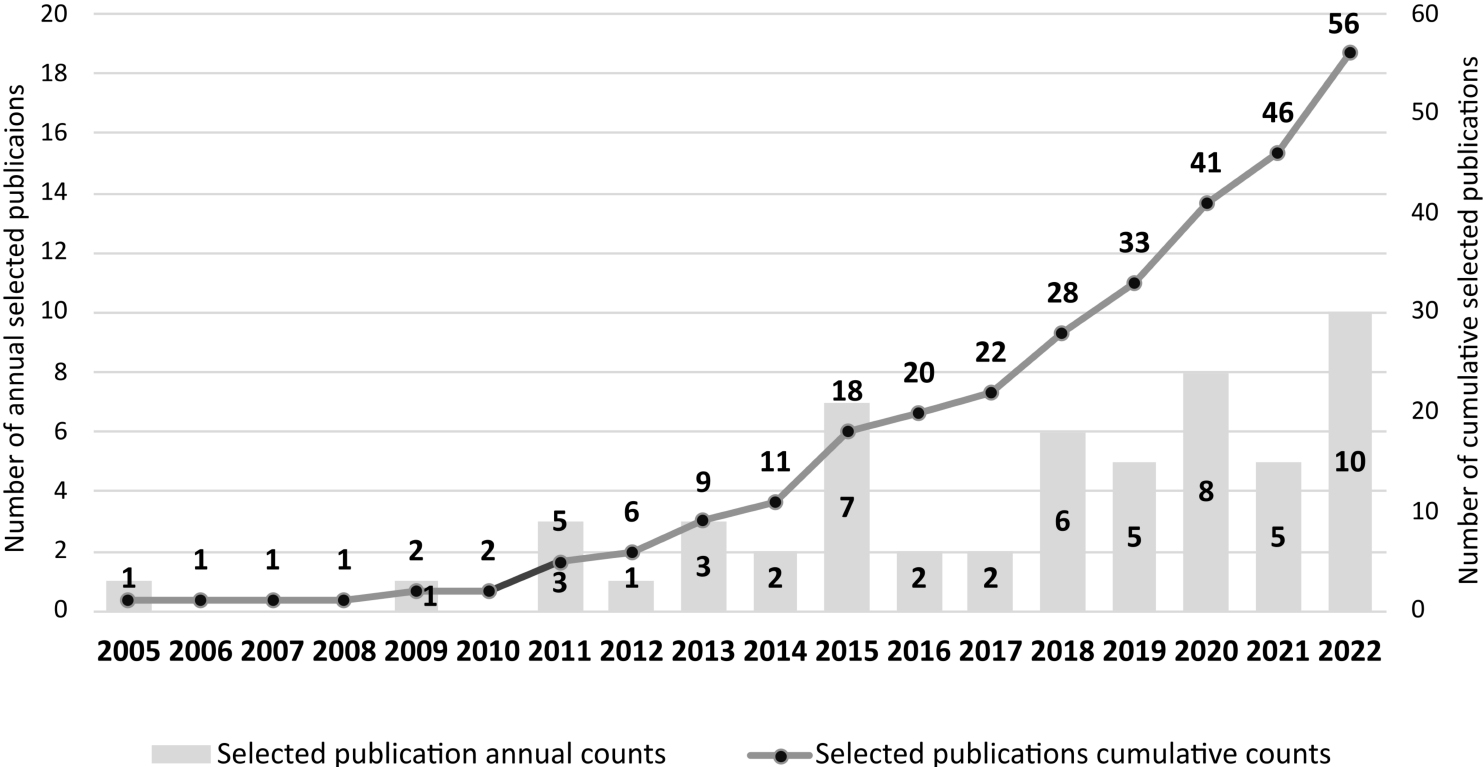
The search query resulted in 290 publications, 147 of which were retrieved from the Web of Science and 143 from Scopus. The deduplication process reduced the number of publications to 209 papers, prioritising general document information from the Web of Science. From this set of publications, the judgement of including an article in the review was taken by reading the titles and corresponding abstracts. Reading full articles was necessary whenever the final decision on including a paper was uncertain. From the 209 documents, the two authors of this systematic review selected publications independently to minimise the potential for biased results. The final selection resulted in 48 publications. In addition to the search on Web of Science and Scopus, a manual search on Google Scholar adds to the papers selected relevant articles published by research centres, institutions, and organisations not indexed by the primary databases. This search yielded eight publications. Figure 1 summarises the process of selecting publications.
Accordingly, this review takes into account a final set of 56 publications. From each was extracted the following information: bibliographic references (authors, year of publication, source title and number of citations), source of online activity data, macroeconomic indicator predicted, country of analysis, methods employed, findings and impact on predictions.
Additionally, this literature review is structured around two primary themes. The first theme encompasses exploring the web activity data utilised in the selected publications, providing detailed insights into the data sources, methodologies employed for data collection, and pertinent concerns regarding the data. The second theme centres on the objectives of papers’ predictive analyses and associated prediction assessments, categorised into three sub-themes. These sub-themes regard (a) the utilisation of online activity data as a broad macroeconomic predictor, (b) the evaluation of forecasting accuracy for specific sociodemographic attributes such as sex and age, and (c) the assessment of the predictive capabilities of web activity-based data in the context of significant economic events, such as the 2008 financial crisis and the COVID-19 pandemic. These overarching thematic axes were identified using the thematic analysis framework proposed by [9], adhering to the inductive approach principles outlined by [10].
The findings of this literature review encompass some key aspects, which include a bibliometric over-view of the selected documents, a concise summary of macroeconomic indicators found in the literature, the countries under scrutiny and the methodologies employed for prediction, all detailed in Subsection 3.1. In addition, the results for the two thematic axes, one centred on the sources of online activity data and the other focused on the predictive objectives and outcomes of selected papers, are presented in Subsection 3.2 and Subsection 3.3, respectively.
Bibliometric summary
From the 56 selected publications (listed in Appendix B), the first research relating online activity data to predict macroeconomic indicators dates from 2005. This seminal paper investigates the association between unemployment level and search-terms usage in previous weeks, sourcing from WorldTracker’s Top 500 Keyword Report the search demand history of specific related terms in the USA from 2001 to 2003 [11]. It uncovered a significant relationship between search-terms data and future unemployment dynamics. However, the research community’s interest in this subject remained relatively dormant for a few years. Subsequently, in 2011, empirical research using digital activity data started exhibiting a notable upward trend with an annual growth rate of 14.50% and a growing interest in the last years, as illustrated in Fig. 2.
The selected publications spread over 42 distinct periodical sources, with a mean of 1.36 publications per source. Table 1 depicts the primary sources of research dissemination, with the International Journal of Forecasting leading the list.
Based on the information provided in tab: cited, the document with the broadest reach is Predicting the Present with Google Trends [12], a collaborative study published in a 2012 special edition of “The Economic Record”. This document amasses 992 citations, i.e., an average of 82.67 per year since its publication.
The literature predominantly centres around predicting various unemployment-related aspects, such as the unemployment rate, the number of unemployed individuals or initial claims for unemployment benefits. This pronounced focus on unemployment prediction can be attributed to the pioneering work conducted by [11] and the widespread research of [12]. However, it is noteworthy that the literature also explores online activity data as predictive indicators for other macroeconomic measures, including the gross domestic product, inflation, and private consumption, as shown in tab: macroecon.
Periodical sources by the number of selected publications
Periodical sources by the number of selected publications
Top 10 globally cited documents among selected publications
The primary data sources for online activity concentrate on information obtained from search engines, as indicated in tab: datasources, with a substantial emphasis on Google Trends. Notably, Twitter is the sole data source representing social media, while only a few publications employ data generated through mobile platforms.
Prevalence of prediction methods and country of analysis over selected publications.
As depicted in Fig. 3(a), the data from online activities allow researchers to employ a diverse array of prediction methodologies. These methodologies encompass a spectrum ranging from traditional time series techniques to panel data analyses designed to evaluate the predictive capabilities of web-based data in the context of macroeconomic indicators. The most prevalent prediction method uses classic time series models, which feature 55% of the 56 documents. This methodology includes models such as the (V)ARMA family with exogenous variables, incorporating or not seasonal terms, and (V)error correction. The flexibility of online activity data, particularly in sampling frequencies, enables researchers to employ mixed-frequency approaches (14%), including bridge equations and mixed data sampling models. Other methodologies include Bayesian time-series models (9%), panel data analysis (9%), filtering methods (9%), and the application of machine learning tools (9%). Furthermore, novel regression approaches (4%) and linear regression models (2%) are also represented in the literature.
The publications under consideration focus on a single country (79%), with a marked emphasis on studies conducted for the United States, accounting for 48% of the total 56 publications, as illustrated in Fig. 3(b) and Fig. 3(c). The primary focus of the reviewed literature is on developed economies, according to the classification of the [13]. Notable exceptions to this trend include analyses conducted for countries such as Türkiye, Korea, Mexico, Thailand, and four of the five BRICS economies: Brazil, Russia, China and India.
The first axis of analysis explores the underlying mechanisms related to online activity data concerning the Google search engine in Subsubsection 3.2.1 and social media and mobile in Subsubsection 3.2.2, resulting from the thematic analysis exposed in Section 2. This axis also encompasses the strategies employed for data collection, presented in Subsubsection 3.2.3, and a comprehensive examination of the inherent limitations associated with data sources in Subsubsection 3.2.4.
Macroeconomic indicators found in the literature using online activity data as a predictor
Macroeconomic indicators found in the literature using online activity data as a predictor
Online activity data sources of selected papers to predict macroeconomic indicators
The current Google Search public repository for obtaining historical data based on Internet searches is Google Trends,2
As a historical note, the preceding repository version used to be Google Insights for Search.
The IP represents a unique identification of each computing device in a computer network.
Examples of categories: Arts & Entertainment, Autos & Vehicles, Law & Government, News, Travel.
GT provides updated reports on the relative demand for keywords, search terms or categories via a default normalised index, the Google Index (GI) [15]. The GI corresponds to the inquiries on Google Search given a geographical area and period, represented on a scale from 0 to 100, where 0 stands for the lack of interest in the period and 100 denotes maximum popularity [16, 17, 18]. In addition, the GI may assume the label “
GI displays varied sampling frequencies according to the length of days of the requested series. The hourly sampling frequency is exhibited for searches concerning the latest data, i.e., inquiries covering up to seven days of recent data [20]. Irrespective of the data recency, the GI is daily for search periods comprehending up to 270 days, weekly for searches ranging from 270 to 1825 days, and monthly for more than 1825 days [21].
GT does not detail the GI construction [22, 20]. However, the idea of GI in weekly sampling frequency is as follows [15, 23]. Let a keyword
Gathering GT data requires the selection of keyword(s), search term(s) or categories as proxies for the phenomenon under study, as well as local and cultural aspects to mimic the rational thought of a search engine user [12].
GT provides data directly from its website,5
While Facebook, Pinterest, and Twitter are widely used social media by Internet users (Appendix A), the selected literature primarily utilises Twitter data to predict macroeconomic indicators. No research among the selection discusses explicitly the use of Facebook or Pinterest data in the intended context.
Twitter enables users to express themselves through various forms of content, including text-based tweets[24]. These tweets can consist of text within the 280-character limit, as well as images or videos, associated or not with hashtags.8
Hashtags are metadata tags preceded by a hash symbol.
Querying Twitter as a data source requires searching for specific terms, hashtags, or public profiles to result in a collection of tweets and retweets. The search process allows for filtering based on time restrictions, language, geographical location or specific accounts. However, data availability depends on individual users’ privacy settings and willingness to share geographical positioning and hashtags. It is important to note that Twitter data has a high sampling frequency design [25], as tweets are posted continuously, with new content generated every second.
The primary data from Twitter are unstructured and, thus, not ready to use [25], requiring a certain degree of preprocessing before its use [26]. The data preparation aims to transform the data into a proper structure to explore patterns, speeches, symbols and pictures, thus building relevant indicators related to the phenomenon under investigation.
Collecting public data from Twitter requires developer credentials to interact with APIs,9
Application Programming Interfaces.
Packages: twitteR (
Package tweepy (
Mobile devices have become ubiquitous in daily life. Smartphones, wearable devices and GPS sensors have played a significant role in the widespread adoption of mobile technology. However, there is scarce literature to scrutinise the potential of this data source to predict macroeconomic indicators.
The literature reviewed encompasses two distinct types of mobile-type-generated data. One strand uses telecommunications companies’ proprietary data [5], which, due to regulatory limitations and the General Data Protection Law, is a bureaucratic source that requires non-disclosure, confidentiality and procedures agreements. The other mobile-type-generated data strand considers the combination of spatial and temporal comprehensiveness of massive location logs from GPS smartphone applications [27] not publicly available.
Gathering data from online activity sources relies on targeting data mainly related to the expectation of the macroeconomic indicator. The keyword-driven strategy is the most widely used approach to collecting data, which requires researchers to carefully select keywords that reflect relevant aspects of the predicted macroeconomic indicator. Other methods include geo-located image tweets [26] and Twitter accounts of significant influence and relevance in economics [25].
Data from social media are primarily textual, which demands researchers transform the data into quantitative information for forecasting purposes either by volume aggregation of messages [26] or by textual analysis. A crucial step is cleaning and filtering data to eliminate irrelevant messages e.g. [4, 26], uncommon abbreviations, misspellings and slang terms [25]. Text mining techniques, such as part-of-speech tagging [24] and sentiment analysis [24, 25], are essential to extract practical information. Contrastingly, data from search engines are generally ready to use without requiring preprocessing.
Based on a keyword-driven strategy, publications draw their analysis based on single e.g. [28] or multiple keywords e.g. [29]. However, utilising a single keyword to forecast can be precarious, mainly due to the relationship breakdown with the target prediction, which could result in a divergence from the desired outcome [16]. Accordingly, there are challenges associated with selecting appropriate search terms [30], and the choice of target keyword(s) varies in the literature according to the forecasted macroeconomic indicator, as follows.
Under labour market research, the commonplace is to look for terms such as job(s) e.g. [31, 32], job offer(s) e.g. [33, 23] and unemployment e.g. [4, 47]. When choosing search terms, it is essential to consider both relevance and regionality. Therefore, conducting a practical analysis of keywords in the appropriate context is reasonable, as shown in the following examples. In investigating British unemployment, [16] looks for redundancy and its derivatives because it refers to the dismissal of a job when employers need to reduce their workforce in the UK. If a worker is made redundant, the individual might be eligible for some rights, including redundancy payments. Within the German market, [35] distinguish groups of search terms to proxy (i) the unemployment flows (using the keywords unemployment office, unemployment agency and names of the most popular online job search engines in Germany), (ii) the highly skilled workers’ reaction to possible layoffs and company restructuring (querying personnel consultant) and (iii) the natural term associated with the labour market (unemployment rate).
Selecting search terms to forecast the GDP is not trivial. As this indicator is a grouped measure representing the value of final goods and services generated within a country, electing keywords is an extensive exercise. Consequently, the use of GT categories to forecast figures related to the GDP is beneficial e.g. [36, 37, 38]. For example, [30] explore GT data to forecast the German GDP by counting on the demand of seventeen pre-chosen Google categories (e.g., Autos & Vehicles, Real Estate, Business & Industrial) and their subcategories, resulting in 200 GT series. To deal with numerous such variables, the authors resort to variable selection methods and dimensionality reduction, such as principal component analysis (PCA) and least absolute shrinkage and selection operator (LASSO). Alternatively to the use of categories, the keywords recession e.g. [28], foreclosure help and layoff e.g. [39] are also employed.
When investigating the consumer price index, typically considered an official measure of inflation, the keyword inflation is commonly used e.g. [40, 41, 42]. However, [43] explore alternative keywords such as price and cpi, and to capture perspectives on price dynamics, search terms like increase price or price dropping. Another study examines the dynamics of the consumer price index across 13 economies employing the keywords cpi and inflation in English and translated into country languages [44]. Furthermore, [42] not only incorporates traditional keywords but also complements the analysis with additional terms, for example, referring to the labour market (unemployment), the exchange rate (exchange rate), public expenditure (government expenditure) and interest rates (bonds yield).
The selected publications investigating private consumption rely primarily on numerous Google consump- tion-related categories, such as Food and Drink, Computers and Electronics, Entertainment and Vehicle Shopping, narrowed down into a few variables using the unweighted least-squares method [45] or PCA [46]. Additionally, data are considered for the keywords recession and layoff targeted in the news GT category [46].
Limitations
The leading general concern common to data sources is the sample bias that may arise when the data is not a random representative sample of the population e.g. [5, 23, 26]. In fact, estimates report that 33.7% of the world’s population does not have access to the Internet [1] and that the proportion of online data produced worldwide is unbalanced towards more developed economies. The amount of online activity data diverges according to the world region and is also affected by exogenous factors such as age and income [47]. While some global areas retain vast proportions of Internet users, others are below the world average [1], as seen in Appendix C. These observations further corroborate the digital divide, highlighting disparities in Internet access and usage patterns across social-demographic profiles e.g. [48, 49].
Other general concerns include the non-guaranteed public data continuity, which relates to the data dissemination suspension without previous notice [7], and the noise in data, which refers to the difference between data collected and factual purposes e.g. [47, 34], since the gathered data may not represent the true researcher’s intentions.
Specific concerns surrounding GT arise from the fact that the data source only provides data starting in 2004 e.g. [50, 51], making it challenging to conduct historical analyses before this period and the need for more comprehensive information about the data. For instance, the data provider omits absolute search volumes e.g. [15, 52] and fails to report details on classification and aggregation methods into categories and the cut-off point for not displaying unpopular searches [37]. Additionally, GT data rely on samples e.g. [48, 6], leading to sampling noise that causes slight variations in indexes collected on different dates due to the sampling process when collecting data [12]. To mitigate this issue, researchers average the indexes from various collecting days to reduce variations e.g. [47, 53, 54, 20]. Furthermore, GT data have limitations regarding series extension in high-frequency sampling [55], so most studies focus on low-frequency series to cover longer time spans [22]. [22] and [21] propose different methodologies based on multi-data gathering and overlapping windows to address this limitation.
Limitations regarding Twitter data encompass the following aspects: Firstly, the data’s unstructured nature demands analysis preprocessing [26]. Secondly, there is evidence that Twitter APIs do not provide uniform activity samples, as usually assumed [4]. Moreover, the data quality enhancement depends on filtering and selecting user accounts [4]. In addition, data are subjected to biases related to opinion [25], language and demographics [26].
Concerns about mobile-generated data stem from the difficulties of their widespread availability. The inherent passivity of data generation presents researchers with constraints in defining the data to be collected, determining the timing of collection and ensuring proper preprocessing by the data collector [5]. This complexity poses challenges in maintaining data quality and integrity [5].
The multiple roles of online activity data
The analysis of the second thematic axis pertains to the objectives of the selected papers focused on evaluating prediction accuracy, allowing for the conclusion of the effectiveness of online activity data in predicting macroeconomic activities, as identified through the thematic analysis referred to in Section 2.
The exploration of the key findings regarding the predictive power of web activity data within documents splits into three main themes: the validation of online activity data as a source of pertinent information (Subsubsection 3.3.1), the predictive behaviour concerning specific population segments (Subsubsection 3.3.2) and the conduction of predictive exercises over economic turbulence (Subsubsection 3.3.3). Such themes converge on assessing the accuracy and reliability of forecasts using statistical metrics. These metrics rely on the difference between the actual and predicted values, also known as the error of prediction. Thus, Subsubsection 3.3.4 is devoted to a few notes regarding error prediction metrics.
Assessing online activity data as predictors
Most selected publications focus on establishing online activities as resourceful predictors of macroeconomic trends and indicate usefulness in macroeconomic forecasting. To this end, publications compare predictions generated from benchmarks exempted from online activity data to counterparts incorporating web-based data, aiming to demonstrate the added predictive power of online activity data.
The benchmark predictions derive mainly from the univariate ARMA family of models e.g. [37, 56], augmented or not by either other macroeconomic indicators e.g. [57, 38] or survey-based data e.g. [45, 46], or univariate non-linear time series models [15]. Choosing keywords to build predictors is essential in constructing counterpart predictions relying on online activity data. The logical-related keyword(s) to the macroeconomic indicator presented in Subsubsection 3.2.3 are frequent in counterpart predictions, which results in general forecast accuracy gains compared over benchmarks e.g. [58, 59, 60].
Publications seldom report unsuccessful results regarding the predictive relationship between the macroeconomic indicator and web-based data. A contrasting example assumes the Spanish unemployment prediction, including the research of [53] and [61], in which both consider the same keyword (unemployment) and prediction methods (ARMA family of models) but different periods of analysis. While the prediction accuracy of [53] using the online activity data does not overcome the benchmark, [61] find that web-based data improved forecast performance compared to the benchmark. These results indicate that different periods under analysis lead to different outcomes, as remarked by [32]. Another example concerns the CPI prediction for five countries (the USA, the UK, Canada, Germany and Japan), where [51] consider structural time series predictions as a benchmark and forecasts from an extension of the Bayesian structural time series model as a counterpart, using online activity data from 60 Google categories. The counterpart predictions fail to outperform the benchmark. This publication suggests that the possible causes of the failure might be the weak connections between search activity and the CPI, the non-optimal choice of Google categories and other factors not captured by Google search data that exert a more substantial influence on the CPI.
Nowcasting and forecasting are both essential techniques in macroeconomic indicator predictions using online activity data. The real-time information from web-based activities favours nowcasting applications [59] with productive outputs e.g. [62, 16, 27], which can timely benefit policymakers in terms of decision-making e.g. [58, 18] once time lags in publishing official macroeconomic statistics are frequent e.g. [53, 58]. Regarding forecasting applications, analyses of the prediction behaviour on distinct horizons corroborate the forecasting ability of online activity data, as shown in the following examples, which forecast US unemployment up to 12 steps ahead. While [34] concludes that predictions built are functional only for short-term predictions, [15] document the useful predictive power of web-based data in both short-term and long-term forecasting. Additionally, [15] note that the online activity-based prediction performance improves with the forecast horizon compared to the benchmark.
Regardless of the framework adopted, macroeconomic indicator or keyword strategy embraced, researchers conclude that web-based activity data generally provide relevant relationships with economic measures for forecasting intentions. Such a conclusion is valid for a range of research approaches, such as carrying out horseraces among modelling toolboxes [63, 40, 44], investigating the macroeconomic indicator association with search-terms usage in preceding periods [35, 39, 42] or duelling for models considering the inclusion or not of online activity data [45, 53, 15].
Targeted predictions for fragments of sociodemographic profiles
Although selected papers focus primarily on exploring the prediction ability at national levels, researchers also seek to demonstrate the predictive power of online activity data for regional levels, age, race and sex as follows.
Studies on regional forecasting capability point to favourable results and demonstrate the potential of using online activity data to improve territorial economic forecasts’ accuracy and provide guidance for policy-making e.g. [64, 25, 18]. However, the publications recognise the need for further research to fully understand the applicability of online data across different regions and contexts. Performing regional forecasting, [57] target forecasting youth (15-to-24 years old) unemployment. This publication confirms the improved prediction accuracy for the 17 Spanish regions using web activity data against benchmark predictions using the inflation rate as a predictor; however, against random walk predictions, one of the regions fails to be more accurate.
Youth unemployment is a critical indicator in some countries, such as Spain [57], Italy [23], and France [31], and research forecasting such an indicator based on online activities reports superior prediction performance over benchmarks. Youth unemployment prediction may reduce the sample bias limitation presented in Subsubsection 3.2.4 since young individuals tend to use the Internet more than adults [53] and seek jobs online [23]. In addition to the youth unemployment emphasis, [31] perform predictions for two more age groups (25-to-49 and 50+ years old), both with enhanced prediction power over benchmarks, evidencing the French population ageing as influential to the forecast performance and reporting that increases in age tend to decrease the accuracy’s improvement.
The sample bias issue is present in [49] and [48], both exploring unequal access to the Internet, characterised as the digital divide. In focusing on American youth unemployment, [48] delves into the racial digital divide and demonstrates prominent variations in the predictive power of Internet activity data among the races. Data predict youth unemployment more accurately for White Americans than for Hispanic Americans, while predictions for African Americans are unsatisfactory. Comparing the Spanish unemployment forecast accuracy of web-activity data for different age and gender groups, [49] conclude that accurate predictive power is biased towards groups with better Internet access, i.e., digitally included. The publication concludes that the digital divide effect relates to the youngest unemployed males and produces enhanced prediction performance for females compared to male unemployment, which is robust across different age groups.
Exploring the trade-off of labour-leisure, [17] assesses the Canadian unemployment of individuals aged between 25 and 44. The study favours the predictive performance of online activity data incorporating free online leisure activities keywords against predictions relying only on job search-related keywords.
Predictions under disruptive events
A fraction of selected papers focus on the degree of effectiveness of forecasts based on online activity data to predict economic indicators under disruptive events, such as mass layoffs [5], the 2008 financial crisis e.g. [12, 39] and the COVID-19 pandemic e.g. [55, 6]. These disturbances profoundly impact national and regional economies, resulting in widespread job losses, business closures, economic shocks and short- and long-term effects on individuals, families and communities.
Under a mass layoff in undisclosed European locations, [5] report significant regional forecast accuracy improvement in unemployment changes using online activity data compared to not using such data. Additionally, the research identifies employment disturbances at individual and community levels and reveals that job loss consistently attenuates workers’ behaviour regarding mobility and social interactions.
In 2008, the Great Recession impacted economies worldwide. Publications report that incorporating web-activity data into forecasting models leads to proper macroeconomic predictions in such an unstable period e.g. [12, 55], including the sharp increase of the recession [20, 39]. In addition, this troubled period is known for official statistics needing to have anticipated the magnitude of the economic challenge from the beginning [64]; thus, reinforcing the argument of using online databases for prediction purposes has important implications for policymakers [20].
The impact of the 2020 COVID-19 outbreak on macroeconomic indicators using online activity data also emerges in publications. On the one hand, researchers demonstrate that predictions based on online activity data are more timely and accurate than benchmark forecasts, particularly during the recent pandemic [55, 20]. On the other hand, there is evidence that online activity-based predictions perform poorly compared to forecasts that account for indicators of the timing of state-of-emergency declarations [6].
An insight into error prediction metrics
Two widely used error prediction metrics to qualify predictions are the mean absolute percentage error (MAPE) and the root mean squared error (RMSE). The MAPE measures the average percentage difference between actual and predicted values e.g. [31, 33]. On the other hand, the RMSE calculates the square root of the average squared differences between the actual and predicted values e.g. [43, 40]. The lower the value of these metrics, the better the prediction performance.
The comparison of error metrics measures the predictive accuracy of forecast sets, over which researchers frequently employ statistical tests that account for uncertainty to evaluate and compare the predictive performance of different forecast sets. These tests determine whether the differences in performance between the predictions are statistically significant or due to chance. Examples of such tests include those proposed by [65] e.g. [42, 30], [66] e.g. [45, 62] and [67] e.g. [53].
Final remarks
The technological change has empowered researchers to consider the data generation processes from online activities to anticipate the dynamics of some economic indicators. Although the regular literature on macroeconomic predictors relies on data mainly provided by NSOs, this literature review focuses on the scrutiny of online activity data sources, such as those from GT, Twitter and mobile, to prospect new analysis avenues, principally due to data readiness, not subjected to subsequent revisions, sources reasonably inexpensive and researchers’ potential ability to innovate.
Compared to survey data, online activity data sources provide regular activities without relying on interviews, which may contain inaccurate or non-responses. Nevertheless, the general collection of these data depends strongly on selecting appropriate keywords. The online activity data are valuable for improving macroeconomic forecasting and allowing high-frequency sampling. Thus, web-based data may complement regular information based on distinct data sets and provide additional perspectives for a predicted outcome.
Although the main data apprehensions of researchers are the sample bias and the noise in the data, predictions reveal proper general accuracy. The literature based on online activity data as a macroeconomic predictor, namely from the Google search engine, is well scrutinised among the online data sources, employing diversified analysis tools and methodologies, granting acceptable accuracy. However, embracing data sources for non-developed or developing economies has yet to be widely debated.
Given the limited presence of social media and mobile-generated data in the literature, more significant and stringent efforts are necessary to establish them as reliable macroeconomic predictors. This gap needs to be addressed through diverse and in-depth research on these data sources to scrutinise their viability as leading indicators for macroeconomic analysis. Research involving mobile-generated data faces challenges associated with privacy concerns and data dissemination. Despite the limited exploration of both sources, they offer researchers an opportunity for innovation and to pursue the validation of these data sources as reliable and effective.
Footnotes
Acknowledgments
Portuguese public funds have financed this research via FCT (Fundação para a Ciência e a Tecnologia) and ESF (European Social Fund) under the reference 2021.07583.BD, and in the framework of the FCT project with reference LA/P/0063/2020,
Appendix
Appendix A: Global trends in internet usage (in %)
*Source: ITU World Telecommunication and ICT Indicators Database [1]. **Source: Statcounter Global Stats [3].
Indicator
Year
2009
2010
2011
2012
2013
2014
2015
2016
2017
2018
2019
2020
2021
2022
Internet users*
25.4
28.5
31.0
33.5
35.4
37.5
40.0
43.0
45.6
49.0
53.7
59.6
62.6
66.3
Device type**
Desktop
99.0
97.1
93.9
88.0
79.2
66.6
59.2
51.4
43.8
45.1
46.0
45.6
42.3
39.4
Mobile
1.0
2.9
6.1
10.7
16.2
27.1
35.1
43.6
51.6
50.9
50.4
51.6
55.0
58.3
Tablet
0
0
0
1.3
4.6
6.3
5.7
5.0
4.7
4.0
3.6
2.8
2.7
3.3
Search engine**
Google
90.3
90.9
91.1
91.9
90.2
89.8
90.6
92.0
92.1
91.4
92.6
92.1
92.0
92.1
Bing
2.3
3.5
3.6
3.1
3.4
3.6
3.0
2.8
2.8
2.8
2.4
2.7
2.6
3.2
Yahoo!
4.8
3.9
3.6
3.0
3.1
3.6
3.4
2.6
2.1
2.2
1.8
1.6
1.5
1.4
Baidu
0.4
0.3
0.3
0.4
0.9
0.6
1.0
1.0
1.3
1.5
1.0
1.2
1.5
0.9
Others
2.3
1.4
1.5
1.7
2.4
2.4
2.0
1.6
1.7
2.2
2.1
2.4
2.4
2.4
Social media**
Facebook
48.1
59.6
65.8
65.3
66.4
73.3
83.5
86.2
83.6
68.6
69.0
68.1
72.4
73.2
Pinterest
0
0
0
7.2
11.0
9.4
6.6
6.2
7.4
13.0
13.9
11.4
8.4
6.0
Twitter (X)
7.2
6.4
4.4
6.6
9.7
6.8
5.3
4.2
4.6
7.2
8.2
10.7
8.8
8.3
StumbleUpon
22.4
18.7
20.8
8.8
4.2
1.9
0.8
0.4
0.3
0.2
0
0
0
0
Youtube
4.1
6.6
5.1
7.5
3.0
1.1
0.1
0.3
1.5
6.9
3.9
4.1
4.9
4.3
Tumblr
0
0
0
0
2.1
5.2
1.9
1.4
0.9
0.9
0.6
0.4
0.7
0.3
Instagram
0
0
0
0
0
0
0
0.1
0.7
2.0
3.2
4.6
3.7
6.8
Others
18.1
8.7
3.9
4.6
3.7
2.4
1.7
1.3
1.0
1.3
1.4
0.7
1.2
1.3
Appendix B: Selected publications for the review
Author(s)
Indicators
Countries data
Online data source
Prediction tool
[11]
Unemployment
USA
WorldTracker’s Top 500 Keyword Report
Classic time series models (ARMA models family)
[35]
Unemployment
Germany
Search engines
Classic time series models (VECM)
[40]
Inflation
USA
Search engines
Classic time series models (ARMA models family)
[45]
Private Consumption
USA
Search engines
Classic time series models (ARMA models family)
[47]
Unemployment
UK
Search engines
Classic time series models (ARMA models family)
[12]
Unemployment
USA
Search engines
Classic time series models (ARMA models family)
[53]
Unemployment
Portugal, Italy, Spain, France
Search engines
Classic time series models (ARMA models family)
[63]
Unemployment
USA
Search engines
Machine Learning methods (Neural Networks, Support Vector Regressions)
[31]
Unemployment
France
Search engines
Filtering methods (Diffuse Kalman Filter)
[58]
Unemployment
USA
Search engines
Bayesian time series models (Bayesian structural time series)
[29]
Unemployment
USA
Search engines
Machine Learning methods (Neural Networks, Support Vector Regressions)
[43]
Inflation
China
Search engines
Classic time series models (ARDL)
Mixed frequency models (MIDAS)
[33]
Unemployment
Spain
Search engines
Classic time series models (ARMA models family)
[62]
Unemployment
Türkiye
Search engines
Bayesian time series models (Bayesian Model Averaging)
[4]
Unemployment
USA
Social Media
Classic time series models (ARDL)
[56]
Unemployment
Czech Republic, Hungary, Poland, Slovakia
Search engines
Classic time series models (ARMA models family)
[39]
GDP
USA
Search engines
Filtering methods (Markov-switching model)
[5]
Unemployment
Undisclosed European country
Call data
Classic time series models (ARMA models family)
[28]
GDP
Germany, Switzerland
Search engines
Classic time series models (ARDL)
[16]
Unemployment
UK
Search engines
Mixed frequency models (MIDAS)
[15]
Unemployment
USA
Search engines
Classic time series models (ARMA models family)
[44]
Inflation
China, Japan, India, Germany, France, UK, Russia, Italy, Spain, USA, Brazil, Canada, Mexico
Search engines
Classic time series models (ARMA, VECM)
Mixed frequency models (MIDAS)
[52]
Unemployment
Thailand
Search engines
Classic time series models (ARMA models family)
[48]
Unemployment
USA
Search engines
Classic time series models (ARMA models family)
[23]
Unemployment
Italy
Search engines
Classic time series models (ARMA models family)
[24]
Unemployment
Korea
Social Media, Search engines
Classic time series models (ARMA models family)
[41]
Inflation
UK
Search engines
Filtering methods (Multivariate Singular Spectrum Analysis)
[61]
Unemployment
Spain
Search engines
Classic time series models (ARMA models family)
[30]
GDP
Germany
Search engines
Classic time series models (ARMA models family)
[46]
Private Consumption
USA
Search engines
Classic time series models (ARMA models family)
[17]
Unemployment
Canada
Search engines
Classic time series models (Linear regression)
continued
Author(s)
Indicators
Countries data
Online data source
Prediction tool
[50]
Unemployment
Australia, Austria, France, Germany, Italy, Portugal, Spain, Switzerland, UK, USA
Search engines
Mixed frequency models (m-har method)
[32]
Unemployment
USA
Search engines
Classic time series models (ARMA models family)
[68]
GDP
Spain
Search engines
Classic time series models (FCVAR)
[34]
Unemployment
USA
Search engines
Mixed frequency models (MIDAS)
[42]
Inflation
USA, Poland
Search engines
Filtering methods (DMA)
[64]
Unemployment
Romania
Search engines
Panel data analysis (Dynamic Panel Data Model)
[51]
Unemployment and Inflation
USA, UK, Canada, Germany, Japan
Search engines
Bayesian time series models (Bayesian structural time series)
[26]
GDP
184 countries
Social Media
Panel data analysis
[54]
Unemployment
USA
Search engines
Machine Learning methods (Targeted predictors, Bagging, Complete Subset Regressions, and Random Forests)
[27]
Unemployment
Japan
GPS
Mixed frequency models (MIDAS)
[59]
Unemployment
Netherlands
Search engines
Classic time series models (Structural time series model)
[60]
Unemployment
Netherlands
Search engines
Novel method (Single-equation Penalised Error Correction Selector)
[14]
Unemployment
Spain
Search engines
Classic time series models (ARMA models family)
[25]
GDP
Spain
Social Media
Machine Learning methods (BiLSTM)
[55]
Unemployment
USA
Search engines
Novel method (Penalized Regression with Inferred Seasonality Module)
[36]
GDP
USA
Search engines
Bayesian time series models (Bayesian structural time series)
[37]
GDP
USA, Brazil
Search engines
Filtering methods (Dynamic Factor Models)
[18]
Unemployment
Spain, Portugal
Search engines
Classic time series models (ARMA)
Panel data analysis (Dynamic Panel Data)
[20]
Unemployment
USA
Search engines
Linear Regression
[6]
Unemployment
USA
Search engines
Classic time series models (ARMA)
Panel data analysis (Dynamic Panel Data)
[57]
Unemployment
Spain
Search engines
Bayesian time series models (BVAR for national data)
Panel data analysis (Bpanel model for regional)
[22]
Inflation and Consumption Expenditure
USA, Euro Area
Search engines
Classic time series models (ARMA models family)
[38]
GDP
Belgium, France, Germany, Italy, Netherlands, Spain, USA
Search engines
Mixed frequency models (bridge equations)
[49]
Unemployment
Spain
Search engines
Classic time series models (ARMA models family)
[69]
Unemployment
USA
Search engines
Machine Learning methods (mixed-frequency machine learning)
Appendix C: Internet usage growth across world regions
Commonwealth of Independent States. Source: ITU World Telecommunication and ICT Indicators Database [1].
World region
Year
2009
2010
2011
2012
2013
2014
2015
2016
2017
2018
2019
2020
2021
2022
Europe
59.6
63.2
64.7
67.3
69.4
71.6
72.6
74.7
76.7
79.8
81.7
84.2
86.8
89.5
Americas
46.2
48.7
51.1
55.0
56.0
58.2
62.4
68.0
71.7
74.0
75.9
79.5
81.0
83.2
CIS*
32.8
39.3
47.3
54.4
57.3
60.8
62.2
65.6
68.3
73.2
76.3
78.6
81.3
83.7
Arab States
20.3
23.3
25.8
28.8
31.6
34.9
38.4
41.4
46.7
49.6
55.2
61.6
65.8
70.3
Asia & Pacific
19.0
22.5
25.1
27.2
29.4
31.4
33.7
36.5
38.8
42.7
48.9
56.6
60.1
64.3
Africa
4.3
6.1
7.6
9.3
11.3
13.5
16.2
18.6
21.4
24.3
27.7
31.8
35.3
39.7