
Abstract
Brain activity analysis is an important research area in the field of human neuroscience. Moreover, a subcategory in this field is the classification of brain activity in terms of different brain disorders. Since the Electroencephalography (EEG) signal is, in fact, a non-linear time series, employing techniques to investigate its non-linear structure is rather crucial. In this study, we evaluate the non-linear structure of the EEG signal between healthy and schizophrenic adolescents using fractal theory. The results of our analysis revealed that in terms of all recording channels, the EEG signal of healthy subjects is more complex compared to the ones suffering from schizophrenia. The statistical analysis also indicated that there is a significant difference in the complex structure of the EEG signal between these two groups of subjects. We also utilized approximate entropy in our analysis in order to verify the obtained results of the fractal analysis. The result of the entropy analysis suggested that EEG signal for healthy subjects is less random compared to the EEG signal in schizophrenic individuals. In addition, the employed methodology in this research can be further investigated in order to classify the brain activity in terms of other brain disorders, where one can explore how the complex structure of the EEG signal alters between them.
Introduction
Investigating human brain disorders is a critical research area. Schizophrenia is a severe mental disorder that affects humans in major parts of their thinking, feeling, and behavior. Over the past few decades, many researchers have analyzed the brain activity in patients suffering from schizophrenia in order to understand how this disorder impacts brain performance. Furthermore, they employed different techniques in order to achieve these goals. Akar et al. [1] investigated the complexity of EEG signal in schizophrenic and healthy individuals using Approximate Entropy (AE), Shannon Entropy (SE), Kolmogorov Complexity (KC) and Lempel-Ziv Complexity (LZC). Based on the obtained results, the EEG signal of schizophrenic patients showed a lower level of complexity compared to normal subjects. Ziqiang and Puthusserypady [2] analyzed the phase synchronization of the EEG signal in patients with schizophrenia using Empirical Mode Decomposition (EMD). The results indicated that EMD is more accurate in terms of the real dynamics of the oscillation process compared to the time-frequency decomposition. This is due to the fact that EMG regulates the signal without relying on the predefined basis function as Wavelet transform normally does, therefore, EMD can essentially preserve the non-linearity of the signal. In order to diagnose the schizophrenia characteristics, Dvey-Aharon et al. [3] performed a connectivity-based analysis of the EEG signal. The results indicated that the strength of connectivity maps to discriminate between schizophrenic and healthy individuals. Howells et al. [4] carried out a frequency-band analysis on EEG signal of patients with schizophrenia. It was suggested that delta/alpha frequency activity highly differentiates with respect to these patients. Borisov et al. [5] evaluated the structural synchrony of the EEG signal for patients with schizophrenia in comparison with healthy adolescents. The results also suggested a significant decrease in the EEG structural synchrony of schizophrenic patients compared to healthy adolescents. In another conducted study, Na et al. [6] performed mutual information analysis on EEG signal of schizophrenic patients. Based on the obtained results, schizophrenic patients had a lower complexity with respect to normal controls in T5 and C3 electrodes. In overall, based on all of the previously published studies, analysis of EEG signal is able to reveal the differences between patients with schizophrenia and healthy individuals.
However, brain activity analysis in patients with schizophrenia was not just limited to EEG signal analysis. There are several reported studies in the literature which are mainly focused on MEG [7, 8], MRI [9], CT [10] and fMRI [11] analysis of patients with schizophrenia in order to explore different aspects of their brain activity.
Thus, the primary issue that arises is finding a suitable tool for the analysis of the EEG signal. Since EEG signal is a non-linear and chaotic signal, its inherent characteristics can be analyzed using fractal theory. Moreover, the fractal analysis is an approach to investigate the non-linear structure of chaotic time series [12]. A fractal object is a set (time series or pattern) that presents a self-similar pattern at every scale within itself [13]. The self-similarity between different scales can be quantified using scaling exponent also known as the fractal dimension. Fractals can be simple or complex [14], which are presented with integer or non-integer values. In fact, fractal dimension reflects the level of set complexity (time series or pattern) [15].
While focusing on biomedical engineering, there are many reported studies that employed fractal theory in order to investigate the non-linear structure of different bio-signals and patterns. These include exploring the fractal structure of respiration signal [16, 17], heart rate [18], eye movement time series [19, 20, 21, 22, 23], human face pattern [24], human DNA [25, 26, 27], Magnetoencephalography (MEG) signal [28], Electromyography (EMG) signal [29, 30], EEG signal [31, 32, 33, 34, 35, 36, 37, 38, 9, 40], s-ABR signal [41, 42], spider brain signal [43, 44] and animal movement behavior in foraging [45].
Among all reported works that investigated the influence of different brain disorders on variations of human EEG signal, no work has discussed yet about the influence of schizophrenia on the structure of EEG signal from the fractal point of view. Therefore, in this research, we employ fractal theory to investigate how the complexity of EEG signal changes between healthy brain and the brain with schizophrenia. In the following sections, first, we discuss our method of analysis, then we talk about the database utilized in our analysis. In the last section, we explore the obtained results and draw some conclusion for future studies.
Method
In this research, we aim to investigate the variations of the nonlinear structure of the EEG signal between healthy and schizophrenic individuals. For this purpose, we employ fractal analysis where the fractal exponent is the measure of process complexity. Higher values are associated with more complex processes.
In fact, the general fractal dimension can be defined using the entropy concept [46]. Given the EEG signal with the maximum and minimum values of voltage,
The probability of occurrence (
In Eq. (2),
In Eq. (3),
The general form of the fractal dimension (
where
In this research, we use a simpler form of Eq. (4) that is based on box counting method. In this method, the signal (EEG signal in this research) is covered with a number of boxes that have the size of
Therefore, in our first approach, we compare the variations of the complex structure of the EEG signal between healthy and schizophrenic individuals, using fractal dimension.
We also investigate how the entropy of the EEG signal is changed between two groups of subjects. For this purpose, we compute approximate entropy, which indicates the randomness of time series, where its greater values stand for more randomness. In fact, we employ approximate entropy to verify the obtained results in case of fractal dimension
In this research, we used the open access database on EEG signal, which was obtained and prepared by Dr. Gorbachevskaya (leading researcher at the Mental Health Research Center) and Dr. S.V. Borisov (senior researcher at the faculty of Biology M.V. Lomonosov Moscow State University) in the Laboratory for Neurophysiology and Neuro-Computer Interfaces at M.V. Lomonosov Moscow State University. The EEG signal was recorded from two groups of adolescent individuals. Thirty-nine healthy subjects and 45 subjects with schizophrenia participated in this experiment. The EEG data were recorded using 16 electrodes with a sampling rate of 128 Hz and accordingly filtered. The database is available in [50].
The data analysis was performed by calculating the fractal dimension and approximate entropy of the EEG signal in the healthy and schizophrenic individuals. It should also be noted that calculating the fractal dimension was based on the box-counting method [46].
In terms of statistical analysis, the
Channel-based comparison of the fractal dimension of EEG signal between healthy and schizophrenic individuals
Channel-based comparison of the fractal dimension of EEG signal between healthy and schizophrenic individuals
Comparison of the fractal dimension of the EEG signal between healthy subjects and schizophrenic patients in case of each channel. The error bars indicate standard deviation.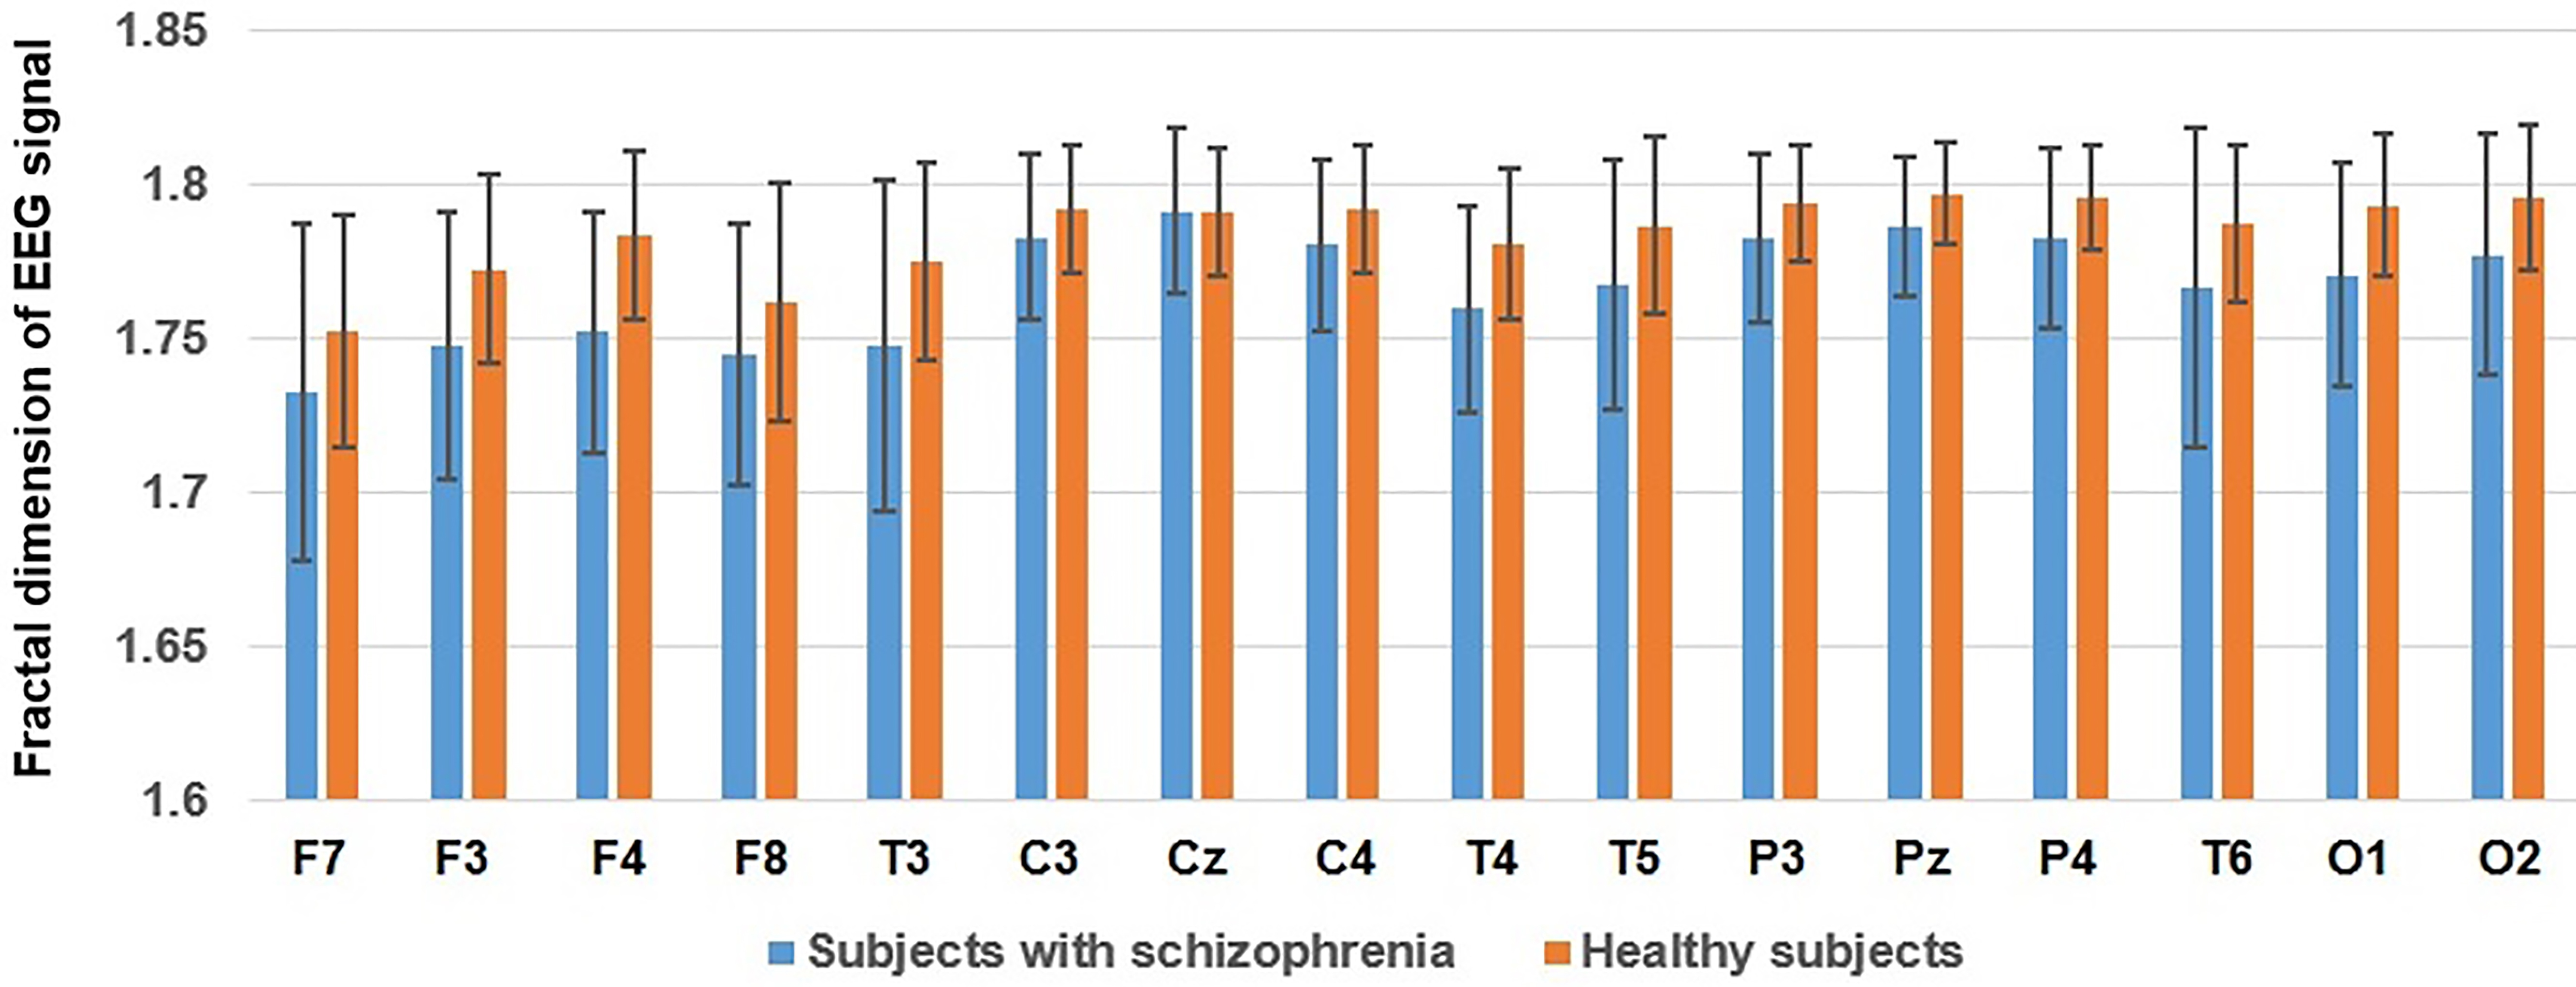
The results of our analysis investigate the complex variations of EEG signal between the healthy and schizophrenic individuals. At first, the analysis result in terms of each electrode is provided, subsequently, a comparison between the healthy and schizophrenic individuals is made when all electrodes are considered together.
As shown in Fig. 1, in terms of each channel, the EEG signal has a greater fractal dimension in the case of healthy subjects compared to schizophrenic patients. Since fractal dimension is essentially associated with complexity, therefore, the EEG signal of healthy subjects is more complex than the EEG signal of schizophrenic patients.
Mean values of fractal dimension for all channels in case of the healthy and schizophrenic individuals. The error bars indicate the standard deviation.
Comparison of approximate entropy of EEG signal between the healthy and schizophrenic individuals in case of each channel. The error bars indicate standard deviation.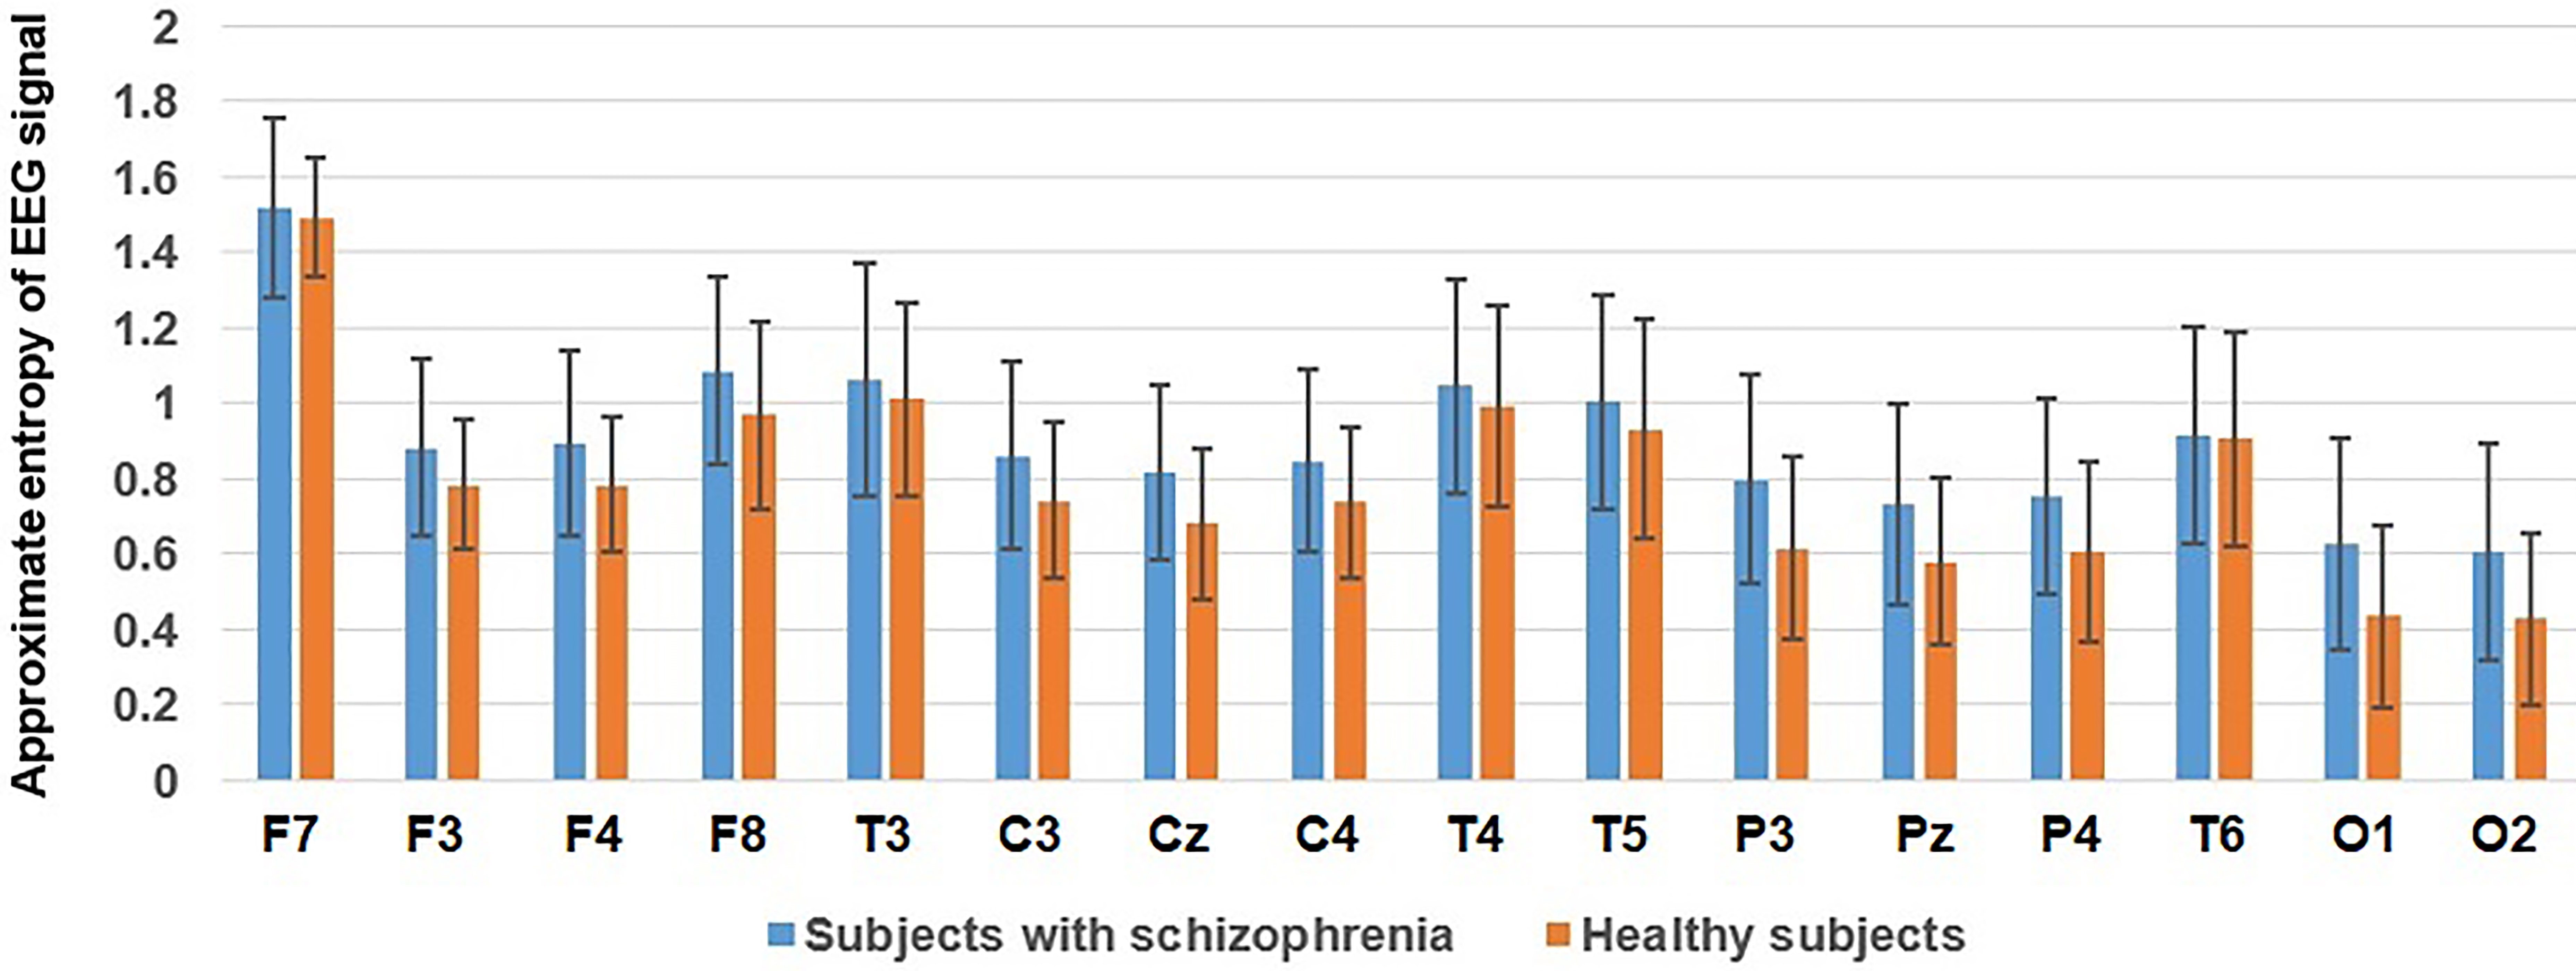
As is shown in Table 1, the results of
Apart from each individual channel, we also calculated the mean value of fractal dimension for all channels in order to compare between the healthy and schizophrenic individuals, which is shown in Fig. 2. The results indicate that the significant increases (
As previously mentioned, in order to verify the obtained results in case of fractal dimension, we did the analysis using approximate entropy. The results of this analysis are provided in Fig. 3.
As shown in Fig. 3, generally, the EEG signal possesses a greater value of approximate entropy in case of schizophrenic patients compared to the healthy subjects. Similarly, we determined the mean value of approximate entropy for all channels in order to compare healthy subjects with schizophrenic patients, which is shown in Fig. 4. The result depicts the increments in approximate entropy of EEG signal for schizophrenic subjects compared to the healthy ones.
Mean value of approximate entropy for all channels in case of healthy and schizophrenic adolescents. The error bars indicate the standard deviation.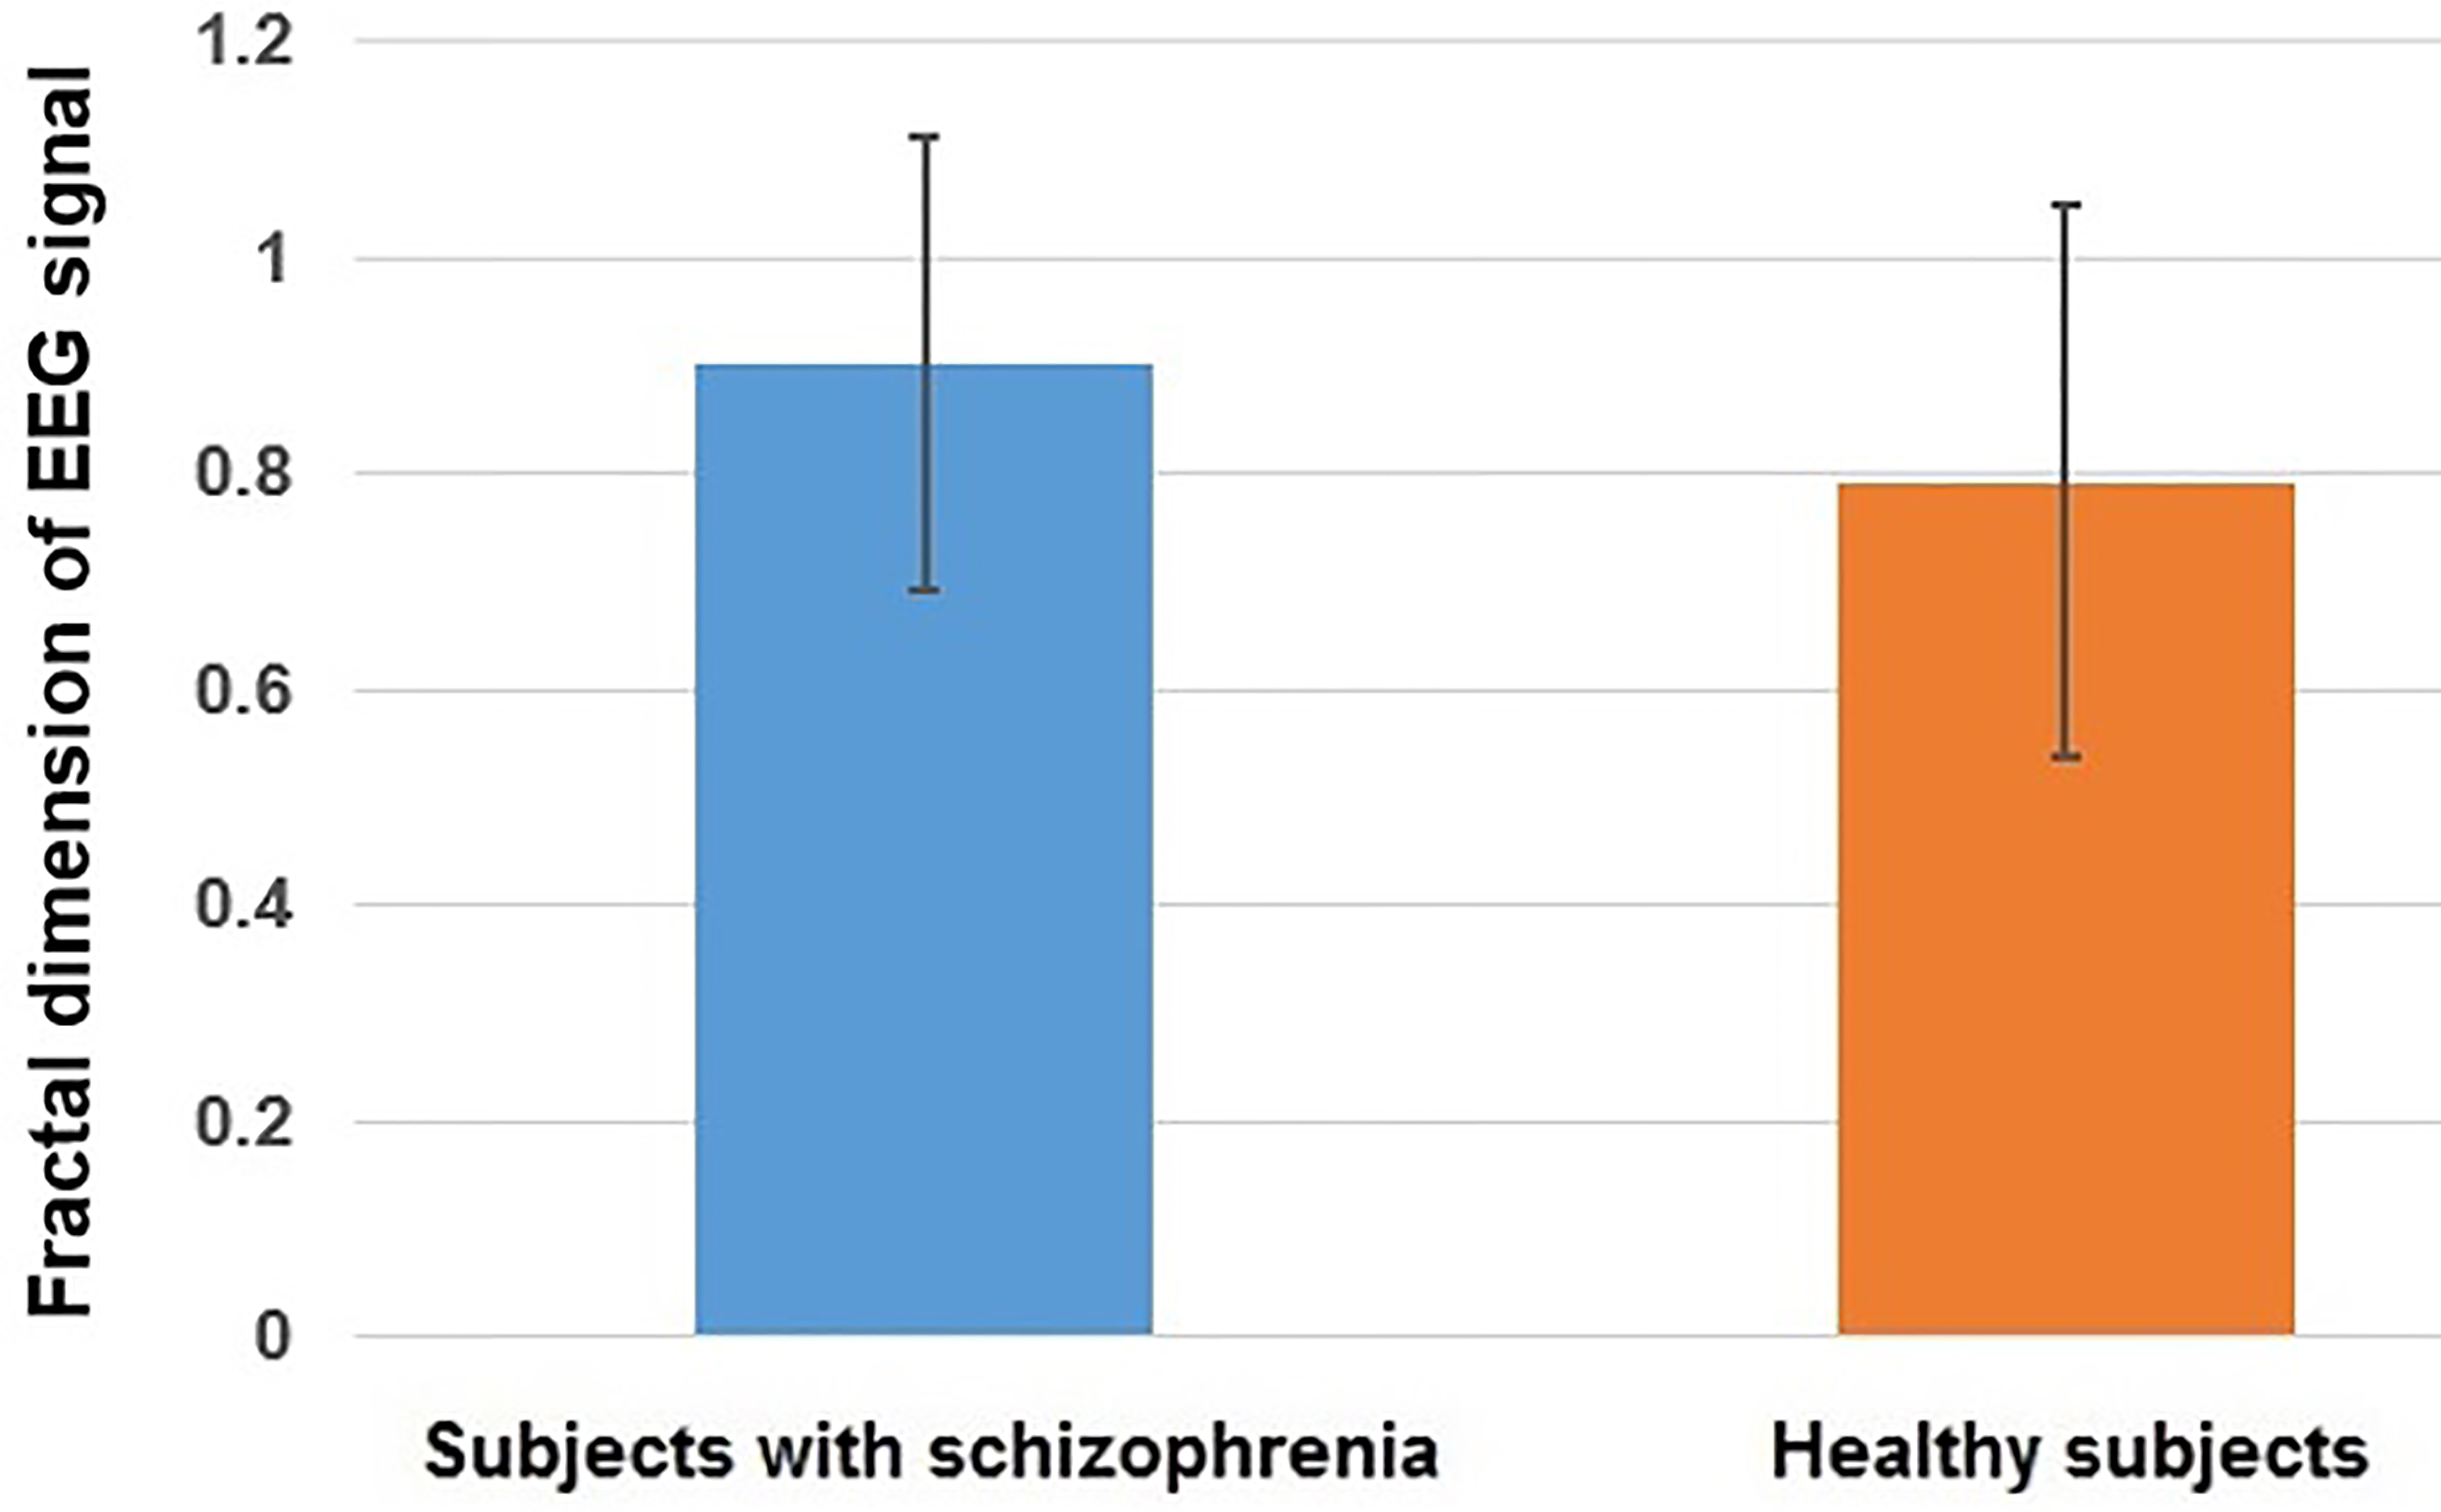
In fact, the result of approximate entropy analysis is in good agreement with the obtained results from the fractal analysis. We previously mentioned that approximate entropy is associated with the randomness of time series. The randomness of time series can also be defined using the Hurst exponent, that is to say, as its value approaches 0.5, the signal becomes more random [31]. In addition, given the relationship between fractal dimension (
Based on Figs 1 and 2, the fractal exponents for healthy individuals are greater than the fractal exponents for schizophrenic patients. Moreover, given the relationship between fractal dimension (
In summary, the EEG signal proposes a significant increase in its complexity in terms of healthy subjects compared to schizophrenic patients.
In this paper, we analyzed the brain activity in the rest condition between healthy and schizophrenic individuals. For this purpose, we employed fractal theory in order to quantify the complexity of the EEG signal. We performed our analysis based on the utilization of different channels. The results suggested that the EEG signal for healthy subjects is more complex compared to the EEG signal of schizophrenic individuals in terms of each recording channel. Therefore, based on the results, the fractal dimension of the EEG signal in terms of each channel for healthy subjects is greater than the fractal dimension of the EEG signal in schizophrenic individuals. We also carried out a statistical analysis where the results showed that except Cz channel, the EEG signal demonstrates a significant increase in its complexity in case of healthy subjects compared to schizophrenic patients. In addition, in order to verify the obtained results in terms of fractal dimension, we performed the analysis on the randomness of the EEG signal using approximate entropy. The results indicated that the EEG signal for subjects with schizophrenia is more random and therefore has greater approximate entropy than the EEG signal for healthy subjects. In fact, for the first time in this study, we made a correlation between the fractal dimension and approximate entropy using randomness concept. Therefore, it can be proved that our investigation is more advanced compared to the studies that analyzed the structure of the EEG signal using several components without a meaningful correlation between them. The underlying reason regarding our observations in this research is related to the structural change in the brain that is highly detectable in both the gray and white matter prior to the onset of the disease. These changes affect the brain, which subsequently is reflected in the complexity of the EEG signal in our study.
Since fractal theory was proved to be able to distinguish the brain activity between healthy and schizophrenic individuals, we can explore its ability in terms of other brain disorders in further studies. Therefore, we can compare the brain activity of subjects with different brain disorders with healthy ones. This study can potentially help researchers to provide beneficial recommendations for the treatment of brain disorders based on the obtained results on the level of brain activity.
As stated before, we did our analysis in a rest state in this research [51]. Since the brain activity significantly changes in response to different external stimuli compared to the rest state, in future studies, we can employ fractal analysis to investigate the difference in the non-linear structure of the EEG signal between healthy subjects and subjects with different disorders while subjected to various external stimuli. In the event of finding a relation between external stimuli and the brain response, we can then proceed with developing a model between external stimuli and the brain response using the current developed mathematical models [52, 53, 54, 55]. This model can be potentially used to predict the brain response to external stimuli for healthy subjects, as well as subjects with brain disorders. In general, all these efforts can help the researchers to explore the brain activity in response to environmental changes that is important in the behavioral neuroscience.
Footnotes
Conflict of interest
None to report.