
Abstract
Analysis of human brain activity is an important topic in human neuroscience. Human brain activity can be studied by analyzing the electroencephalography (EEG) signal. In this way, scientists have employed several techniques that investigate nonlinear dynamics of EEG signals. Fractal theory as a promising technique has shown its capabilities to analyze the nonlinear dynamics of time series. Since EEG signals have fractal patterns, in this research we analyze the variations of fractal dynamics of EEG signals between four datasets that were collected from healthy subjects with open-eyes and close-eyes conditions, patients with epilepsy who did and patients who did not face seizures. The obtained results showed that EEG signal during seizure has greatest complexity and the EEG signal during the seizure-free interval has lowest complexity. In order to verify the obtained results in case of fractal analysis, we employ approximate entropy, which indicates the randomness of time series. The obtained results in case of approximate entropy certified the fractal analysis results. The obtained results in this research show the effectiveness of fractal theory to investigate the nonlinear structure of EEG signal between different conditions.
Introduction
For years the analysis of human brain activity has been one of the main topics in brain research. For this purpose, scientists mapped the brain activity using different scanning methods, and then analyzed its activity. Electroencephalogram (EEG) is one of the famous methods that map the brain activity versus time. There have been a great number of works that employed different mathematical and computational methods for analysis of EEG signal in case of healthy subjects and patients, in stimulation and non-stimulation conditions. The reported works on studying the variations of EEG signal using absolute frequency spectra, Omega-complexity, synchronization likelihood and network properties [1], multiscale entropy (MSE) [2], linear discriminant analysis [3], power spectrum, spectral degrees of freedom, detrended fluctuation analysis [4], amplitude modulation analysis technique [5], machine learning [6], Lempel-Ziv complexity and central tendency measure [7] are noteworthy to be mentioned. [8, 9, 10] are also of interest.
Fractal theory [11] can be used to study the scaling properties of the EEG signal. A fractal object is a set that shows a self-similar or self-affine pattern at every scale. Self-similar objects have same scaling exponent in different directions inside themselves. However, self-affine objects, such as EEG signals in this research, do not have the same scaling exponent in different directions [12]. In fact, how the similarity or self-affinity is divided between different segments of an object can be quantified using the scaling exponent. Fractals can be simple or complex, which is quantified using integer or non-integer values [13]. In general, fractal dimension should satisfy the Szpilrajn inequality [14]:
Where
In all reported studies, an important category of works discusses the comparison between the brain activities of healthy subjects versus patients. Since in most of the brain disorders brain activity is changing dominantly without any external stimulation, some scientists have focused on comparing the brain activity between normal subjects and patients, in absence of external stimuli [45]. Since epilepsy disorders are common, in this research we analyze the variations of EEG signal in case of patients with epilepsy versus normal subjects in absence of external stimuli. Since human EEG signal shows a fractal pattern, we benefit from fractal theory to study the complexity of EEG signal. Also, in order to verify the obtained results in case of fractal analysis, we will employ entropy. The rest of the paper is divided as follows: first we discuss our methodology. Then we discuss data analysis, and accordingly the obtained results are presented. The discussion about obtained results and recommendations for future works concludes the work.
We aimed to investigate the variations of the nonlinear structure of EEG signal between different sets: healthy subjects with open-eyes and close-eyes conditions, patients with epilepsy while they do not face seizure, and also while they face seizure. For this purpose, we employ fractal dimension as the measure of time series complexity, where its greater values stand for a more complex process [46].
We can compute the fractal dimension using several methods [47] that approximate scaling and detail from limits estimated from regression lines over log-log plots of size versus scale. In fact, the general fractal dimension can be defined using entropy concept [48]. Box counting method is the most famous method for calculation of the fractal dimension [49]. In this method, signal (EEG signal in this research) is covered with a number of boxes that have the size of
It should be noted that the fractal dimension in Eq. (2) is a special case of a continuous spectrum of generalized dimension of order
In Eq. (3),
In Eq. (4),
Therefore, in the first approach, we analyze the variations of the complexity of EEG signal between different conditions, using fractal dimension.
We also investigate how the entropy of EEG signal is changed between different sets. For this purpose, we compute approximate entropy, which indicates the randomness of time series, where its greater values stand for more randomness [52]. In fact, we employ approximate entropy to verify the obtained results in case of fractal dimension.
In this research, we used the public data on EEG signal, which was collected by Andrzejak et al. [53] and is available in [54]. The data we used includes the EEG signals from four sets: healthy subjects with open-eyes and close-eyes conditions, patients with epilepsy while they do not face seizure, and also while they face seizure. The data sets are denoted A, B, C and E respectively, where each data set containing 100 single channel EEG segments of 23.6-sec duration with the sampling frequency of 173.61 Hz. Samples of EEG time series from each set of data are shown in Fig. 1.
Samples of EEG signals from each set of data.
As can be seen in Fig. 1, since set E belongs to seizure activity, the voltage of EEG signal experiences greater values compared to other sets.
In the pre-processing step, we performed band-pass filtering on the EEG signals in the range of 0.53–40 Hz. After that, we performed our analysis by computation of fractal dimension based on box-counting method. We computed the fractal dimension of EEG signal using a MATLAB based code that was written using box counting method [55]. This algorithm employs a range of box sizes
In another step, in order to verify obtained results in case of fractal analysis, we analyzed the variations of randomness of EEG signal using approximate entropy.
In case of statistical analysis, mean values of fractal exponent and approximate entropy for the EEG signal were compared between different sets using one-way ANOVA test. In general, the result of ANOVA test is significant if
Figure 2 shows the variations of fractal dimension for EEG signal in case of different sets. Please note in case of each set we reported the averaged fractal dimension between all recorded segments in that set.
Considering
One-way ANOVA results in case of comparisons of fractal dimension between different sets
One-way ANOVA results in case of comparisons of fractal dimension between different sets
Variations of the fractal dimension of EEG signal in case of different sets. Error bars indicate standard deviations.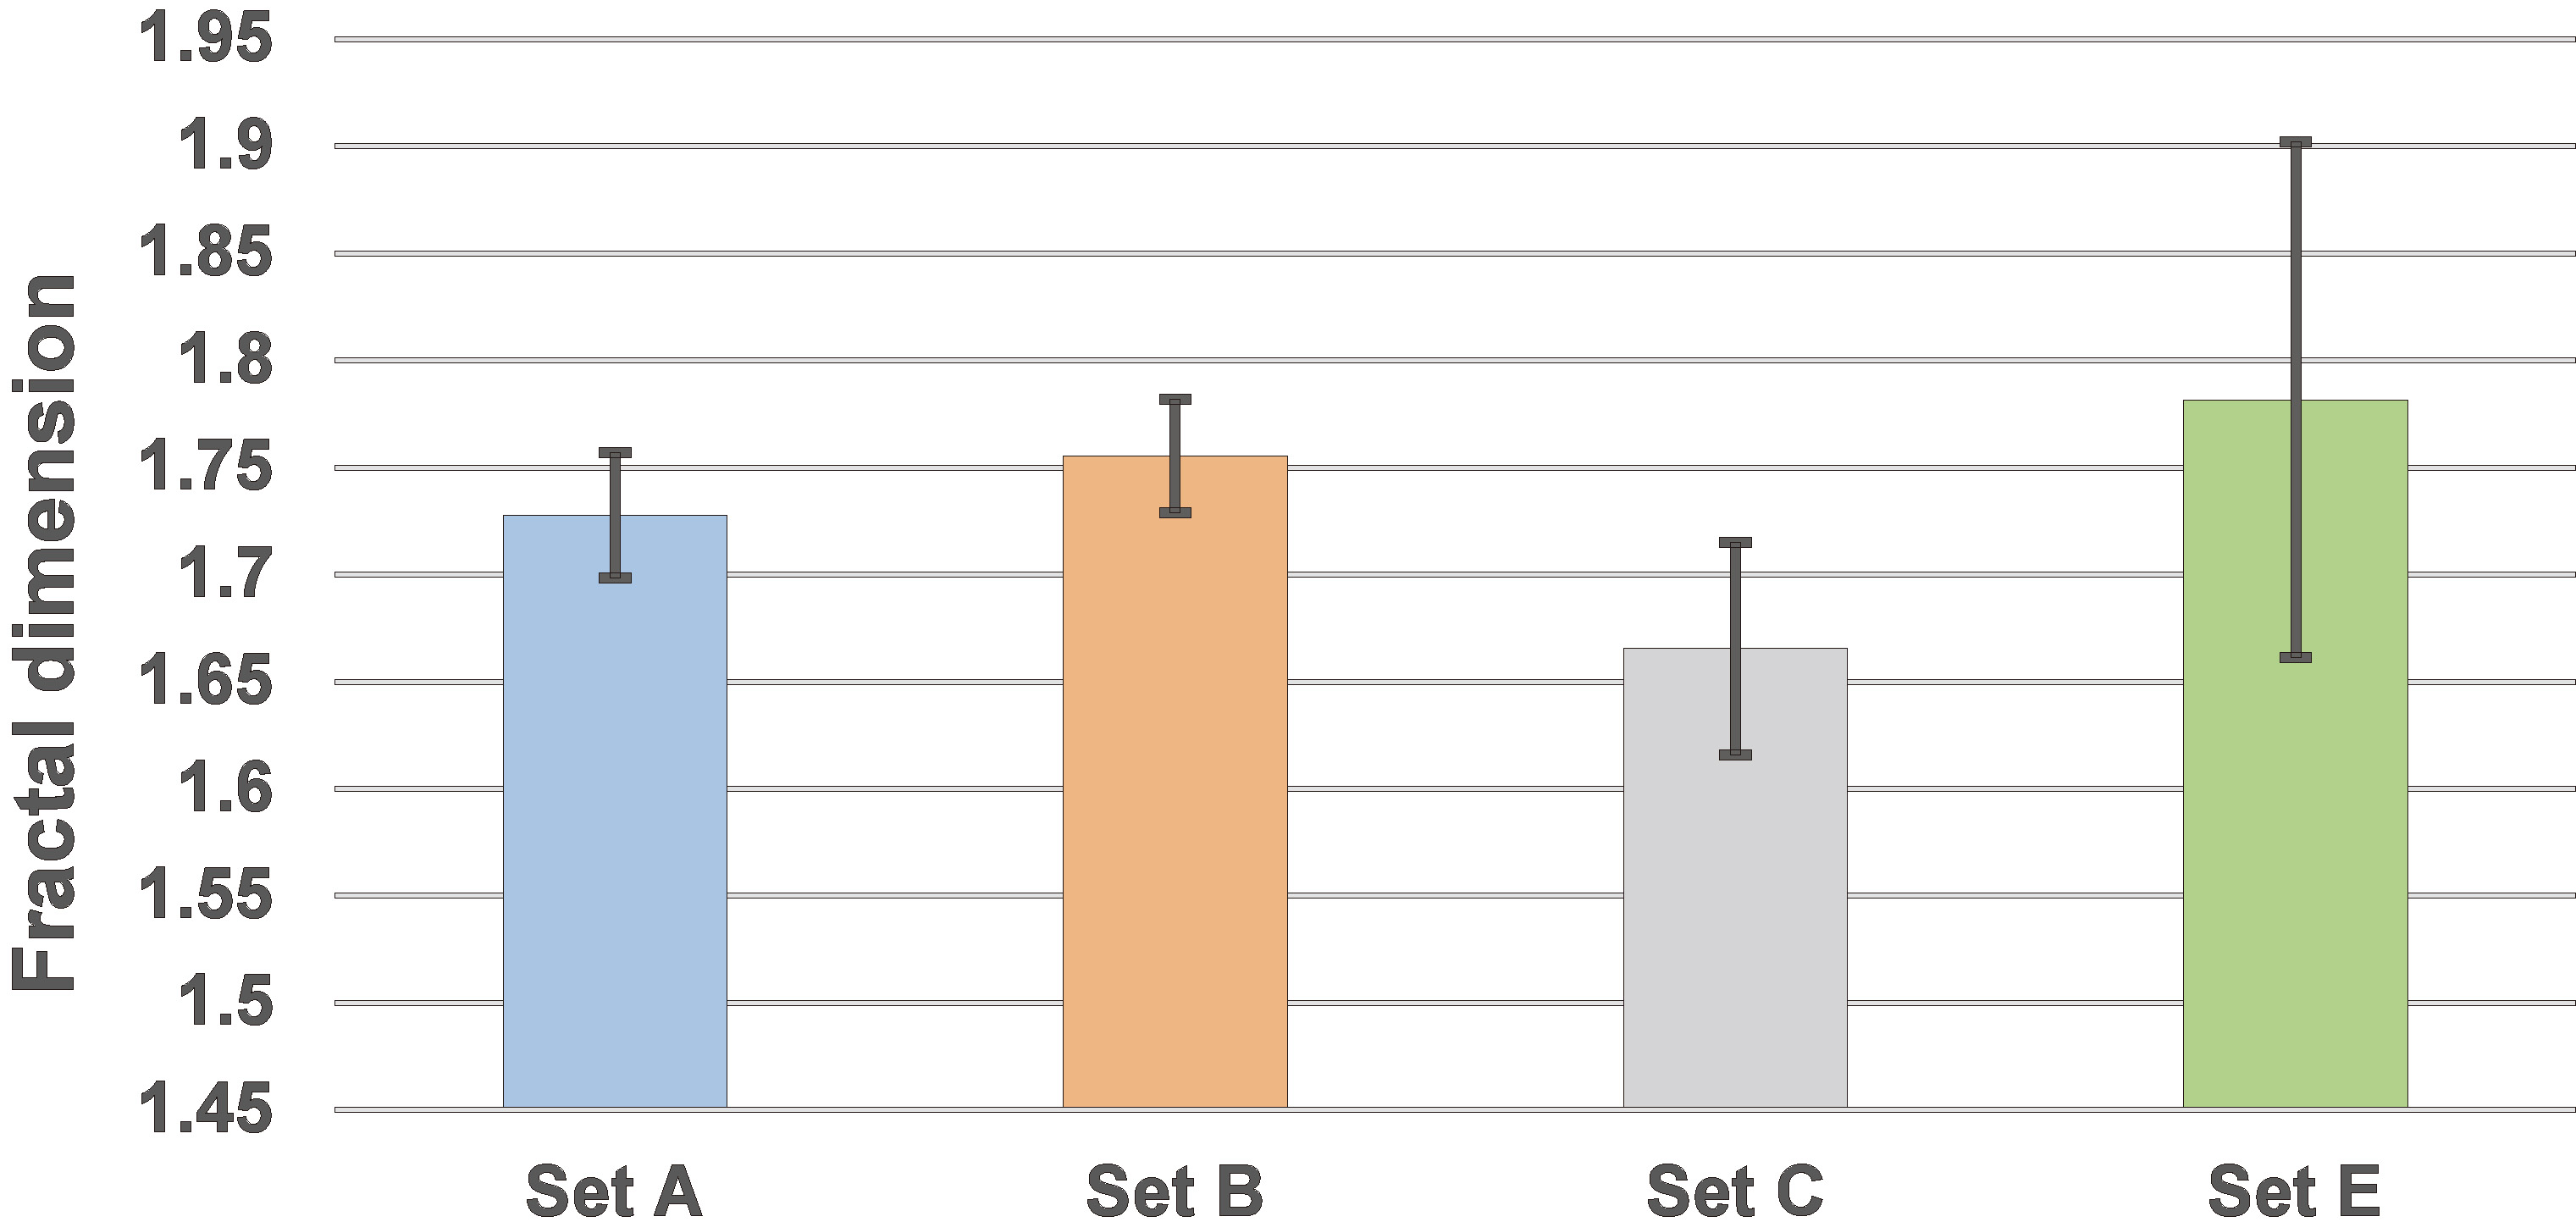
We also performed pairwise comparisons between every two sets. The results of Post-hoc Tukey HSD test for pairwise comparisons of fractal dimension between different sets are brought in Table 2. As can be seen in this table, in case of each pairwise comparison, there is a significant difference (
Post-hoc Tukey HSD test result for pairwise comparisons of fractal dimension between different sets
As mentioned before, we also performed analysis in case of approximate entropy. Figure 3 shows the variations of approximate entropy for EEG signal in case of different sets. Please note in case of each set we reported the averaged approximate entropy between all subjects in that set.
Considering
In fact, the results of analysis of approximate entropy are in line with the obtained results from fractal analysis. We mentioned that approximate entropy stands for the randomness of time series. Randomness of time series can also be defined using the Hurst exponent, whereas the signal will be more random when its value gets closer to 0.5 [57]. Considering the relation between fractal dimension (F) and the Hurst exponent (H) for a time series, (F
Based on Fig. 2, set E shows greater fractal dimension, which is followed by sets B, A and C. Considering the relation between fractal dimension (F) and the Hurst exponent (H) for a time series, (F
One-way ANOVA results in case of comparisons of approximate entropy between different sets
Variations of the approximate entropy of EEG signal in case of different sets. Error bars indicate standard deviations.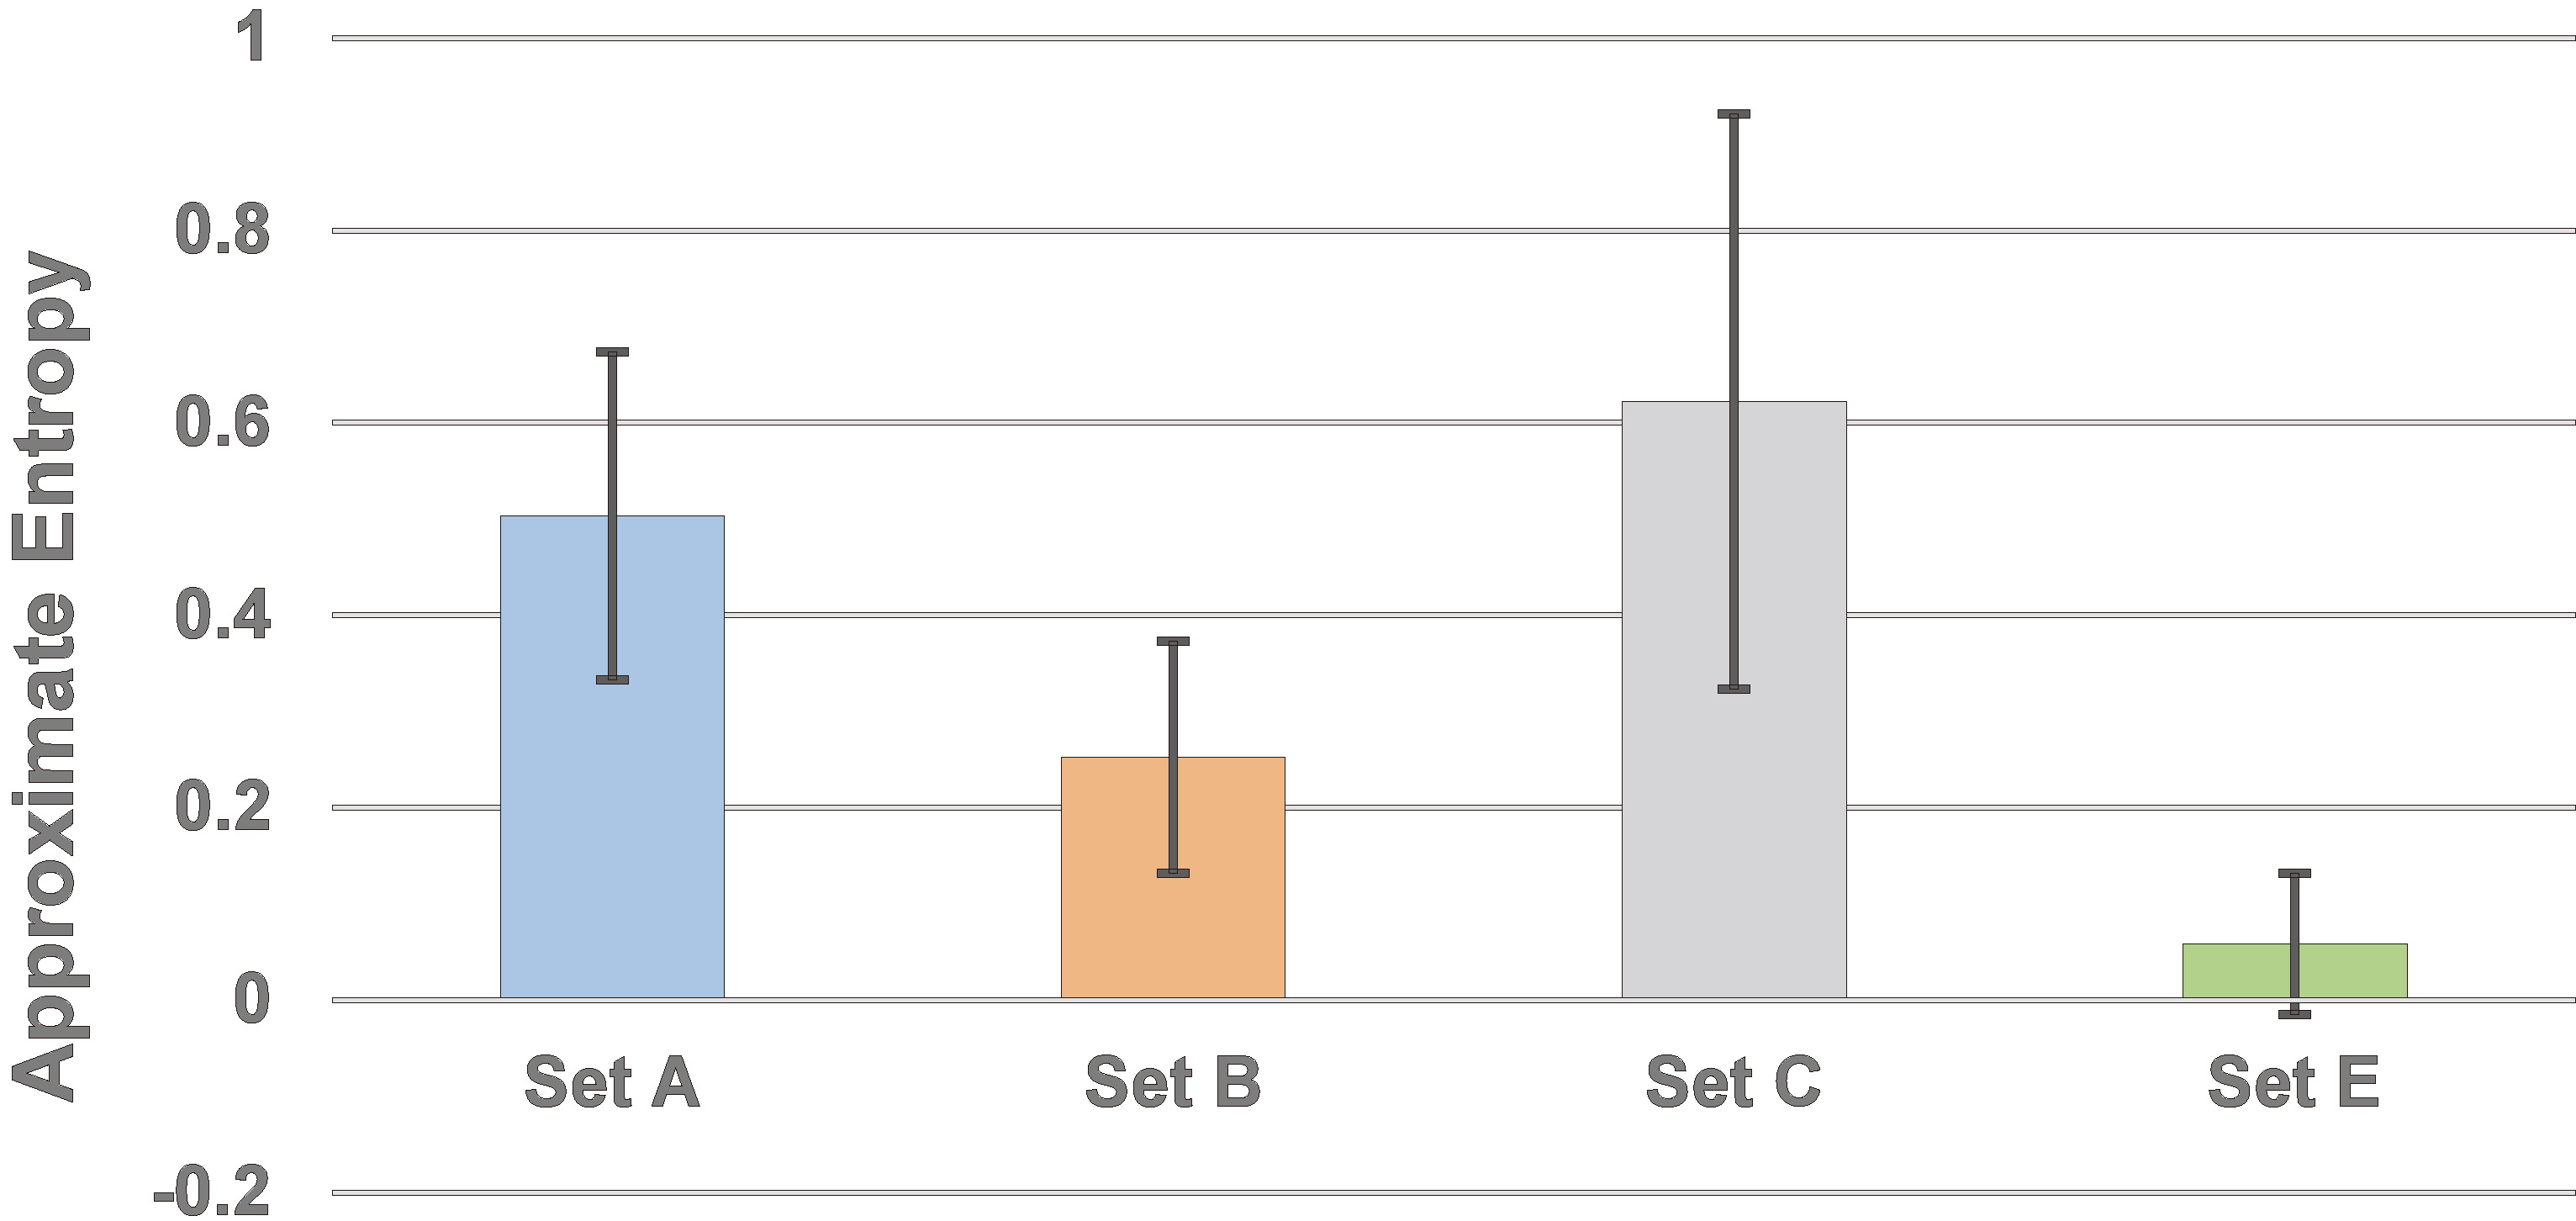
We also performed pairwise comparisons between every two sets. The results of Post-hoc Tukey HSD test for pairwise comparisons of approximate entropy between different sets are shown in Table 4. As can be seen, in case of each pairwise comparison, there is significant difference (
Post-hoc Tukey HSD test result for pairwise comparisons of approximate entropy between different sets
In summary, the EEG signal during seizure shows the greatest complexity and less randomness compared to other sets. In addition, the recorded EEG signal from patients with epilepsy while they do not face seizure, shows the greatest randomness and lowest complexity compared to other sets.
In this paper, we have analyzed the variations of the complexity of EEG signal in case of four different categories: healthy subjects with open-eyes and close-eyes conditions, patients with epilepsy while they do not face seizure, and also while they face seizure. The result of our analysis showed the significant variations of the fractal exponent of EEG signal between different sets. Based on the results, EEG signal for patients during seizure has the greatest complexity compared to the EEG signal in other groups. On the other hand, the EEG signal, which was collected from patients with epilepsy while they do not face seizure, shows the lowest complexity. In the comparison of healthy subjects, the EEG signal in open-eyes condition shows higher complexity than the EEG signal in close-eyes conditions. We also compared the EEG signal between different groups using approximate entropy. The obtained results certified the results in case of fractal analysis, where the EEG signal for patients during seizure has the lowest approximate entropy (randomness) compared to the EEG signal in other groups. On the other hand, the EEG signal which was collected from patients with epilepsy while they do not face seizure, shows the greatest approximate entropy (randomness). Therefore, based on the results, we showed the usability of fractal theory in detecting the nonlinear dynamics of EEG signal in the comparison between different conditions.
The observed behavior in this research can be explained through the nervous system. In fact, when the brain is engaged more, the EEG signal shows higher level of complexity. For instance, in open-eyes condition, the brain is doing a higher level of processing because it should analyze the environment. This further processing accordingly causes a higher level of complexity for the recorded EEG signal. In another example, brain in case of seizure activity shows higher complexity. It is due to the reduction of degrees of freedom of the inherent brain dynamical system (due to internal stimulus) that is mapped on a higher level of complexity of EEG signal.
In fact, employing fractal theory in comparing EEG signal is not limited to the mentioned categories in this paper. We can extend our analysis to other conditions to investigate about non-linear dynamics of EEG signal in other conditions, where other mathematical exponents cannot find the difference between conditions. For instance, one can analyze the variations of EEG signal between different brain disorders such as Alzheimer.
In this paper, we performed our analysis in non-stimulus conditions. We can also extend our analysis to compare the EEG signal for subjects in different categories when they experience a stimulus. In case that we find the usability of fractal theory, we can further extend our analysis for the rehabilitation purpose in case of patients with some disorders such as epilepsy, when the application of a proper stimulus can reduce the effect of seizure attack.
Footnotes
Conflict of interest
None to report.