
Abstract
BACKGROUND:
The frequencies that can evoke strong steady state visual evoked potentials (SSVEP) are limited, which leads to brain-computer interface (BCI) instruction limitation in the current SSVEP-BCI. To solve this problem, the visual stimulus signal modulated by trinary frequency shift keying was introduced.
OBJECTIVE:
The main purpose of this paper is to find a more reliable recognition algorithm for SSVEP-BCI based on trinary frequency shift keying modulated stimuli.
METHODS:
First, the signal modulated by trinary frequency shift keying is simulated by MATLAB. At different noise levels, the empirical mode decomposition, singular value decomposition, and synchrosqueezing with the short-time Fourier transform are used to extract the characteristic frequency and reconstruct the signal. Then, the coherent method is used to demodulate the reconstructed signal. Second, in the paradigm of BCI using trinary frequency shift keying modulated stimuli, the three methods mentioned above are used to reconstruct EEG signals, and canonical correlation analysis and coherent demodulation are used to recognize the BCI instructions.
RESULTS:
For simulated signals, it is found that synchrosqueezing with short-time Fourier transform has a better effect on extracting the characteristic frequencies. For the EEG signal, it is found that the method combining synchrosqueezing with short-time Fourier transform and coherent demodulation has a higher accuracy and information translate rate than other methods.
CONCLUSION:
The method combining synchrosqueezing with short-time Fourier transform and coherent demodulation proposed in this paper can be applied in the SSVEP system based on trinary frequency shift keying modulated stimuli.
Keywords
Introduction
According to different electrophysiological signals detected, the current brain-computer interface (BCI) systems based on EEG can be divided into the following three categories: steady state visual evoked potentials (SSVEP) 13 [1], motor imagination potentials (MI) [2] and event-related potentials (ERP) [3]. Among them, SSVEP is a periodic signal. This refers to a continuous response of the visual cortex when a person is stimulated by a fixed frequency signal. SSVEP has time-locked and phase-locked characteristics, which means that the phase and the frequency of the stimulus signal are similar to SSVEP [4]. When the phase of the stimulus signal changes, the phase of SSVEP will also change. Therefore, compared to other EEG evoked potentials, it has better stability. Compared to other potentials, experimental paradigms based on SSVEP have the advantage of requiring fewer electrodes and subjects without training [5]. Therefore, SSVEP has been widely used in the BCI system.
A basic SSVEP-BCI system is mainly composed of three parts: the generator of the visual stimulus signal, acquisition device of EEG signals and recognition algorithms. Frequency modulation (FM) is the main modulation mode of the visual stimulus signal [6], in which each stimulus signal has a fixed single frequency. Multiple different BCI instructions correspond to multiple visual stimulus signals with different frequencies [7]. The implementation of BCI instructions is realized by recognizing the characteristic frequencies of SSVEP. FM modulation is simple, and the SSVEP-BCI system based on FM modulation (FM-SSVEP system) has a simple experimental design and high recognition accuracy. However, the effective frequency of the visual stimulus signal that can stimulate the SSVEP response ranges between 6 Hz and 30 Hz. Although in recent years some researchers have found that frequency bands lower than 3 Hz [8] and higher than 80 Hz [9] can also stimulate SSVEP response. But, for some complex BCI systems, the available frequency band is still too narrow. The traditional frequency modulation greatly limits the number of BCI instructions and thus affects the performance of the SSVEP-BCI system.
In order to increase BCI instructions, frequency shift keying (FSK) is introduced [10]. FSK is a common digital modulation method in the field of communication. Based on the time-locked of SSVEP, FSK can also be used in the modulation of the visual stimulus signal. It becomes a stimulus by using a binary coding strategy, which means that a single visual stimulus signal can be composed of two frequencies. For the SSVEP-BCI system based on FSK modulation, FSK signals modulated by different digital baseband information can be assigned to different BCI instructions. Therefore, compared with FM, the number of BCI instructions has increased greatly.
When coding a stimulus of FSK method, the problem of ‘coding repetition’ will appear. For example, when the stimulus is coded as ‘10’, the baseband signal is constructed by the cycles of ‘10’, that is ‘10101010 …’. But when the binary coding strategy is used to encode the stimulus, confusion between the end of one stimulus and the next stimulus arises, and the output may be misreaded as ‘01010101 …’. To solve this problem, we introduced the symbol ‘2’, which encoded the flag by third frequency to judge the start and end of the stimulus cycle during the experiment [11]. This coding strategy is called trinary frequency shift keying (TFSK). Based on this improvement, the SSVEP-BCI system based on TFSK (TFSK-SSVEP system) has a higher recognition rate than the FSK-SSVEP system.
At the same time, compared to other modulation methods, it has the advantage of easy implementation, strong anti-attenuation ability, and anti-noise ability. In terms of the recognition methods, power spectral density analysis (PSDA) [12] and canonical correlation analysis (CCA) [13] can be applied in the TFSK-SSVEP system. CCA is used to recognize BCI instructions by calculating the correlation coefficient between multichannel EEG signals and the stimulus signal. At the same time, traditional demodulation methods in the field of communication can also be applied to the TFSK-SSVEP system. The common demodulation methods are coherent demodulation and incoherent demodulation. Compared to incoherent demodulation, coherent demodulation has a complex implementation but a good demodulation effect. Coherent demodulation is realized by multiplying carrier information and input signal to demodulate the baseband signal. Therefore, using visual stimulus signal modulated by TFSK is reasonable in the SSVEP-BCI system.
EEG is characterized by its nonlinearity, weakness, and complexity. Under the real environment with various kinds of noise, it is difficult to recognize the characteristic frequencies of SSVEP by using CCA or PSDA in the TFSK-SSVEP system. Therefore, it is necessary to extract characteristic frequencies of SSVEP by denoising the raw EEG signal. This paper proposes a method based on synchrosqueezing with short-time Fourier transform (SSTFT) to extract the characteristic frequencies of SSVEP. This is a time-frequency processing algorithm proposed by Thakur et al. in 2011 [14]. Short-time Fourier transform (STFT) provides a tool to analyze the signal time-frequency [15]. The length of the window determines the accuracy of the time-frequency spectrum [16]. For example, the longer the length of the window, the better the frequency resolution and the worse the time resolution. Compared to STFT, SSTFT can be used to reconstruct the signal by extracting the instantaneous frequency information of the time-frequency spectrum and reallocate the time-frequency energy in the frequency direction, which makes the time-frequency curve clearer and increases the accuracy of the time-frequency localization [17].
Based on the above research, this paper uses TFSK to modulate the visual stimulus signal for increasing the number of BCI instructions. Then, the characteristic frequencies of SSVEP are extracted by using SSTFT. Finally, coherent demodulation and CCA are used to recognize BCI instructions in the TFSK-SSVEP system.
Materials and methods
The modulation method of TFSK
The modulation method of TFSK is shown in Fig. 1. First, the number of symbols corresponding to carrier frequencies needs to be determined, which will form the baseband signal. Here, the baseband signal is ‘102102102 …’. Symbol ‘0’ corresponds to frequency f1, symbol ‘1’ corresponds to frequency f2, and symbol ‘2’ corresponds to frequency f3. Three independent oscillators generate three carrier signals of different frequencies. Next, three different carrier signals are multiplied by baseband signals including their encoded parts to obtain their encoded modulation parts respectively. Finally, the signal
The modulation method of TFSK.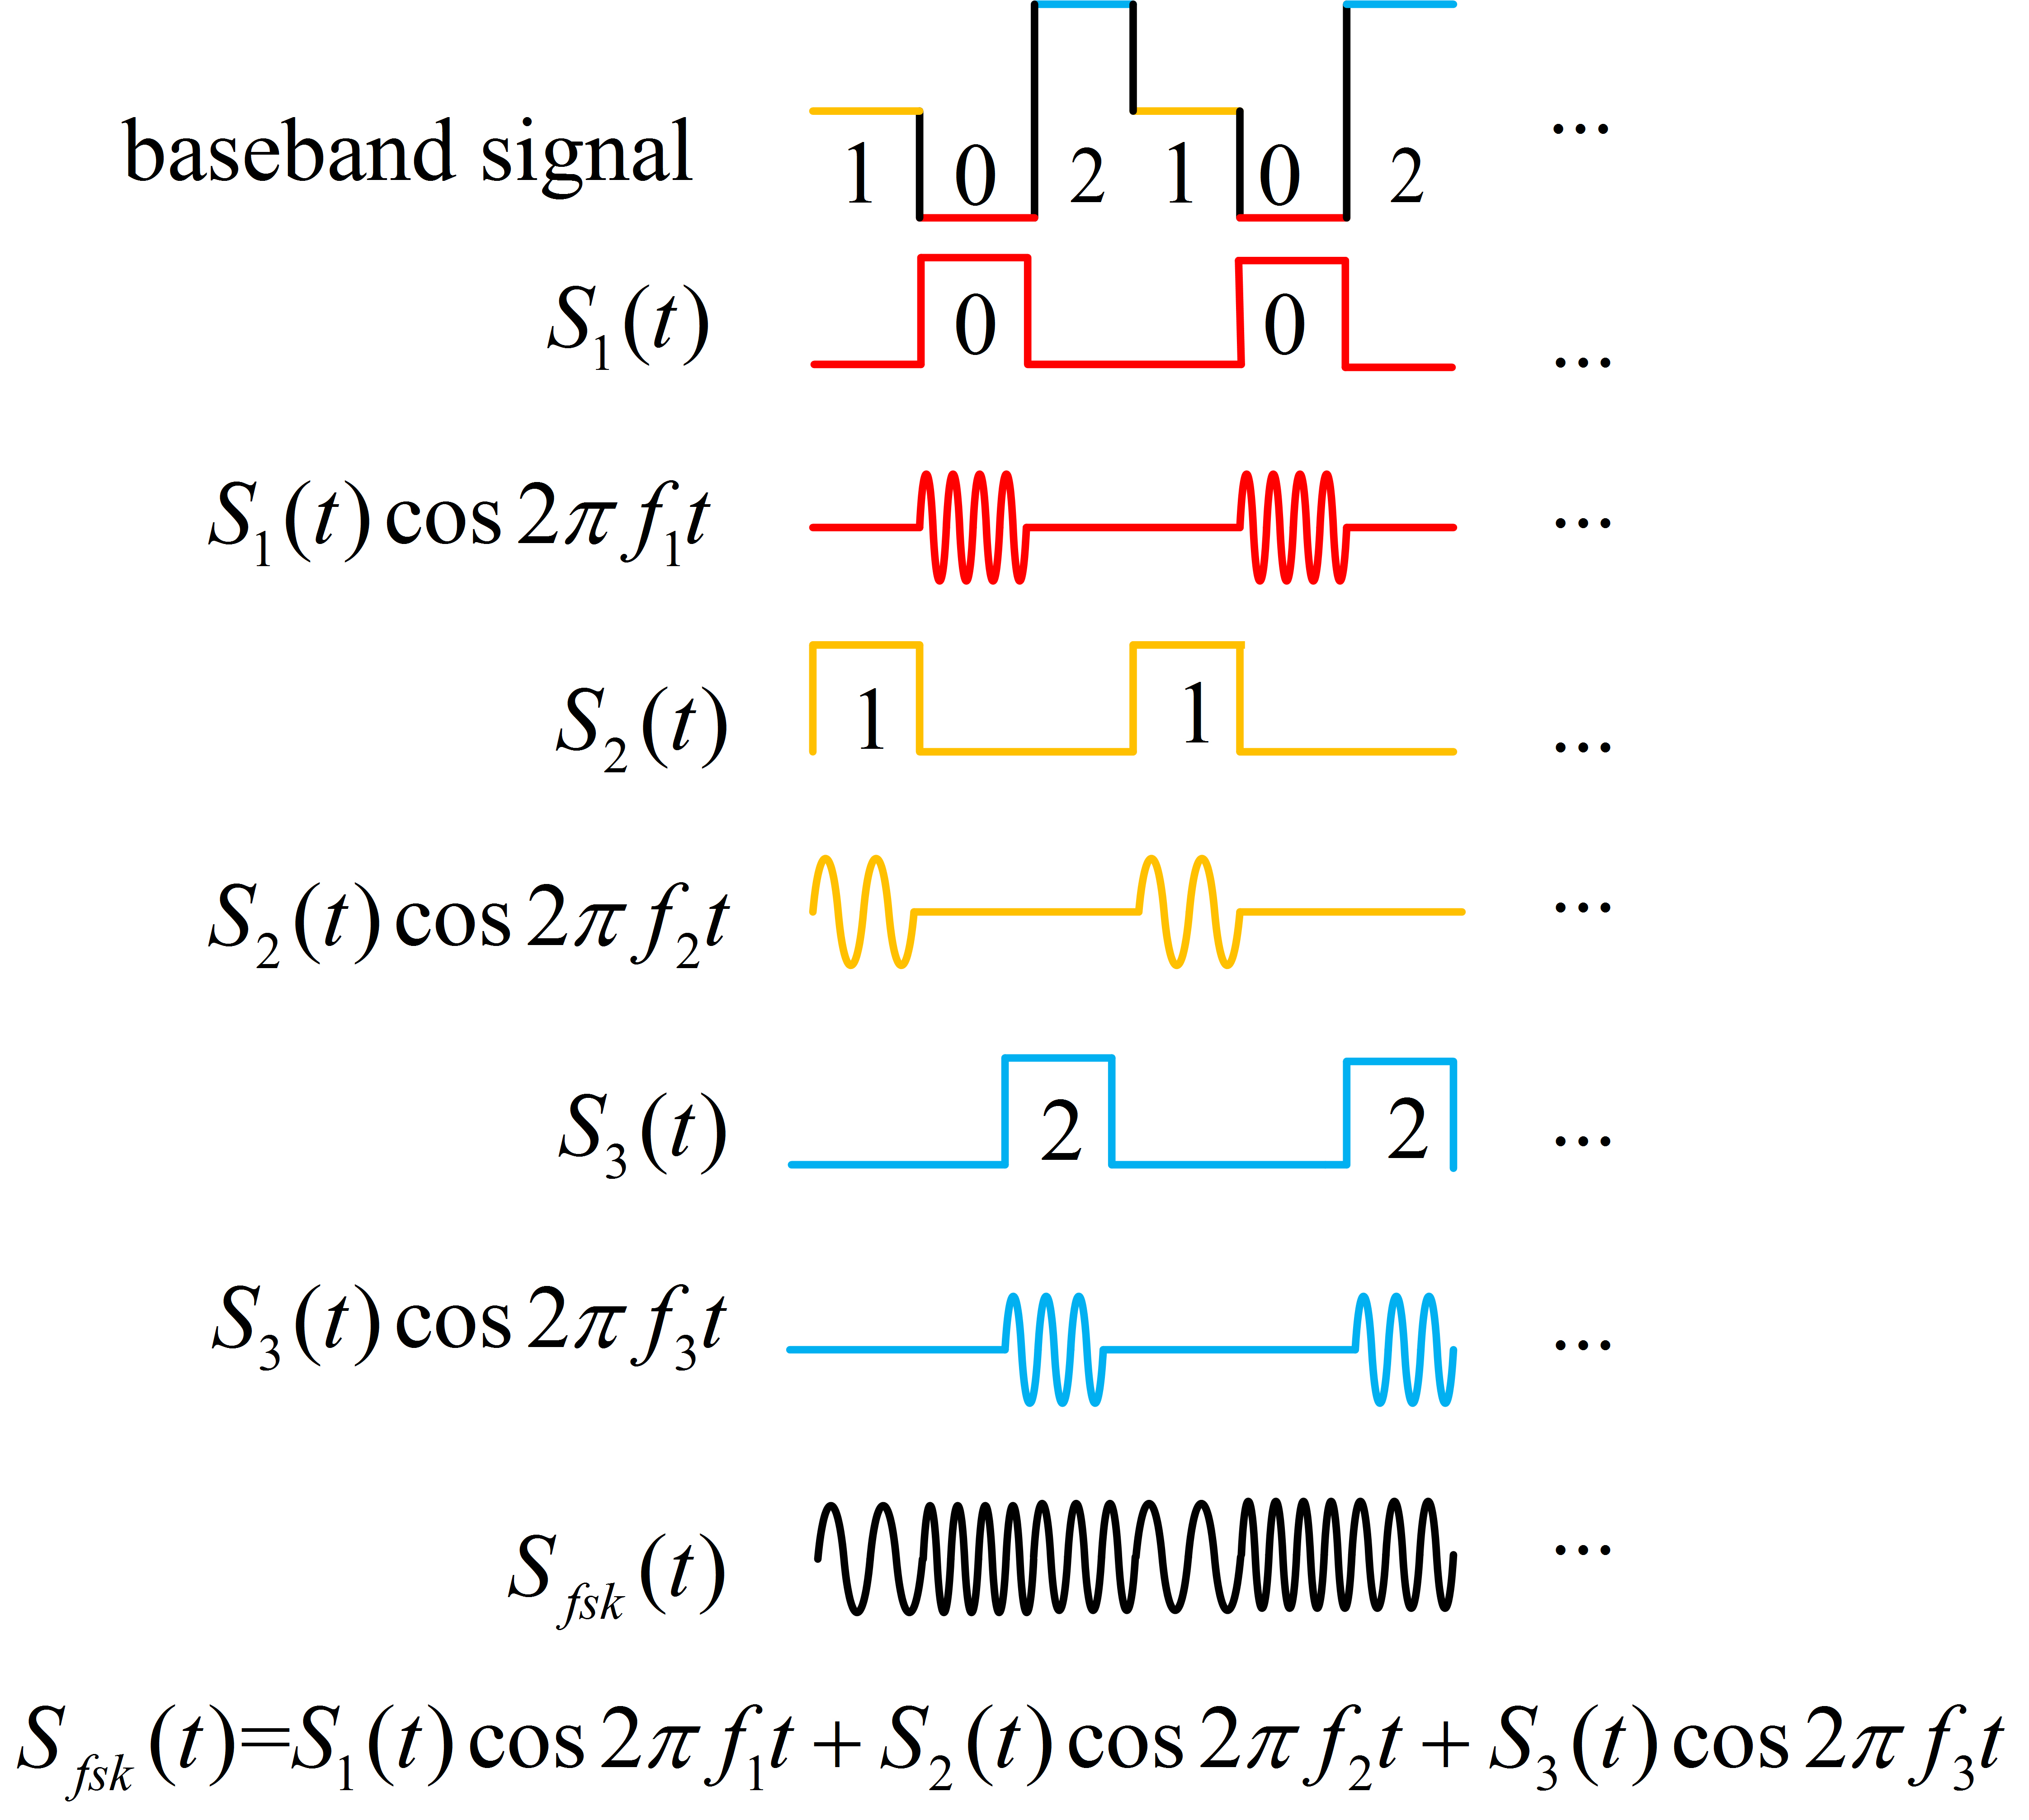
Empirical mode decomposition (EMD) and singular value decomposition (SVD) are two traditional methods for signal reconstruction, and are widely used in feature extraction of EEG signals. The concept of EMD is that a complex signal can be decomposed into the infinite intrinsic mode functions (IMFs) by processing the mean curve of the signal. In these IMFs, local characteristic signals under different time scales of the original are included. The components of SSVEP can be extracted by reserving the IMFs related to stimulation frequencies [18]. Its advantage is that there is no need to set the basis function, and it is suitable for the analysis of nonlinear signals. The disadvantage is that the mode aliasing of IMFs may cause a bad feature extraction effect [19].
SVD has a better feature extraction effect for periodic signals, such as EEG signals.It can be realized by constructing an EEG signal into matrix A and calculating eigenvalues of
We propose SSTFT as a feature extraction method to avoid the problems that the above methods present. The traditional time-frequency spectrum obtained by short-time Fourier transform (STFT) is fuzzy, because of the divergence of energy along the ridge direction. Based on the theory that the phase of the signal is not affected by the length of the window, SSTFT is a good reconstruction method for the EEG signal. Through calculating the instantaneous frequency to redistribute the energy, time-frequency readability can be greatly improved. Compared to EMD and SVD, it has the advantage of better feature extraction effect and eliminating the interference of modal aliasing [21].
Hence, it is effective to use SSTFT for extracting the characteristic frequencies of SSVEP and improving the SNR of the EEG signal. The steps to reconstruct the EEG signal by SSTFT are outlined below:
First, the EEG signal is processed by STFT:
According to the phase
According to Eqs (1) and (2), the instantaneous frequency
At the same time, a threshold
Through Eqs (3)–(5),
The next step is to reconstruct the signal. Time-frequency rearrangement can be expressed as:
Finally, the following time-frequency reconstruction method is used to extract the characteristic frequencies of SSVEP for obtaining the reconstructed signal:
where
The coherent demodulation is also called synchronous detection because it requires the frequency and phase of the reference signal to be the same as that of the modulated signal [22]. But in the TFSK-SSVEP system, the phase information of the stimulus signal is unknown at the beginning when the visual cortex receives the stimulus signal. It is not easy to construct the reference signal. Therefore, there is a certain phase difference between the modulated signal and the reference signal for coherent demodulation. In order to eliminate the influence of the phase difference, the following processing method is adopted.
Suppose that the phase difference between the reference signal and the modulated signal is
The cosine and sine components of the reference signal are:
The sine and cosine components of the reference signal are multiplied by the modulated signal respectively to obtain following formula:
Next,
According to Eq. (11), the baseband signal can be demodulated and the influence of phase difference on coherent demodulation can be eliminated. Similarly, in the TFSK-SSVEP system, the coherent demodulation steps are shown in Fig. 2.
The steps of coherent demodulation in the TFSK-SSVEP system.
The simulated signal
As can be seen in Fig. 1, the simulated signal modulated by TFSK can be obtained. Here, the sampling rate was set to 250 Hz, the length of each symbol was set to 1.2 s, and symbols ‘0’, ‘1’, and ‘2’ correspond to 7 Hz, 11 Hz, and 15 Hz respectively. The baseband signal consists of 7 cycles of ‘012’. Hence, the symbol number of the baseband signal was 21, and the number of sampling points was 21
The EEG signal
We chose LED as a visual stimulator, because, compared with CRT or LCD, visual stimulation produced by LED has stronger brightness and can evoke stronger SSVEP [23]. Here, the symbols ‘0’, ‘1’, and ‘2’ of the TFSK signal correspond to 7 Hz, 11 Hz, and 15 Hz respectively, and the length of each symbol was also set to 1.2 s. As shown in Table 1, the BCI instructions consist of these symbols. Then, the TFSK signal was used to control the flickering frequency of the LED.
Five volunteers, aged 22–28 years including two females and three males, participated in our experiment. They were informed about the experimental procedures and written consent was provided prior to participation. Subjects with no visual impairment were required to stare at the LED. During this period, the EEG signals were recorded by SynAmps2 of Neuroscan at 1000 Hz with a 0.15 Hz to 200 Hz bandpass filter, and O1, O2, Oz were selected as electrodes. For each subject, the experiment consisted of five blocks. Each block contained six trials corresponding to the six BCI instructions indicated in a random order, and each trial lasted for 15 s. At the end of the trial, a 5 s rest time was included before the next trial.
In order to facilitate the processing, the EEG signals were down-sampled to 250 Hz by MATLAB. Based on the above operation, 10 groups of EEG signals for each instruction were recorded.
The BCI instructions
The BCI instructions
The simulated signal and its spectrum.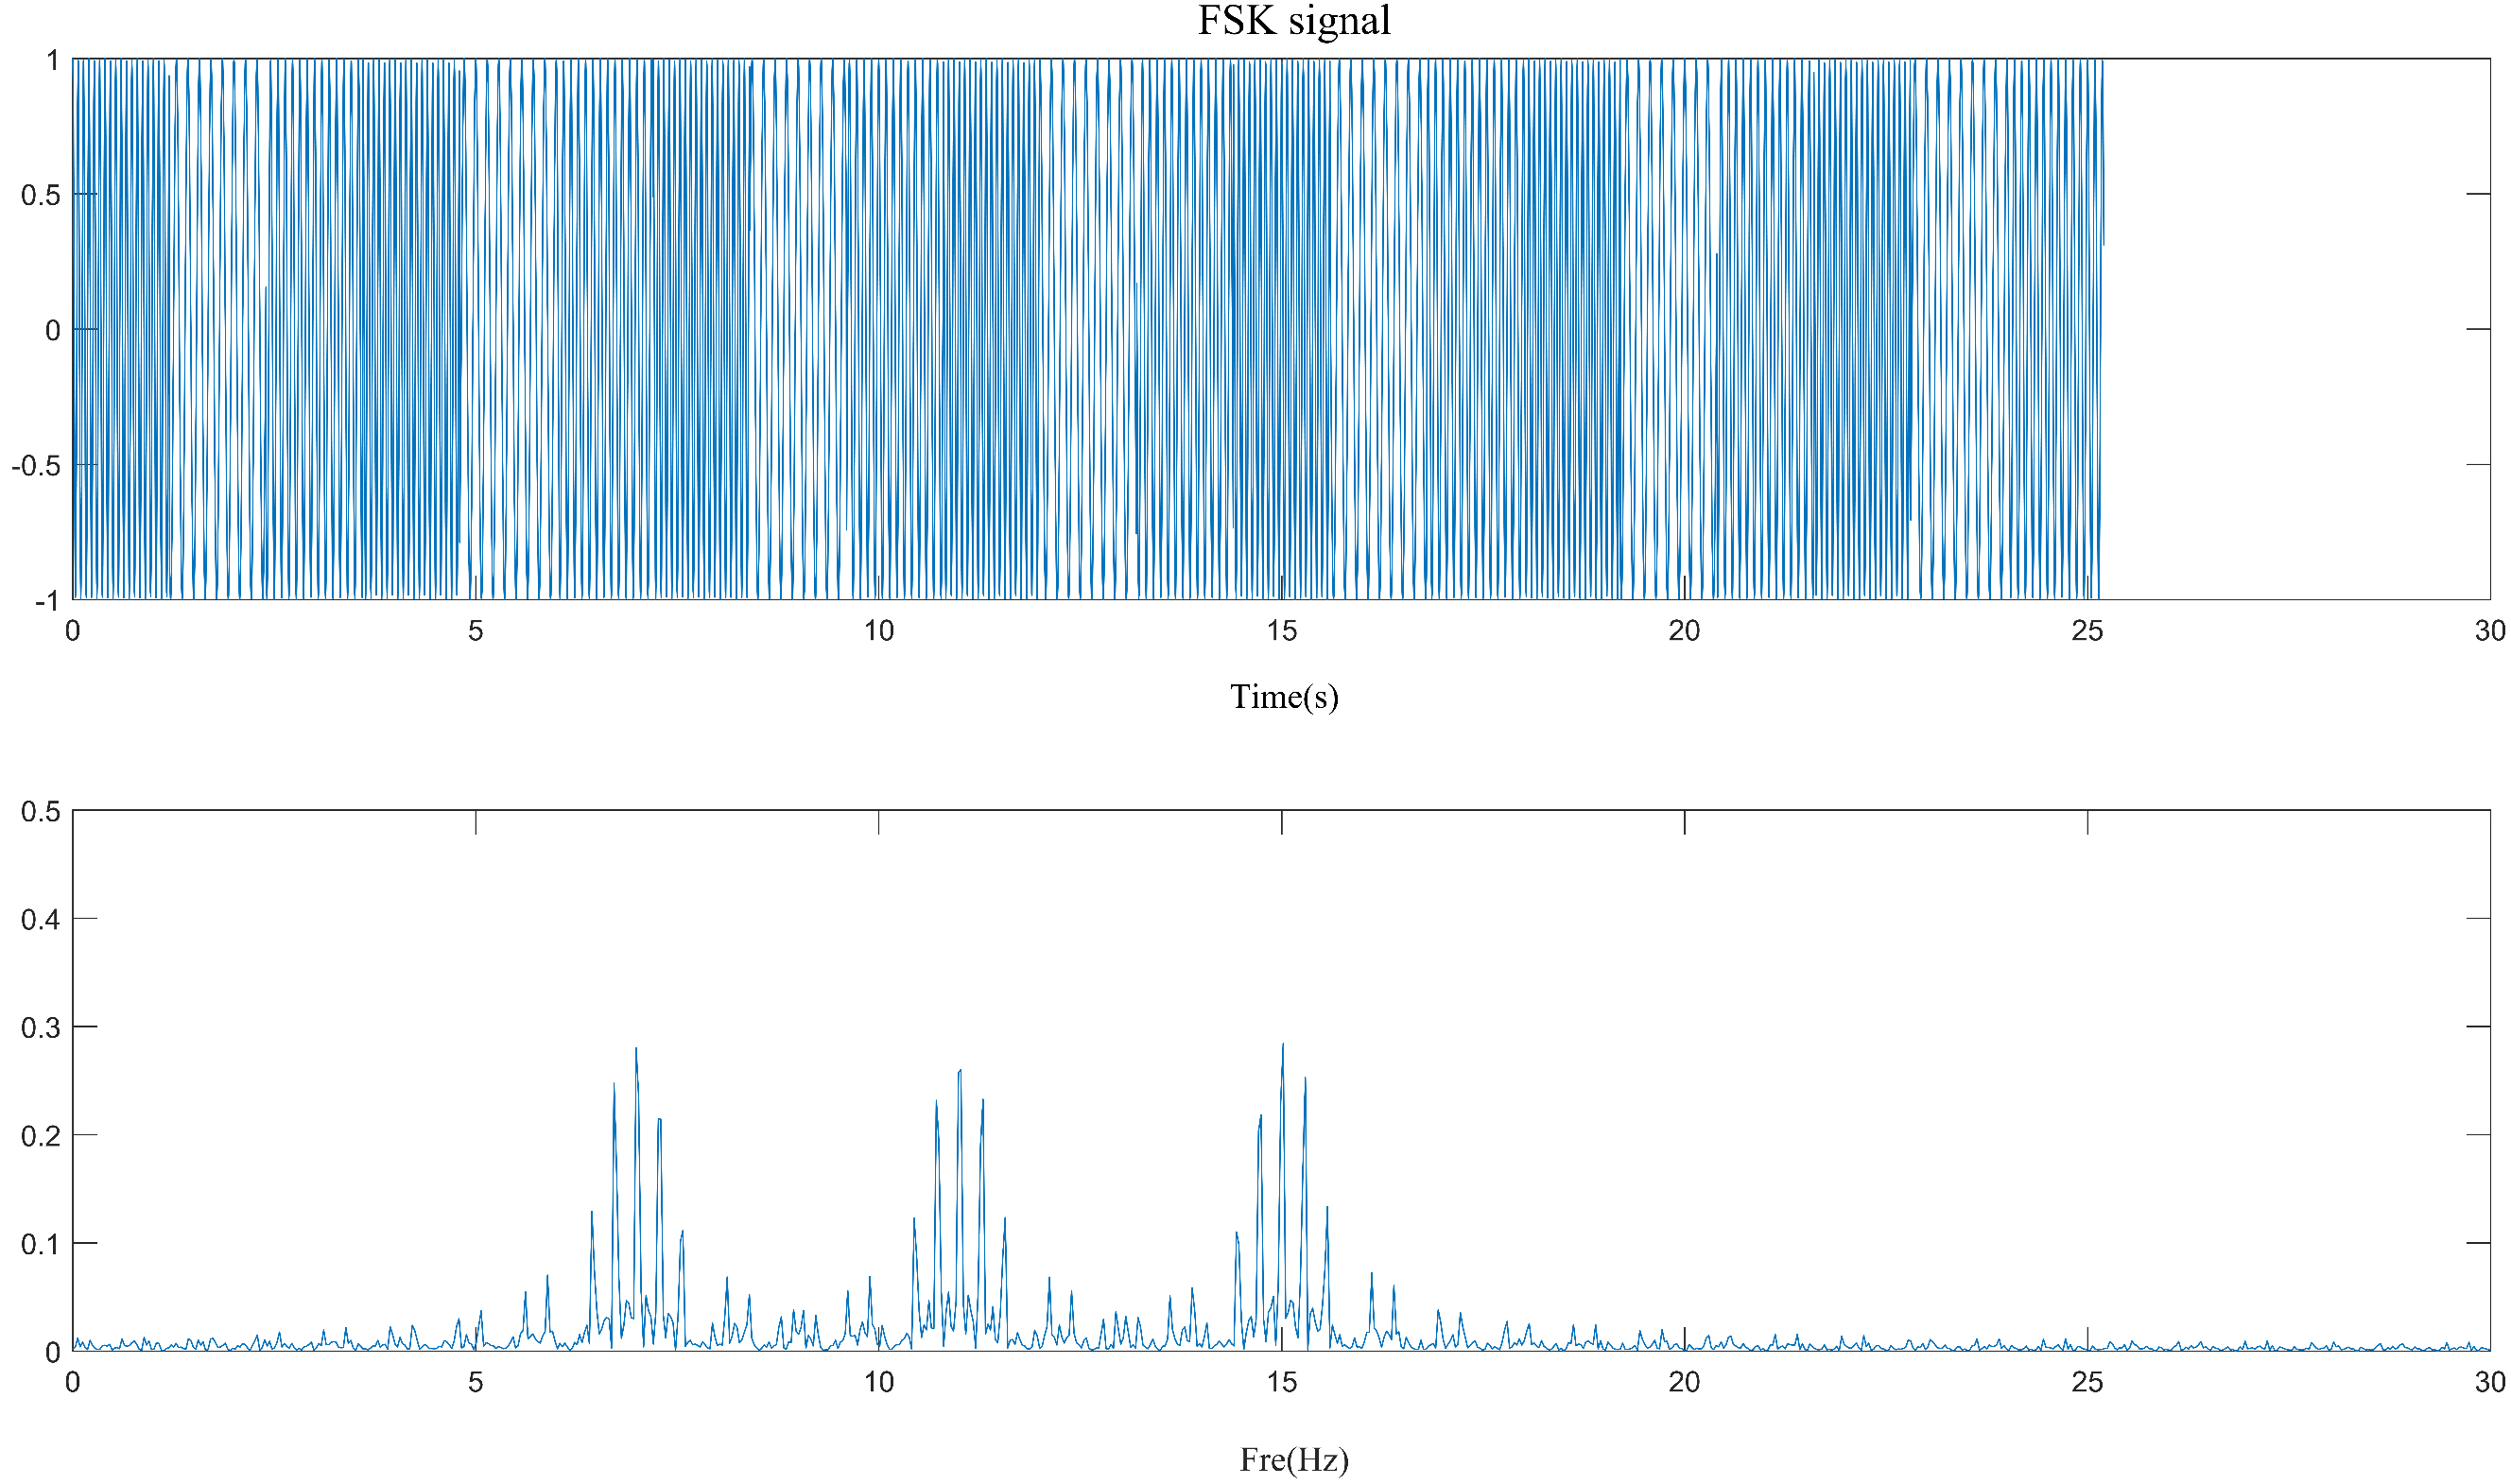
The reconstruction performance of SSTFT in simulation
In this section, we compare the performance of SVD, EMD and SSTFT using the simulated signals. The simulated signal obtained in Section 2 and its spectrum is shown in Fig. 3. Then, different intensity white Gaussian noises are added to the simulated signal to obtain the noisy signals with different SNR ranging from 0 dB to
SNR comparison of the reconstructed signal.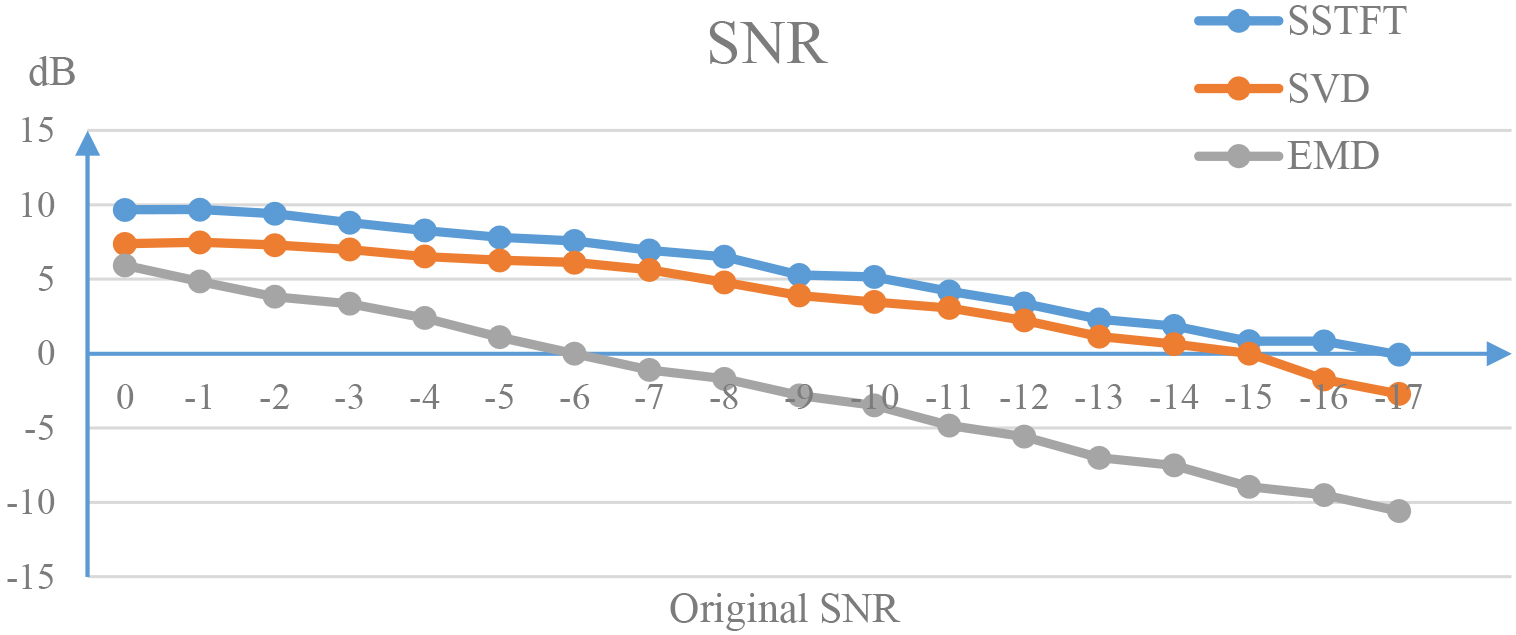
RMSE comparison of the reconstructed signal.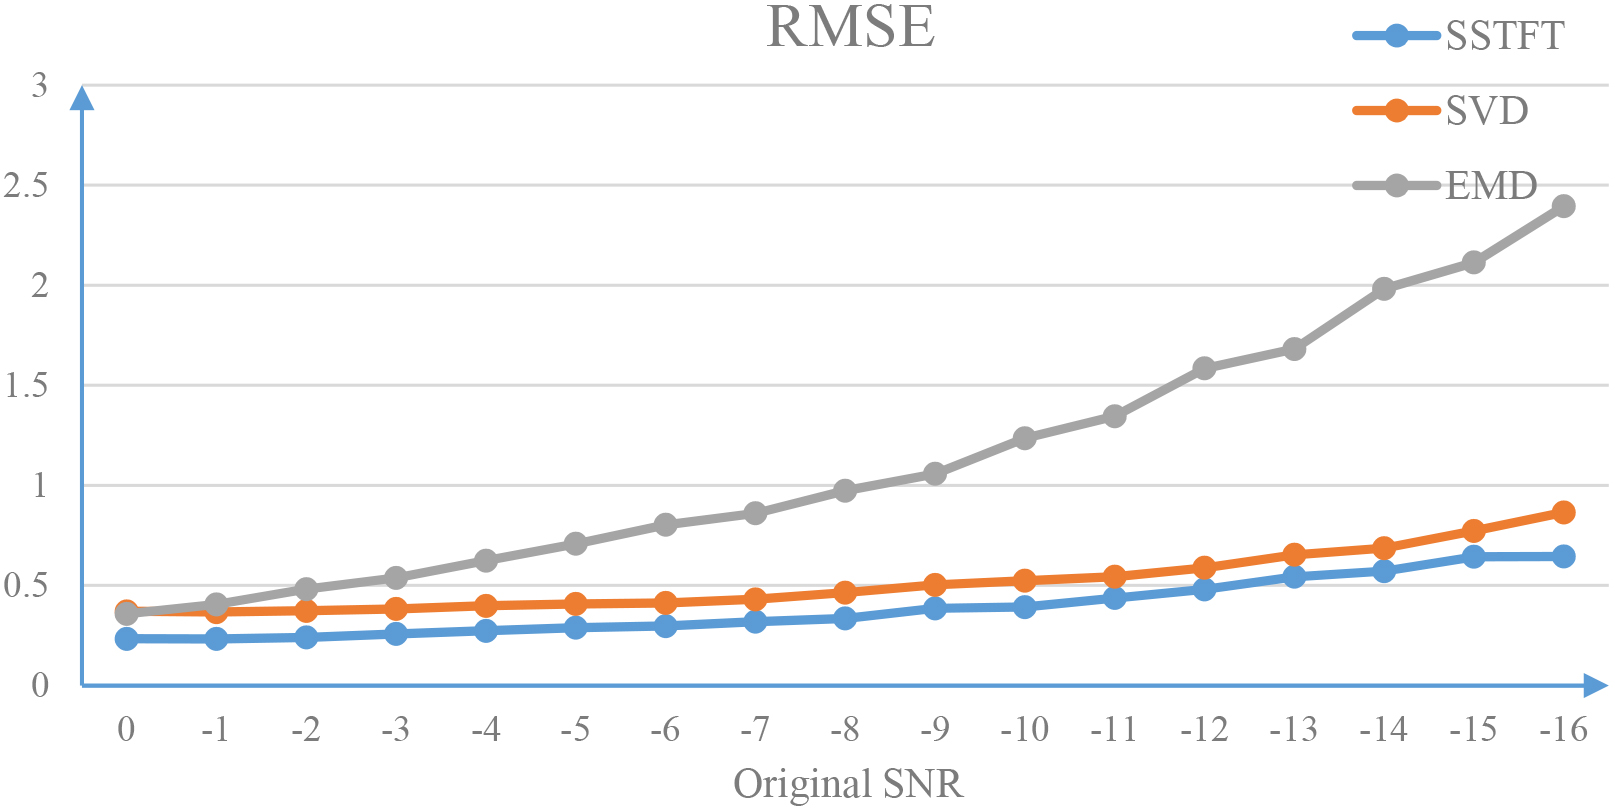
The SNR reflects the signal-to-noise ratio. The higher the SNR, the less the components of noise are in the reconstructed signal. The RMSE reflects the deviation between the predicted value and the real value. For the signal, the lower the RMSE, the closer the reconstructed signal is to the original signal. As shown in Figs 4 and 5, the SNR of the reconstructed signal by SSTFT is higher than that of the reconstructed signal by EMD and SVD. At the same time, the RMSE of the reconstructed signal by SSTFT is lower than that of the reconstructed signal by EMD and SVD. Therefore, SSTFT is better than SVD and EMD in signal reconstruction. Finally, we use the coherent method to demodulate the reconstructed signal and calculate the bit error rate (BER). The results are shown in Fig. 6.
BER comparison of the reconstructed signal.
As shown in Fig. 6, the curve of BER based on SSTFT is lower than that of BER based on EMD and SVD. Hence, SSTFT with better characteristic frequencies extraction has lower BER for the coherent demodulation. At the same time, if the SNR of the original signal is lower than
Flowchart of the TFSK-SSVEP system.
The flowchart of the TFSK-SSVEP system is shown in Fig. 7. Three methods are used to extract the characteristic frequencies of SSVEP to obtain the reconstructed signal. The same reconstructed signal by three methods and its frequency spectrum are shown in Figs 8–10 respectively.
Reconstruction of EEG based on EMD.
Reconstruction of EEG based on SVD.
Reconstruction of EEG based on SSTFT.
We then calculate the average SNR of the characteristic frequencies of the Oz channel. The formula is as follows:
The average SNR of characteristic frequencies by three methods.
From Figs 8–10 it can be seen that SSTFT can extract the characteristic frequencies of SSVEP accurately. There may be some defects in EMD and SVD. For the SVD, it is realized by using the size of eigenvalues to determine whether it has the components mixed with characteristic frequencies of SSVEP. The larger eigenvalues may also be mixed with noise components. For EMD, because there may exist modal aliasing between IMFs, the noise will be introduced into signal reconstruction by using IMFs related to characteristic frequencies of SSVEP. Hence their spectrum contains some noise frequencies. It can also be seen that the average SNR of characteristic frequency extracted by SSTFT is higher than the other two methods displayed in Fig. 11. Therefore, it can be concluded that SSTFT is better than SVD and EMD in the extraction of the characteristic frequencies.
Finally, we use CCA and coherent demodulation to identify the reconstructed EEG signals by three methods respectively. The steps are as follows:
The reconstructed signal is identified by sliding window L1, whose the window length is 0.5 Coherent demodulation or CCA is used to obtain the recognition sequence for the data in each sliding window L1. The maximum number of 0, 1, 2 in the recognition sequence as the recognition result of each sliding window L1. Repeat steps 1 and 2 several times until the sliding window L1 moves to the end of the reconstructed signal. Add the sliding window L2 at the value jump point of the recognition results of window L1. The length and sliding step length of the window L2 are the length of the unit symbol. The maximum number of 0, 1, 2 in each window L2 is counted as the recognition symbols of the TFSK-SSVEP system.
The result of one trial is shown in Fig. 12. The baseband signal is 10121012 …, and each symbol length is 1.2 s. The length of the window L2 is 1.2 s. The recognition symbols are ‘012101210121’, so the recognition result is 1012.
The recognition accuracy statistics by different methods in TFSK-SSVEP system
The ITR (bit/min) statistics by different methods in TFSK-SSVEP system
The recognition results of the TFSK-SSVEP system.
Then, the results of the average recognition accuracy of the TFSK-SSVEP system are calculated by combining the three reconstruction methods (SVD, EMD, SSTFT) and two recognition methods (coherent demodulation, CCA) respectively. The results are shown in Table 2.
Compared to the other two reconstruction methods, SSTFT has a better effect on the simulation, so the recognition accuracy in the TFSK-SSVEP system is higher than others. At the same time, comparing the two recognition methods, we found that the coherent demodulation has a higher accuracy in the TFSK-SSVEP system. When combing SSTFT and coherent demodulation, the average recognition accuracy of the TFSK-SSVEP system is as high as 93.32%. Among them, the accuracy of subject 4 can reach 100%.
Finally, under different methods, we counted the ITR (bit/min) of five subjects. As shown in Table 3, using the SSTFT reconstruction method or coherent demodulation can effectively improve the ITR of the TFSK-SSVEP system. But, the method proposed in this paper can increase the ITR of the TFSK-SSVEP system significantly. Its ITR is as high as 23.82 (bit/min), which can improve the performance of the TFSK-SSVEP system effectively.
The SSVEP-BCI system has less available instructions, because the frequency band which induces SSVEP is narrow. Therefore, in order to increase the number of instructions in the BCI system, a variety of experimental paradigms are adopted. In this paper, we proposed an experimental paradigm based on TFSK modulated stimuli, which achieved the recognition of six targets in the case of three stimulating frequencies. Then, the main problem addressed in this work was to pursue a recognition method with high accuracy in the SSVEP-BCI system based on TFSK modulated stimuli. First, SSTFT was adopted to reconstruct the EEG signal, which can eliminate mode mixing caused by EMD. By processing the stimulated signal, BER, RMES and SNR are compared to other reconstruction methods (Figs 4–6). The feasibility of SST to extract SSVEP components was demonstrated. Second, based on the experimental paradigm of TFSK modulated stimuli, the SSVEP components have the same properties as the TFSK signal. Therefore, this paper improved the coherent demodulation in the field of communications and applies it to the identification of the TFSK-SSVEP system. Finally, in the case of the O1, O2, Oz channel, the accuracy of the improved coherent demodulation is higher than CCA (Table 1), which achieves a higher recognition rate of the TFSK-SSVEP system in the case of fewer channels. It improves the portability and reliability of BCI.
In this paper, the IIR band-pass filter was used to filter the noise in coherent demodulation. In future work, the filter structure can be optimized to reduce the in-band noise and improve the signal-to-noise ratio of the EEG signal, which may improve the accuracy of the TFSK-SSVEP system. Second, incoherent demodulation is used in [11]. The filtered signal will introduce an inconsistent phase error, which will interfere with subsequent identification. In this paper, the sine and cosine components of the reference signal are used to correct the phase difference, in order to improve the accuracy of recognition.
Finally, this paper has some limitations. The coherent demodulation only used the basic frequency component of SSVEP. If combined with its frequency doubling component, the accuracy of the coherent demodulation may be further improved. But correspondingly, the complexity of the algorithm will increase and the computing power of the SSVEP-BCI system will decrease.
Conclusion
In the current BCI system, the traditional SSVEP-BCI system using the visual stimulus signal modulated by FM has fewer instructions, whereas the TFSK-SSVEP system can greatly increase the number of instructions and improve the practicability of the SSVEP-BCI system.
For the TFSK-SSVEP system, we proposed SSTFT to reconstruct the EEG signal. This can refine the time-frequency spectrum of the EEG signal to extract the characteristic frequencies of SSVEP, which will lead to higher recognition accuracy compared to EMD and SVD. The feasibility of SSTFT in the TFSK-SSVEP system is shown by comparing the results of simulation and experiment with EMD and SVD.
Footnotes
Acknowledgments
This work was financially supported by the Natural Science Foundation of Chongqing, China (no. cstc2018jcyjAX0163) and the Special Research Project of Philosophy and Social Science of Chongqing Medical University, China (no. 201712).
Conflict of interest
No potential conflict of interest was reported by the authors.