
Abstract
Background
Brain–Computer Interfaces (BCIs) enable direct communication between the brain and external devices. Steady-state visual-evoked potentials (SSVEPs) are particularly useful in BCIs because of their rapid communication capabilities and minimal calibration requirements. Although SSVEP-based BCIs are highly effective, traditional classification methods face challenges in maintaining high accuracy with minimal EEG channels, especially in real-world applications. There is a growing need for improved classification techniques to enhance performance and efficiency.
Objective
The aim of this research is to improve the classification of SSVEP signals using machine-learning algorithms. This involves extracting dominant frequency features from SSVEP data and applying classifiers such as Decision Tree (DT), Linear Discriminant Analysis (LDA), and Support Vector Machine (SVM) to achieve high accuracy while reducing the number of EEG channels required, making the method practical for BCI applications.
Methods
SSVEP data were collected from the Benchmark Dataset at Tsinghua BCI Lab using 64 EEG channels per subject. The Oz channel was selected as the dominant channel for analysis. Wavelet decomposition (db4) was used to extract frequency features in the range 7.8 Hz to 15.6 Hz. The frequency of the maximum amplitude within a 5-s window was extracted as the key feature, and machine learning models (DT, LDA, and SVM) were applied to classify these features.
Results
The proposed method achieved a high classification accuracy, with 95.8% for DT and 96.7% for both LDA and SVM. These results show significant improvement over existing methods, indicating the potential of this approach for BCI applications.
Conclusion
This study demonstrates that SSVEP classification using machine-learning models improves accuracy and efficiency. The use of wavelet decomposition for feature extraction and machine learning for classification offers a robust method for SSVEP-based BCIs. This method is promising for assistive technologies and other BCI applications.
Keywords
Introduction
The conventional methods for steady-state visual evoked potential (SSVEP) analysis in brain–computer interfaces (BCIs) present several limitations. The division of BCIs into invasive and noninvasive approaches introduces challenges, with invasive methods posing high risks and noninvasive methods facing signal quality issues. Electroencephalogram (EEG) signals are widely acclaimed in the area of Brain-Computer Interfaces (BCIs) due to their portability, high temporal resolution, ease of acquisition, and cost-effectiveness compared to alternative brain activity monitoring techniques.1,2 The four predominant EEG-based BCI paradigms encompass the P300 component of evoked potentials, slow cortical potentials (SCP), steady-state visual-evoked potentials (SSVEP), and sensory-motor rhythms (SMR).3,4 SSVEPs, in particular, hold paramount importance in BCIs owing to their distinct advantages, including high information transfer rates, minimal calibration requirements, reduced setup time, and user-friendliness, rendering them accessible to a diverse user spectrum. SSVEPs excel in multi-class control scenarios and find particular suitability in applications such as spatiotemporal navigation and real-time feedback, consolidating their significance in BCI research and practical applications.
The versatility of SSVEP-based BCIs extends to a broad user base, encompassing healthy individuals for gaming and device control, individuals with motor disabilities for assistive technology, locked-in syndrome patients for communication, those with neurological conditions for rehabilitation, the elderly for independent living, individuals with visual impairments utilizing alternative sensory inputs, and researchers for neuroscientific studies. The adaptability and ease of use of SSVEP-based BCIs position them as versatile tools with applications ranging from entertainment to critical assistive technologies, contingent on design and customization.
In, 5 the author employed Canonical correlation analysis in SSVEP-based BCI systems due to its rapidity and scalability. The paper introduces a fusion algorithm (CCA-CWT-SVM) combining Canonical correlation analysis, continuous wavelet transforms, and a support vector machine (SVM) to address low classification accuracies associated with single-feature extraction methods. The classification accuracy of the algorithm, contingent on target recognition, and the number of leads used, is demonstrated using nine leads (P3, P4, O1, O2, PZ, P7, P8, CP1, and CP2). By studying 400 groups of experimental data from 10 subjects, the CCA-CWT-SVM method achieves a classification accuracy of 91.76% within 2 s and an Information Transfer Rate (ITR) of 48.92 bits/min. In, 6 Chen et al. propose a filter bank canonical correlation analysis (FBCCA) method to enhance the effectiveness of SSVEP detection by incorporating fundamental and harmonic frequency components. The study employs a 40-target BCI speller based on frequency coding (frequency range: 8–15.8 Hz, frequency interval: 0.2 Hz) for performance evaluation. Data acquisition involves both offline and online BCI experiments using the SSVEP-based BCI speller, with nineteen healthy subjects participating. Nine electrodes over the parietal and occipital areas (Pz, PO5, PO3, POz, PO4, PO6, O1, Oz, and O2) record SSVEPs.
In, 7 Ke Qin et al. propose a novel filter bank-driven MSI algorithm (FBMSI) to enhance the accuracy of SSVEP recognition. The efficacy of the FBMSI method is evaluated by developing a 6-command SSVEP-NAO robot system, demonstrating an average accuracy of 83.56%. In, 8 Xiaoyang Yuan et al. propose a novel BCI paradigm based on SSVEP and SSVEP blocking responses to increase the number of BCI commands with limited visual stimuli. Users can voluntarily control the duration of SSVEP blocking response. The paper introduces frequency-specific and unified threshold methods to identify SSVEP blocking responses, with results analyzed and compared with other research models.
The application of a filter bank, denoting an array of band-pass filters that separates an input signal into multiple sub-band components, has been pivotal in recent BCI studies. For instance, the filter bank common spatial pattern (FBCSP) method is proposed to extract EEG power features in mu and beta frequency bands, significantly improving the discrimination of different motor imagery states (Ang et al., 2012). In, 9 Ang et al. collect data from Datasets 2a and 2b of the Brain-Computer Interface (BCI) Competition IV. Dataset 2a comprises 4 classes of 22 channels EEG data from 9 subjects, while Dataset 2b comprises 2 classes of 3 bipolar channels EEG data from 9 subjects. Mutual Information-based Best Individual Feature (MIBIF) and Mutual Information-based Rough Set Reduction (MIRSR) algorithms are employed as feature selection methods.
In, 10 Elisavet integrates a support vector machine (SVM) into the standard CCA, resulting in improved results. However, the features extracted by these algorithms are relatively simple and may not comprehensively represent EEG signals from various perspectives. Numerous studies emphasize that irrelevant EEG channels may introduce noise and redundant information, potentially diminishing signal processing accuracy. 11 While having a minimal number of EEG channels is recognized to enhance classification accuracy, 12 maintaining a small number of EEG channels for low computing complexity and high classification accuracy remains a significant challenge in BCI research. Traditional signal analysis methods such as Power Spectral Density Analysis and Canonical Correlation Analysis exhibit limitations in accuracy and applicability. 13 Moreover, the classical CCA algorithm faces accuracy issues with limited stimulation time or EEG leads. Ongoing efforts aim to reduce the number of electrode channels for wearable environments. Overall, these drawbacks highlight the necessity for advancements in SSVEP BCI methodologies to enhance safety, performance, and practicality.
The proposed method uses SSVEP data from the Benchmark Dataset, Tsinghua BCI Lab, accessible through http://bci.med.tsinghua.edu.cn/download.html. Each subject contributes data comprising 64 EEG channels. Utilizing Fast Fourier Transform (FFT), the Oz Channel from the occipital lobe is identified as the dominant channel based on the frequency of maximum amplitude. The SSVEP EEG signal, sampled at 250 Hz, undergoes wavelet decomposition into four levels, extracting the frequency range of 7.8 Hz to 15.6 Hz. This specific frequency range is chosen as it aligns with the flickering frequencies (9, 10, 11, and 12 Hz) used for classification in the proposed work. The frequency of maximum amplitude is determined using FFT for the database signals from the Oz channel. The extracted features are used for testing and training Machine Learning algorithms. Results from the proposed method demonstrate an accuracy of 95.8% for DT and 96.7% for both LDA and SVM models, surpassing the performance of existing methods. These classifier results can serve as commands, proving valuable for various BCI applications.
Method and materials
The proposed work block diagram is illustrated in Figure 1. The collected dataset encompasses 64 EEG channels for each subject, sampled at 250 Hz. In the channel selection phase, the most dominant channel (Oz) is singled out from the 64 EEG channels. Subsequently, employing wavelet decomposition in the signal processing stage, the signal is decomposed into four levels, extracting a frequency bank ranging from 7.8 to 15.6 Hz.

Block diagram of proposed system.
The dominant frequency is then extracted from this frequency rhythm for every five-second window duration. This extracted dominant frequency serves as the feature value for the classification stage. Feature values are extracted for 28 subjects, and utilized for training and testing three classifier models: Decision Tree (DT), Support Vector Machine (SVM), and Linear Discriminant Analysis (LDA). The extracted feature values are partitioned into training data (80%) and test data (20%) for all three models. Results obtained from this methodology are analyzed and compared with existing methods.
In the presented methodology, SSVEP data is acquired from the Benchmark Dataset of the Tsinghua BCI Lab, accessible at http://bci.med.tsinghua.edu.cn/download.html. This dataset encompasses SSVEP-BCI recordings from 35 healthy subjects (17 females, aged 17–34 years, mean age: 22 years), focusing on 40 characters flickering at varying frequencies (8–15.8 Hz with an interval of 0.2 Hz). Each subject participated in an experiment comprising 6 blocks, with each block containing 40 trials representing all 40 characters in a random order. Each trial was initiated with a visual cue (a red square) indicating a target stimulus, lasting 0.5 s. Subjects were instructed to shift their gaze to the target within the cue duration. Subsequently, stimuli flickered concurrently on the screen for 5 s. After stimulus offset, a blank screen for 0.5 s preceded the next trial, allowing subjects short breaks between trials. Each trial was extended for a total of 6 s. A red triangle below the flickering target facilitated visual fixation during stimulation. Subjects were directed to refrain from eye blinks during the stimulation period in each block, with breaks provided to prevent visual fatigue.
EEG data were acquired utilizing a Synamps2 system (Neuroscan, Inc.) with a sampling rate of 1000 Hz and a frequency pass band of 0.15 Hz to 200 Hz. Sixty-four channels covered the subject's entire scalp, aligned according to the international 10–20 system, with the ground positioned midway between Fz and FPz and the reference located on the vertex. Electrode impedances were maintained below 10 KΩ, and a notch filter at 50 Hz was applied to eliminate common power-line noise during data recording. Computer-generated event triggers synchronized with EEG data were recorded on an event channel by the amplifier.
The continuous EEG data were segmented into 6-s epochs (500 ms pre-stimulus, 5.5 s post-stimulus onset) and subsequently down sampled to 250 Hz, resulting in each trial consisting of 1500 time points.
Channel selection
A pivotal consideration in the real-time implementation of Brain-Computer Interface (BCI) applications is the imperative to minimize the number of electrodes for acquiring Steady-State Visual Evoked Potentials (SSVEP) signals. This optimization aims to ensure subject comfort and optimal task performance. In the context of the Benchmark Dataset from the Tsinghua BCI Lab, where SSVEP data is available across 64 channels, the proposed approach employs Fast Fourier Transform to discern a singular dominant channel, specifically OZ. In the channel selection stage, the frequency of the maximum amplitude is extracted for all the 64 EEG channels. The extracted frequency components were compared, and noticed that Oz channels had highest amplitude among all the 64-EEG channels. This strategic selection of the Oz channel facilitates the extraction of feature values exclusively from this channel within the SSVEP data. Consequently, this focused approach contributes to reduced computational complexity in Machine Learning algorithms, enhancing efficiency and expediting the classification process.
Discrete wavelet transform
Steady-state visual Evoked Potentials (SSVEP) signals, characterized by their non-stationary nature, pose challenges for traditional analysis methods. While Short-Time Fourier Transforms (STFTs) have been traditionally used for time-frequency analysis, their efficacy is contingent on judicious window selection. In this context, the Wavelet Transform (WT) emerges as a robust multi-resolution analysis approach, offering improved temporal localization. Particularly suited for non-stationary signals, the two-dimensional time-scale processing capability of the Wavelet Transform provides simultaneous insights into frequency and temporal characteristics across various resolutions. Implemented as a specially designed dual Finite-Impulse Response (FIR) filter, the WT utilizes low-pass (LP) and high-pass (HP) filters in the Multi-resolution Algorithm (MRA). These filters, employing the same wavelet coefficients, separate high and low-frequency components of the input signal. The Discrete Wavelet Transform (DWT), applied to the raw SSVEP signal, yields approximation (a) and detail (d) coefficients at each decomposition level. A four-level decomposition, utilizing a Daubechies wavelet of order 4 (db4), is employed, resulting in wavelet coefficients that serve as input vectors for the classifier. The extraction of frequency banks ranging from 7.8 to 15.6 Hz is achieved from the wavelet decomposition, with the dominant frequency derived from the wavelet coefficient (Cad4) over 5-s windows using Fast Fourier Transform (FFT) Figure 2.

Frequency representation of approximated and detailed coefficients of SSVEP signals.
SSVEP signals are identified by oscillations with frequencies synchronized with the stimulus frequency.14,15 Because of this, the feature extraction method in many SSVEP-based BCI systems makes use of frequency information that is encoded in the signal.16,17 The features of SSVEP data are going to play a major role in the classification of the distinct tasks. If the classification accuracy is better those outputs can be converted into commands in real-time for BCI applications. The wavelet decomposed SSVEP data from the signal processing stage is used in the feature extraction stage for extracting a useful feature.
In this stage, the frequency of the maximum amplitude of the SSVEP signal from the Oz channel is extracted using Fast Fourier Transform Algorithms. The step-by-step procedure to find the frequency of the maximum amplitude of the signal is explained below,
Assuming s[n] is the wavelet decomposed SSVEP signal from Oz channel, sampled at a frequency fS, and S[k] is the computed FFT in the proposed work:
Step 1: FFT computation
S[k] is the FFT coefficient at frequency index k. N is the total number of samples in the sequence. j is the imaginary unit.
Step 2: Magnitude Calculation

Step 3: Finding the index of maximum magnitude

Step 4: Conversion to frequency
Max_index is the index where the amplitude is maximum. fS is the sampling frequency. N is the total number of samples in the sequence.
Classification
Machine learning (ML) techniques play a pivotal role in actively classifying Steady-State Visual Evoked Potentials (SSVEP) signals within Brain-Computer Interface (BCI) systems. 18 Multiple ML algorithms support the classification task, contributing to the extraction of features and subsequent identification and translation of SSVEP signals into actionable commands. 19 Specific datasets, comprising feature vectors indicating their respective classes, actively undergo training according to the specified classification type duration for classification. This active training process leads to the creation of a decision mechanism algorithm used to classify unknown signals appropriately.20,21 Extracted feature vectors are actively tested with well-known classifiers, including Decision Trees, Linear Discriminant Analysis, and Support Vector Machines, using the Classification Learner App in MATLAB. The study analyzes the results of the three best-performing classifiers based on accuracy metrics.
In the classification of SSVEP signals for a four-class task, the Decision Tree (DT), Linear Discriminant Analysis, and Support Vector Machine models demonstrated outstanding performance, as evidenced by their high accuracy rates. Decision Tree achieved an accuracy of 95.8%, showcasing its capability to effectively handle complex, non-linear relationships within the SSVEP data by segmenting it into decision nodes based on feature values. This approach allowed DT to capture and differentiate intricate patterns in the SSVEP signals with high precision. Linear Discriminant Analysis and Support Vector Machine both achieved remarkable accuracy rates of 96.7%. LDA enhanced classification accuracy by projecting data onto a lower-dimensional space that maximized class separability, thus clarifying distinctions between different SSVEP signal classes. SVM's performance was bolstered by its ability to manage high-dimensional data and determine the optimal hyperplane for class separation, further improved by its kernel functions that address non-linearity. The superior accuracy of these models highlights their effectiveness in overcoming the challenges of SSVEP signal classification, demonstrating their robust performance in distinguishing between multiple classes within the SSVEP data.
While developing an ML algorithm for classifying SSVEP signals represents a crucial initial step, it is equally essential to consider the algorithm's performance when applied to novel data (test set). 22 Ensuring the reliability of the algorithm and the trustworthiness of its predictions becomes imperative. The machine learning algorithm actively memorizes only the training set, enabling it to forecast future examples or those it has not encountered previously with reasonable accuracy. Consequently, understanding and employing methods to assess how well a machine learning model generalizes to novel, untested data emerge as crucial steps in BCI systems. 23 Evaluation criteria, including “K-fold cross-validation” and “confusion matrix,” are actively employed to assess the effectiveness of the machine learning algorithms for this purpose. SVM is actively considered the most promising tool for the classification of single EEG trials.24,25 In particular, Ma et al.25 describe SVM as a technique that addresses challenges associated with small sample sizes and high dimensions, achieving superior classification accuracy. Even in the proposed work, SVM actively outperformed other ML models.
Results and discussion
In this study, we actively train and test three machine learning algorithms using a dataset of extracted feature values. We categorize the feature values into train and test data sets and subject the machine learning algorithms to testing through two different cases. In case-1, we utilize 80% of the total feature values for training the models and allocate the remaining 20% for testing classifier performance. In case-2, we assess the accuracy of all models using 10-fold cross-validation. Extracted features are stored in an Excel file and loaded into the Classification Learner App using MATLAB Software. Among the machine learning models available in the Classification Learner App in MATLAB software, some models like DT, LDA and SVM perform exceptionally well. The results obtained with Decision Tree, LDA, and SVM models, along with preset/kernel functions, are listed in Table 3.
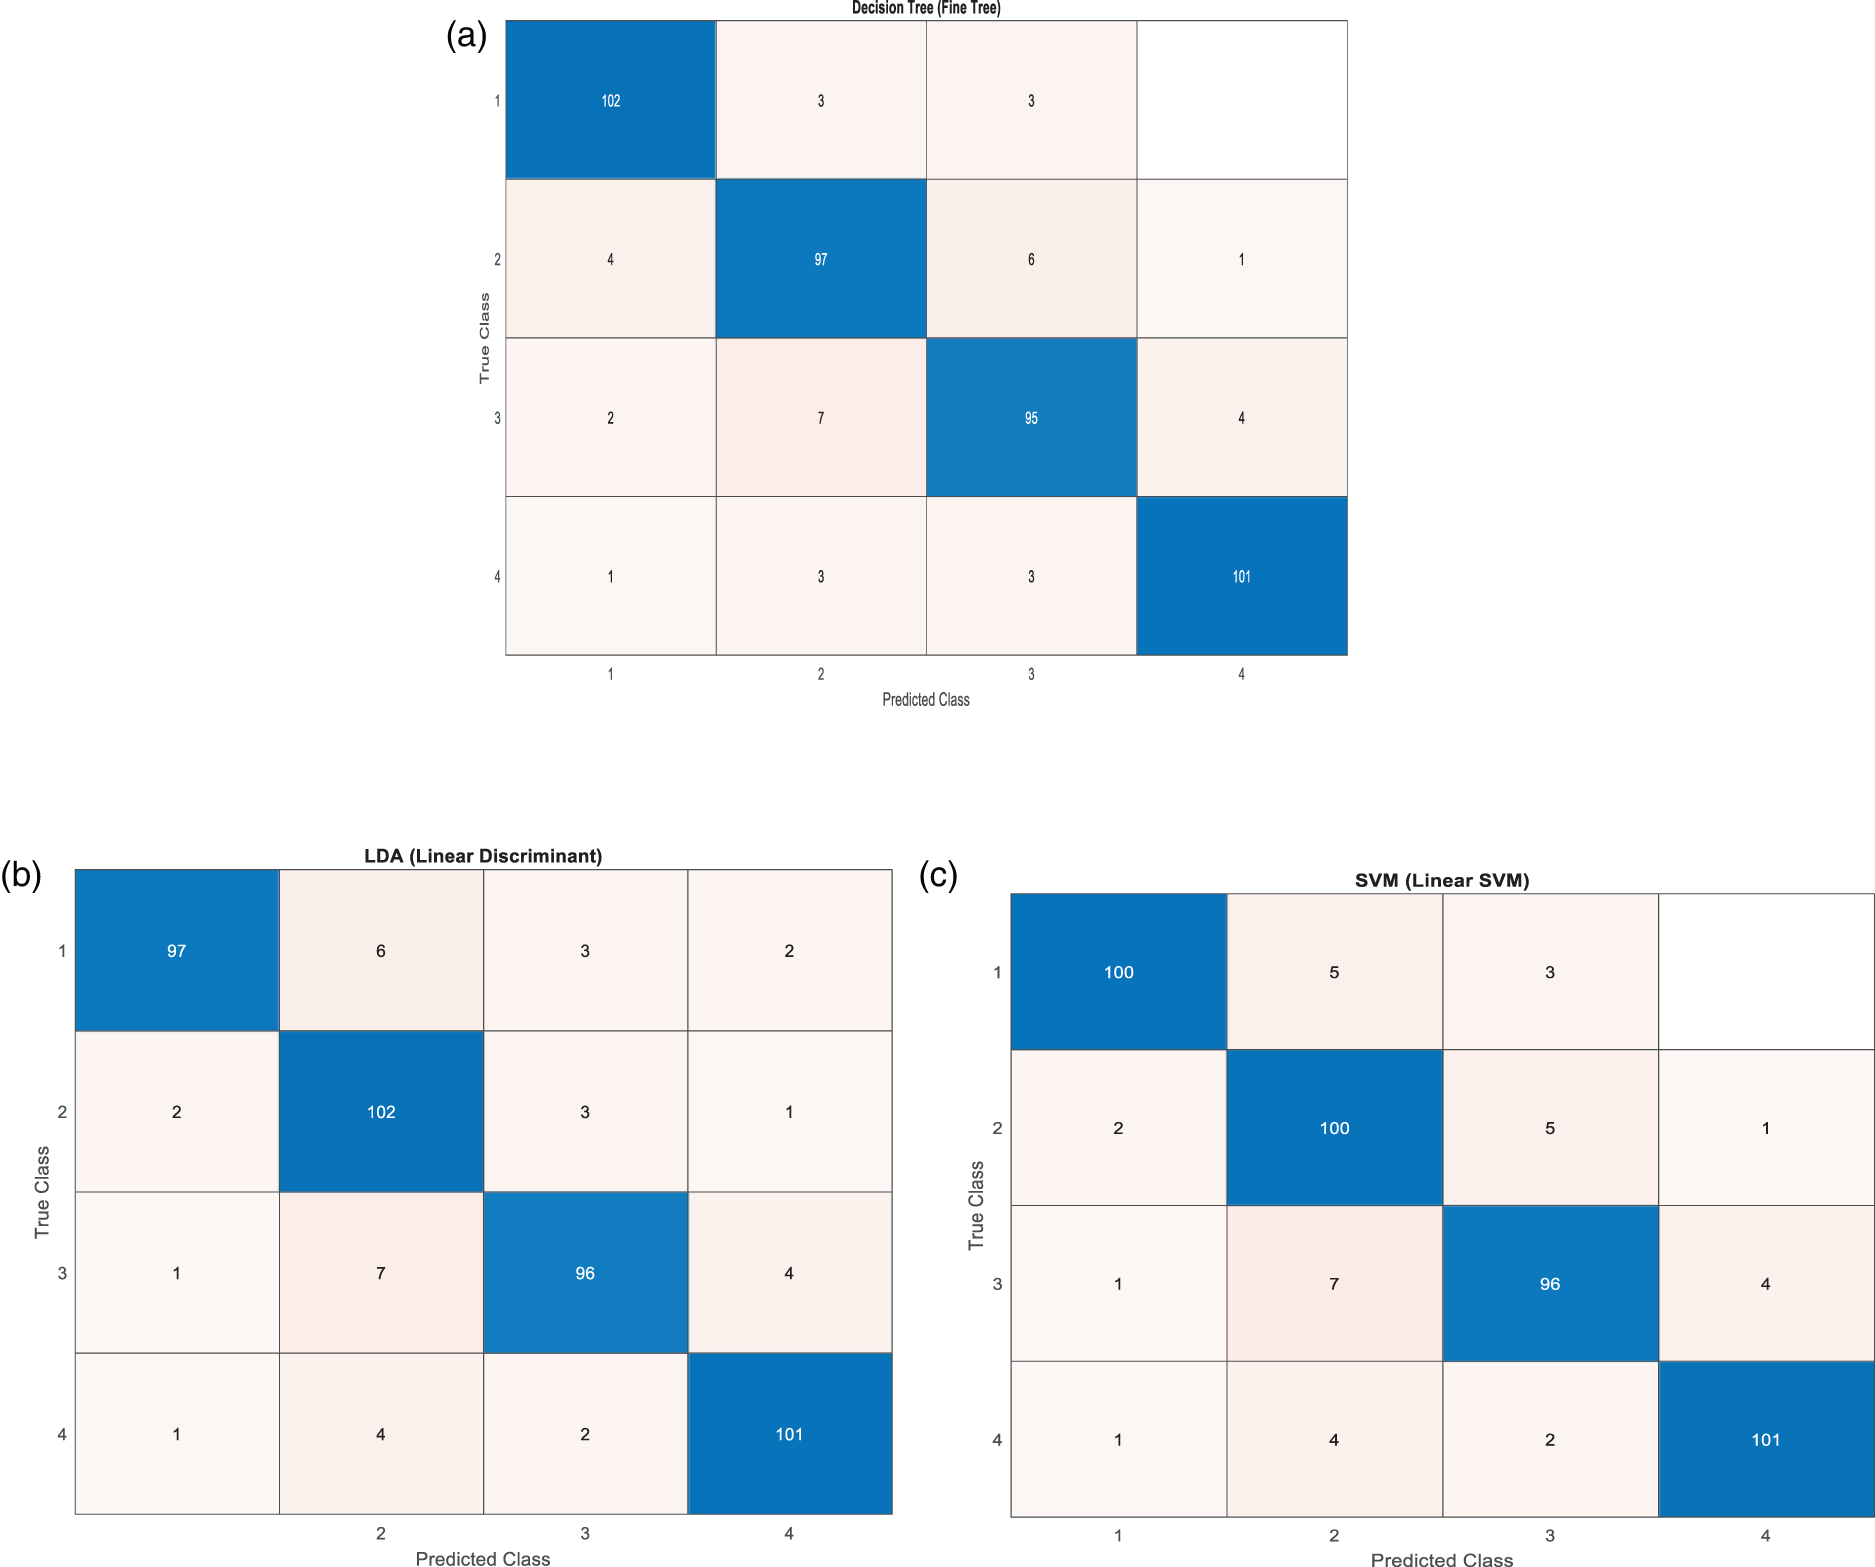
Table 3 reveals that the total subjects are split into two groups, namely Group A and Group B. As mentioned in the data collection section the collected SSVEP data for each subject participated in an experiment comprising 6 blocks. In the proposed work in feature extraction method noticed that the frequency of the maximum amplitude feature for Group A subjects almost matches with input flickering frequencies (9, 10, 11, and 12 Hz), except for a few trials. Consequently, the performance of the machine learning models for Group A subjects is extremely good. The 10-fold cross-validation confusion matrix for all the classifier models for the group-A subjects is shown in Figure 3(a)–(c). Conversely, subjects in Group B the feature value is exactly not matches with the flickering frequencies (9, 10, 11, and 12 Hz) for some of the trails, leading to reduced classifier model performance for this group. The classifier performance for group-B subjects is shown with the 10-fold cross -validation matrix in the Figure 4(a)–(c).

a. 10-fold cross-validation Decision Tree confusion matrix for group-A subjects. b. 10-fold cross-validation LDA confusion matrix for group-A subjects. c. 10-fold cross-validation SVM confusion matrix for group-A subjects.
a. 10-fold cross-validation Decision Tree confusion matrix for group-B subjects. b. 10-fold cross-validation LDA confusion matrix for group-B subjects. c. 10-fold cross-validation SVM confusion matrix for group-B subjects.
Classifiers are good for all the four classes but, only for some of the classes of class-1 is misclassified as class-2 majorly. It is due to the reason that some of feature values of class-1 of group-A subjects close to the class-2 feature values. Similarly, from group-B subjects, it is noticed that some of the classes of class-1 and class-3 are misclassified as class-2 because these two classes feature values are close to class-2 feature values.
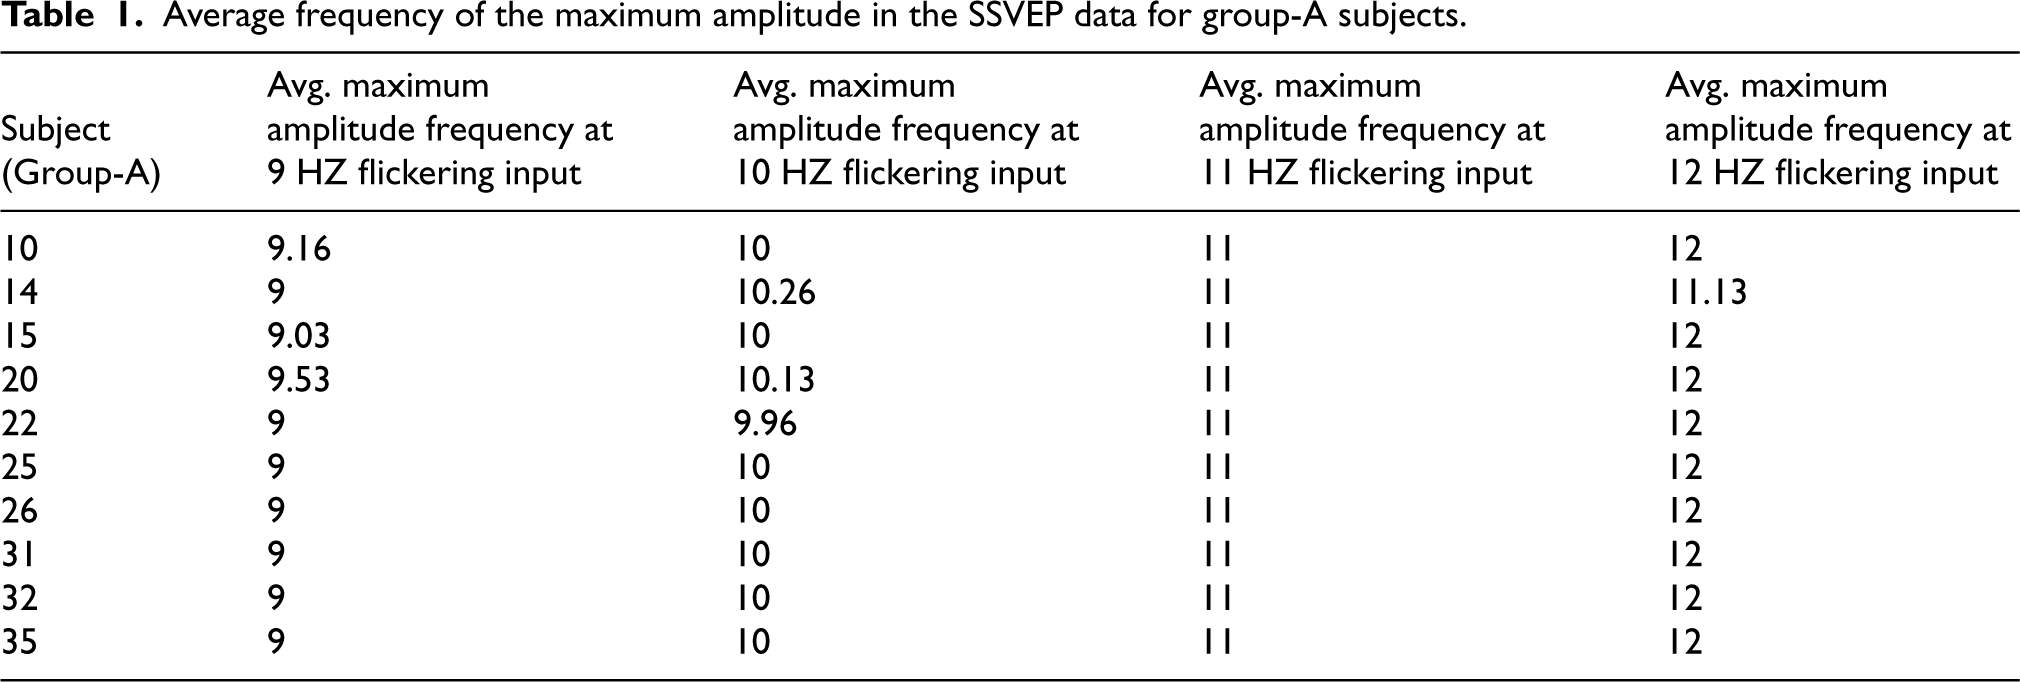
From the Table 1, it is noticed that the average frequency of the most of the subjects matches with input flickering frequencies (9, 10, 11, and 12 Hz) except the subjects 14, and 20. Therefore the classifier performance for these subjects performed extremely well. Whereas from the Table 2 it is noticed that the average frequency of the maximum amplitude of the SSVEP data for some of the subjects (subject-1, 2,5,7,9,18,19,27,30) is not matching with the input flickering frequencies (9, 10, 11, and 12 Hz) for the some of the classes. Therefore, it is obvious that these subjects will not contribute 100% results for the all the four classes. For example, take the case of subject-1 from the Table 2, it is noticed that the average maximum amplitude frequency for the class-1 is 9.53 Hz but the actual frequency is supposed to be 9 Hz. Therefore, for subject-1, class-1 is misclassified as class-2 for the some of the inputs. Similarly, some of the classes for the some of the subjects not matching with the input flickering frequencies as shown in the Table 2. Therefore group-B category subjects average classifier accuracy is slightly lesser than that of group-A subjects which is shown in the Table 3.
Average frequency of the maximum amplitude in the SSVEP data for group-A subjects.
Average frequency of the maximum amplitude in the SSVEP data for group-B subjects.

Classifier performance.
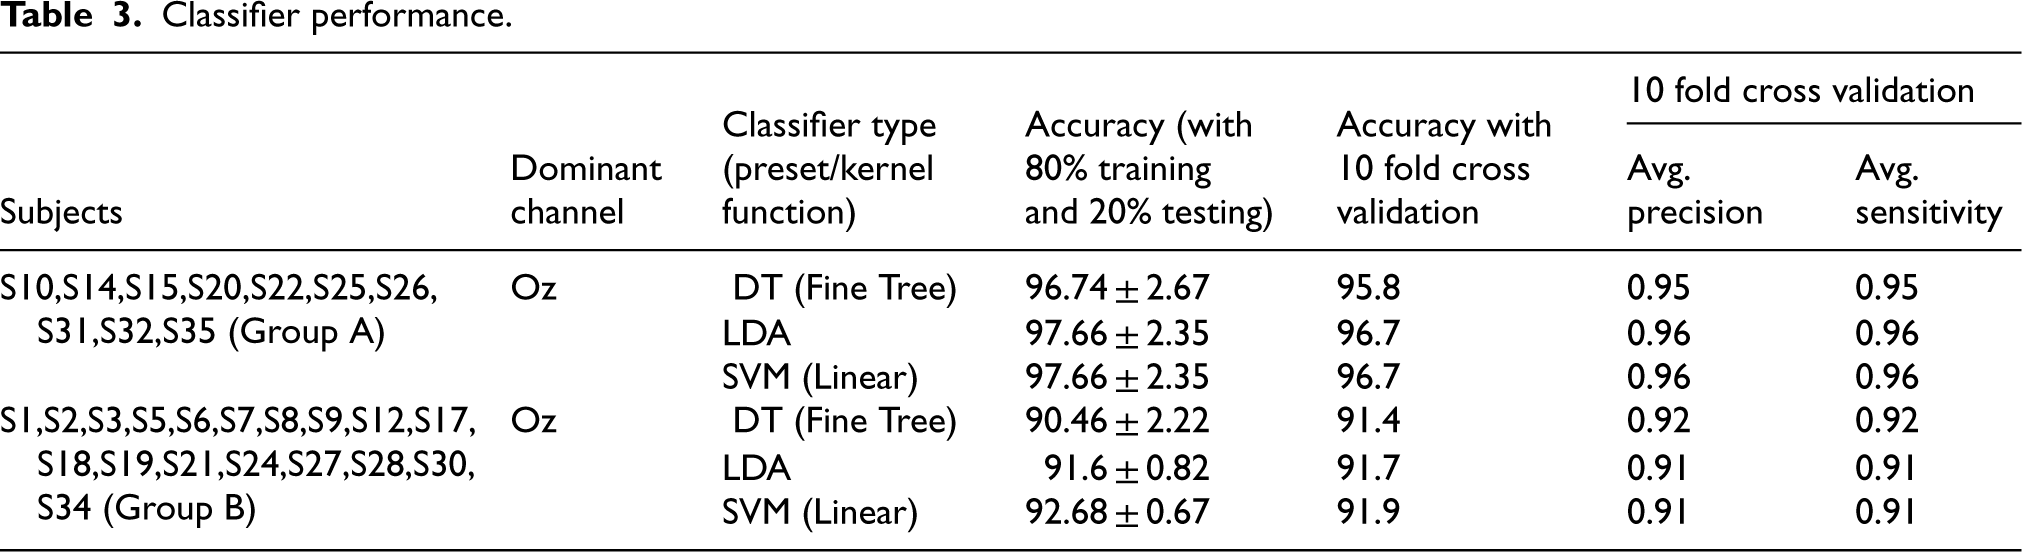
The results analysis in Table 3 underscores that the performance of the classifier largely depends on individual subject performance. Subjects who can precisely focus on the flickering frequency on the monitor exhibit better performance and could greatly contribute in classifier accuracy. From Table 3 it can be noticed that group-A subjects were classified with an average accuracy around 96.7%. And also, the performance of Group A across all three models Decision Tree, Linear Discriminant Analysis, and Support Vector Machine is consistently high, with precision and sensitivity values around 0.95 to 0.96, indicating a strong ability to both accurately classify and detect the true instances of each class. In comparison, Group B shows slightly lower performance, with precision and sensitivity ranging from 0.91 to 0.92 across the models. This suggests that Group A subjects are more distinguishable or easier to classify than Group B. Overall, while both groups exhibit reliable results, Group A achieves superior classification accuracy, especially with LDA and SVM, making these models particularly effective for this group.
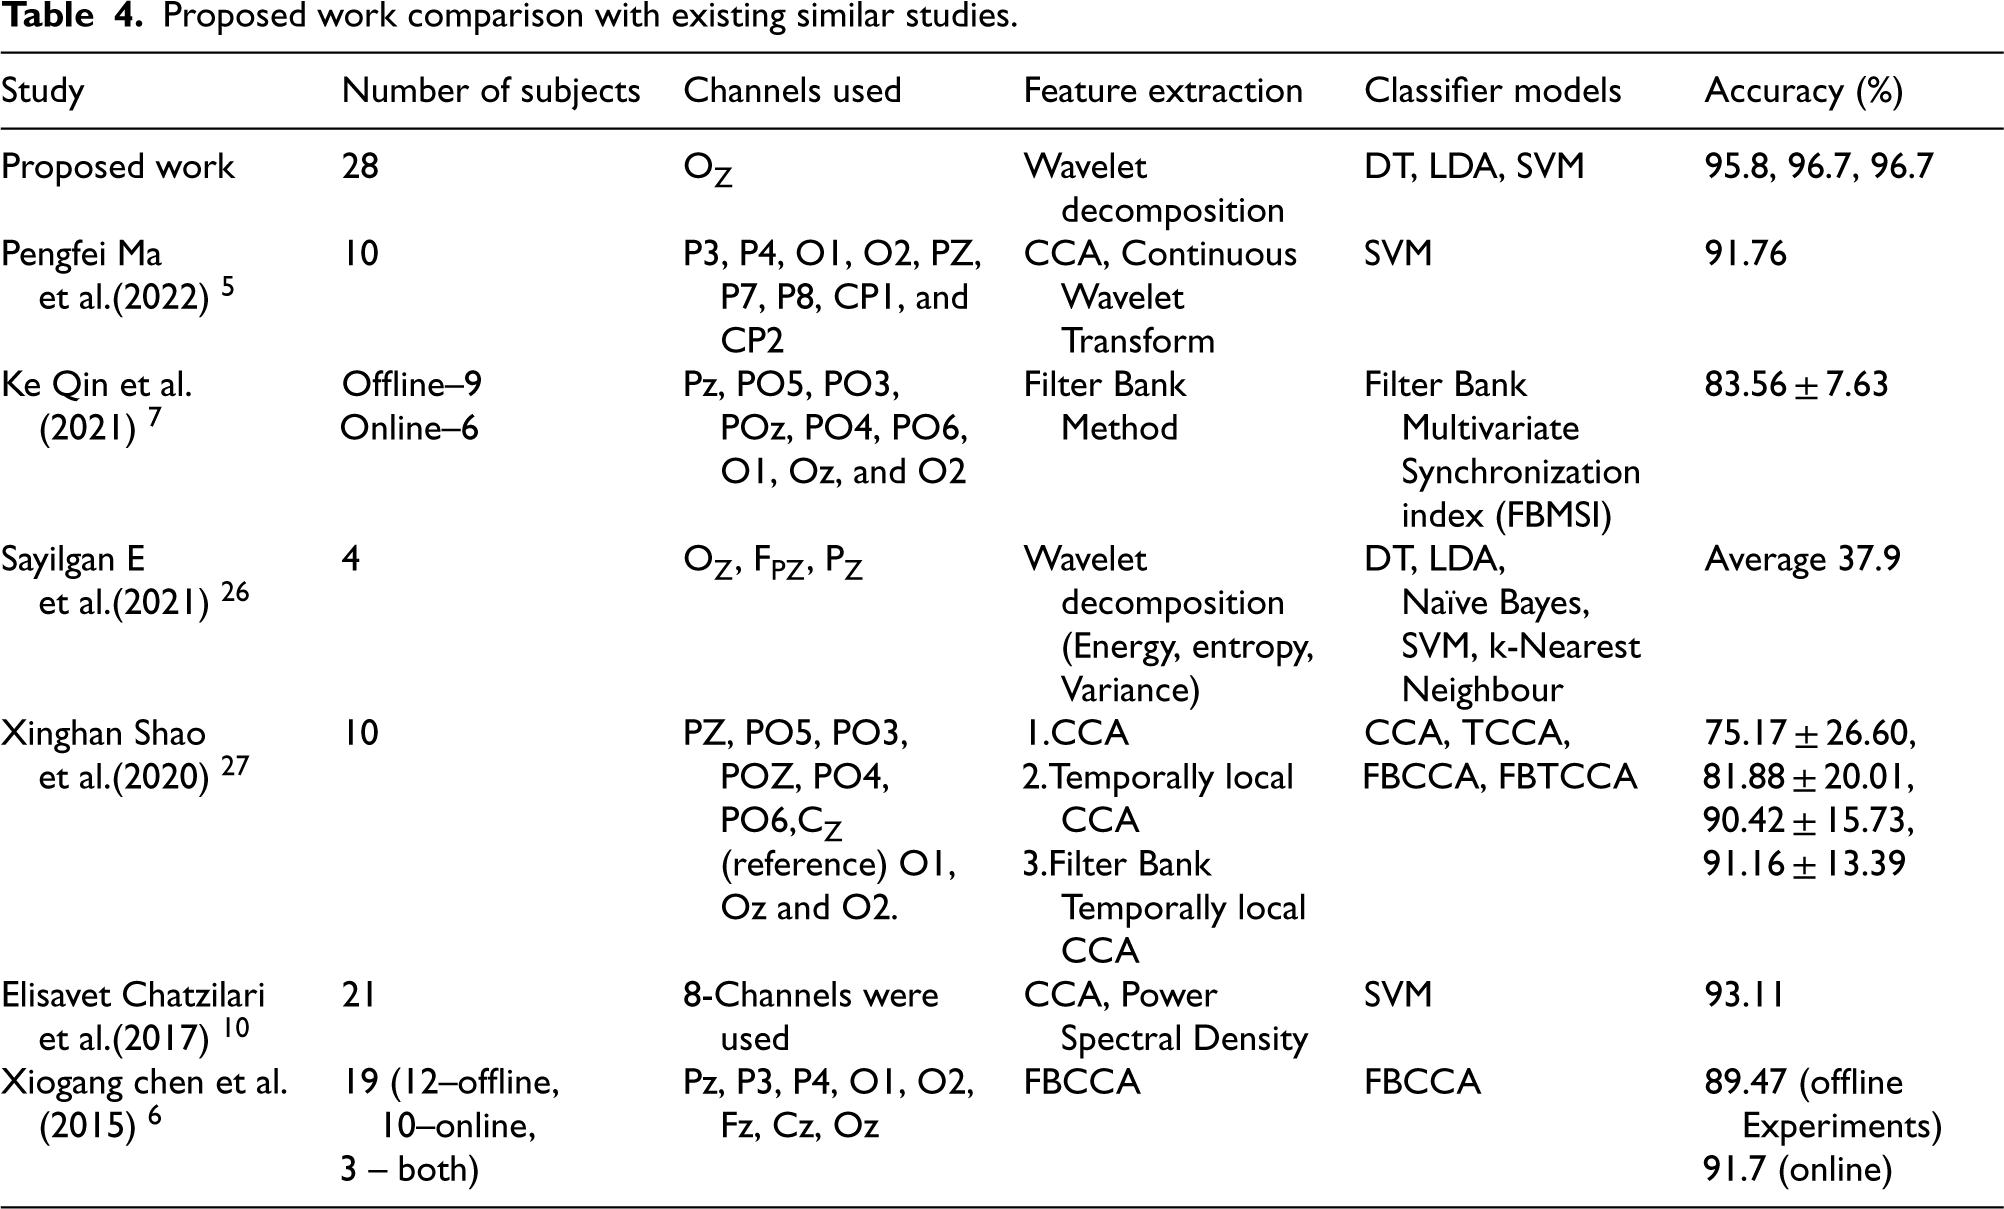
The results obtained with proposed work is compared with existing research work with respect to number subjects participated, number channels used for data acqusition and classifier performance in the Table 4.
Proposed work comparison with existing similar studies.
In this review, a novel methodology for classifying SSVEPs was developed, achieving notable results in both accuracy and practicality. This approach utilized data from 28 subjects, a substantial sample size that enhances the reliability and applicability of the findings. Significantly, the method focused on using a single dominant EEG channel (Oz) for feature extraction, which simplifies the system and makes it more suitable for real-world BCI applications. Reducing the number of channels not only improves usability but also decreases computational demands while maintaining high performance. The feature extraction process employed wavelet decomposition, concentrating on the frequency of maximum amplitude from the SSVEP signal, effectively capturing the essential features needed for accurate classification. By applying machine learning algorithms, including DT, LDA, SVM, the system achieved accuracies of 95.8% with DT and 96.7% with LDA and SVM. These results demonstrate the robustness and efficiency of the method in terms of precision, even with fewer channels. The combination of high accuracy, a large subject pool, and simplified setup makes this approach a promising advancement for BCI applications, providing both enhanced performance and practical utility in real-world settings.
However, despite the high accuracy achieved, some limitations must be noted. The reliance on a single EEG channel (Oz) may limit the capture of broader neural activity, potentially reducing effectiveness across different tasks or individuals. Additionally, the controlled dataset may not fully address real-world challenges, such as environmental noise or user fatigue, which could impact system performance outside laboratory conditions. Future research could enhance the system by incorporating adaptive channel selection to identify additional relevant channels, thereby improving flexibility. Exploring advanced machine learning techniques, such as deep learning, might further boost classification accuracy and robustness. Testing the system in diverse real-world scenarios with varied user groups and wearable setups will also be crucial for optimizing its adaptability and reliability in practical BCI applications.
In our proposed approach, we utilized SSVEP data signals obtained from the Benchmark Dataset provided by Tsinghua BCI Lab. The dataset consists of subjects focusing on 40 characters flickering at varying frequencies ranging from 8 to 15.8 Hz with a 0.2 Hz interval. However, our study focused specifically on SSVEP classification within four frequency classes (9, 10, 11, and 12 Hz). In future research endeavors, expanding the number of classes could facilitate a broader range of commands for diverse BCI applications. The collected SSVEP data underwent four-level wavelet decomposition to extract the requisite frequency band. Utilizing a five-second window, the feature of maximum amplitude frequency was extracted from all subjects. Subsequently, these features were subjected to training and testing using machine learning algorithms like DT, LDA and SVM, and the resultant outcomes were meticulously analyzed. Our study demonstrated superior performance compared to existing models.
A significant contribution of our research lies in the deliberate selection of single dominant channels from the pool of 64-EEG channels. Consequently, our approach relies solely on a single EEG channel and a single feature, enhancing user comfort and reducing computational complexity. This streamlined computational process ensures swift responsiveness of the real-time BCI implementation to user commands, thereby enhancing its effectiveness for BCI applications.
Footnotes
Acknowledgment
The authors sincerely thank the Tsinghua BCI Lab for providing the Benchmark Dataset used in this study. The dataset has been instrumental in facilitating this research.
Consent to publish
No identifiable personal information is disclosed.
Authors contributions
All the authors contributed to the study conception and design. Material preparation, data collection and analysis were performed by Venkatesh Kanagaluru. The first draft of the manuscript was written by Venkatesh Kanagaluru and all authors commented previous version of the manuscript. All authors read and approved the final manuscript.
Funding
The authors received no financial support for the research, authorship, and/or publication of this article.
Declaration of conflicting interests
The authors declared no potential conflicts of interest with respect to the research, authorship, and/or publication of this article.