
Abstract
BACKGROUND:
In order to alleviate muscle fatigue and improve ride comfort, many published studies aimed to improve the seat environment or optimize seating posture. However, the effect of lumbar support on the lumbar muscle of seated subjects under whole body vibration is still unclear.
OBJECTIVE:
This study aimed to investigate the effect of lumbar support magnitude of the seat on lumbar muscle fatigue relief under whole body vibration.
METHODS:
Twenty healthy volunteers without low back pain participated in the experiment. By measuring surface electromyographic signals of erector spinae muscles under vibration or non-vibration for 30 minutes, the effect of different lumbar support conditions on muscle fatigue was analyzed. The magnitude of lumbar support
RESULTS:
The results showed that lumbar muscle activation levels vary under different support conditions. For the small support case (
CONCLUSIONS:
The results indicate that the small support yields the minimum muscle contraction (low muscle contraction intensity) under vibration, which is more helpful for relieving lumbar muscle fatigue than no support or large support cases. Therefore, an appropriate lumbar support of seats is necessary for alleviating lumbar muscle fatigue.
Introduction
The effects of whole body vibration on the human body are related to vibration frequency, amplitude, action direction and action time, and vehicle occupants are typically exposed to unpleasant whole body vibration for extended period of time [1, 2]. The transmission of unwanted vibration to the human body can lead to fatigue and discomfort. For example, low back pain and degenerative diseases of the spine occur more frequently among vehicle drivers exposed to vibration [3]. The vibration frequency of a car is generally less than 80 Hz in normal driving, and the unwanted vibration associated with vehicle driving mainly distributes in the low-frequency range, especially in vertical direction. Specifically, the seated human body is sensitive to the frequency range of 4–12.5 Hz in the vertical direction according to ISO (ISO2631-1 1997(E)), and the vertical vibration of 8–12.5 Hz has obvious influence on human spine system according to GB/T (GB/T4970 1996). An experimental study suggested that vibration at these frequencies induced greater muscle activity and led to muscle fatigue, which might be a contributing mechanism of back pain [4]. Experimental and finite element studies showed that long-term vibration would bring musculoskeletal disorders to human body [5, 6, 7].
The improved seating environment or the optimized seating posture is helpful to alleviate muscle fatigue during whole body vibration and thus improve ride comfort [8]. For example, Gan et al. [9] used an active seat system to reduce the vibration level transmitted to the seat pan and occupants’ body under low frequency excitation. Beard and Griffin [10] investigated the effect of seat backrest on seating comfort under whole body vibration. O’Sullivan et al. [11] compared lumbar posture and trunk muscle activation on a dynamic ergonomic chair with those on a standard backless office chair, and concluded that maintaining lordosis with less muscle activation during prolonged sitting could reduce the fatigue associated with upright sitting. Xia et al. [12] investigated the seated human responses to complex impact and vibration, and the results suggested that back injury was more likely to occur in work environments including mechanical shocks.
Using oxygen consumption, heart rate and blood lactic acid to evaluate muscle fatigue can reflect the change of overall metabolism, but the local muscle fatigue is difficult to measure and evaluate accurately, especially under low intensity working conditions. Surface electromyographic (sEMG) signal is a very efficient method to evaluate local muscle function and state [13]. For example, Coorevits et al. [14] evaluated the validity of EMG in prediction of the back muscle fatigue. Roy et al. [15] applied EMG to evaluate back muscle function under dynamic contraction, and found that static and dynamic tasks led to very different patterns of EMG spectral changes. Bluthner et al. [16] elaborated methods for analyzing the relationship between random whole body vibration and EMG responses of back muscles, and studied the myoelectric response of back muscles to vertical random whole body vibration at different postures.
The sEMG signals can be extracted as amplitude variable and frequency variable [17, 18], which represent sEMG characteristics in time domain and frequency domain, respectively. The amplitude variable of sEMG has been widely used to study different back muscles and to evaluate degree of low back pain (LBP). For example, Reger et al. [19] accurately classified normal persons and patients with LBP by analyzing the root mean square (RMS) value of sEMG. The frequency analysis of sEMG is also widely used to monitor the occurrence and to change the process of local muscle fatigue in many studies [20, 21, 22], which mainly uses the declining trend of median frequency (MDF) or mean frequency (MNF) of sEMG to evaluate muscle fatigue. Therefore, this paper applied both kinds of variables to predict lumbar muscle fatigue and state.
Although the abovementioned studies found that muscle activity and fatigue were related to whole body vibration and postures, the effect of lumbar support on lumbar muscle of seated subjects under vibration was still unclear. The lumbar support system is mounted on the backrest of a vehicle seat and provides support for lumbar region of the seat occupant and thereby provides the desired user comfort. In this study, the seat lumbar support was proposed to adjust spine posture for reducing the influence of vibration on lumbar muscle. We hypothesized that an optimal support size could decease the muscle fatigue more effectively. Therefore, the aim of this study was to evaluate the effect of different-magnitude lumbar support conditions on lumbar muscle response or fatigue under vibration using sEMG method, and to study the variation trends of all characteristic variables of sEMG with time. Also, the effect of vibration on lumbar muscle was investigated.
Methods
Subjects
Twenty healthy volunteers (fifteen males and five females) without a history of LBP participated in the experiment. Their mean
Experimental equipment
The experimental equipment mainly includes a vehicle seat with a lumbar support device, a vibration test device and the sEMG measurement and recording system (Delsys). The seat was derived from a coach and was mounted on the vibration test device. The seat was chosen due to its correlation with long time driving. The self-designed lumbar support device which could be adjusted in the directions of N and H (the direction N is vertical to seatback, and the direction H is parallel to the seatback) was mounted on the seat backrest. Subjects could adjust the lumbar support region according to their body height in the direction of H, as shown in Fig. 1. By adjusting the adjustment plate 2 of the lumbar support device, different regions along the lumbar spine could be supported. The supporting magnitude
Lumbar support scheme and parameters of sitting posture (1-lumbar support plate, 2-adjustment plate, 3-fixed plate, 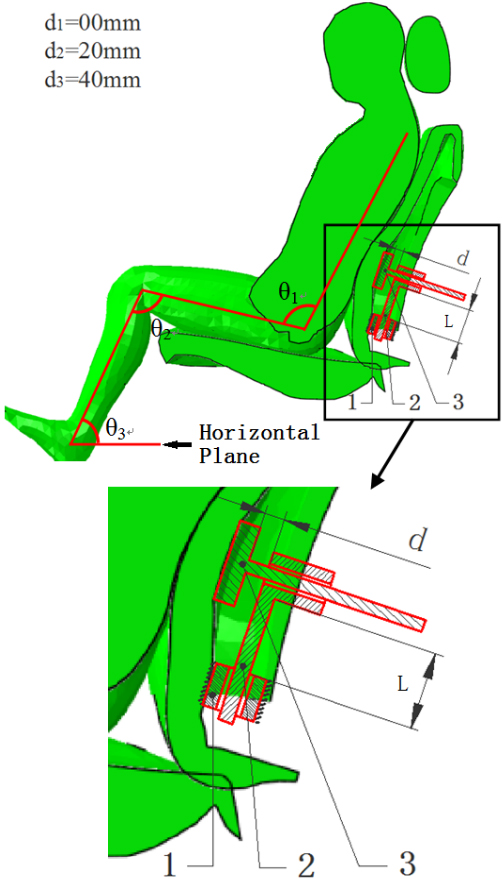
Vibration test of seating human body and the experiment test system.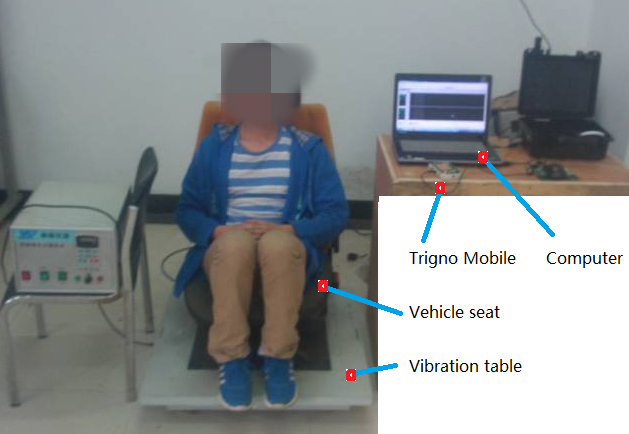
The vibration test device was an electromagnetic device, which can output vibration at fixed frequency and scanning frequency, as shown in Fig. 2. In this study, the vibration frequency of the vibration test device was set to 10 Hz and the vibration magnitude was set as 0.42 m/s
As shown in Fig. 1, the seating posture parameters of the tested subjects with their hands laying on legs were set as
Signal collection protocol.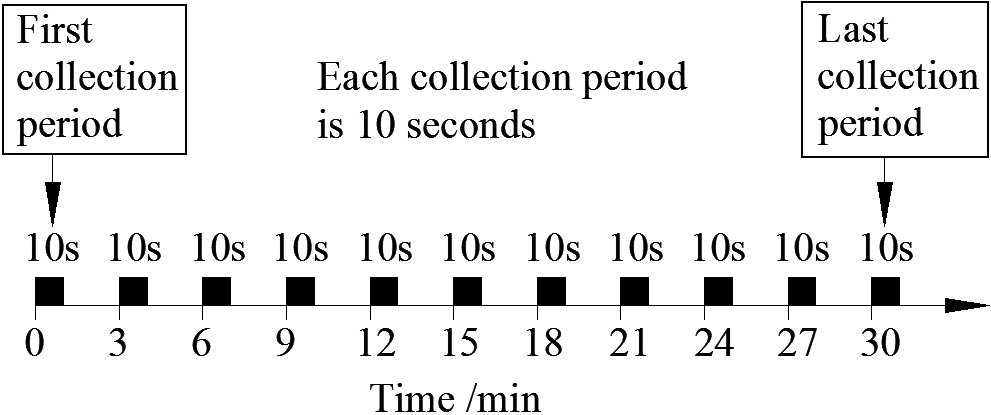
As the SEMG signal was very weak and easily affected by disturbance, it was necessary to process the raw signal before analyzing it in the time and frequency domains. Disturbances such as an offset can be reduced by high-pass filtering with a cut-off frequency without a phase shift [16]. One second of signal at the starting and the ending of each collection period was respectively removed from the 10 seconds of raw signal for each collection, then the rest of 8 seconds of sEMG signal was treated with the digital Butterworth high-pass filter (
Flow diagram of sEMG data treatment.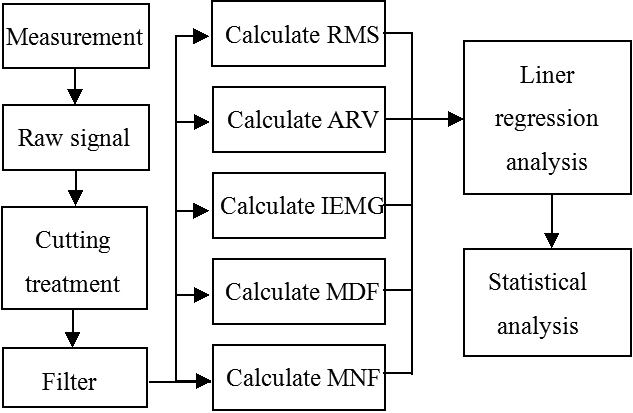
PSD curves of filtered EMG of the subject No.2. (a) Mean PSD of filtered EMG within ten minutes under three lumbar support conditions, and (b) PSD of filtered EMG under the lumbar support condition of d2 in different time regions: 0 min, 3 min, …, and 30 min.
Amplitude variables analyzed in time domain mainly include RMS, average rectified value (ARV) and integrate EMG (IEMG). All of them describe the amplitude changes of EMG signals, and are called as amplitude variables. The calculation period for RMS, ARV and IEMG of EMG was 1 second. Frequency variables analyzed in frequency domain mainly include MDF and MNF, both of them describe the changes of frequency variables of EMG signals. The calculation period for MDF and MNF was 1 second. To analyze the variation trend of these variables, linear regression analysis was conducted on the amplitude variables and frequency variables, which were obtained by the above-mentioned calculation methods. In order to conduct a comparison of the effect of different support conditions on muscle response or fatigue, statistical analysis was also conducted on the amplitude variables and frequency variables, the intercept and slope of RMS regression analysis (the intercept of RMS regression analysis is the initial RMS value or muscle activation level) in different lumbar support groups were compared with a paired
Amplitude variables for the support parameter
As the calculating period T was 1 second, the ARV and IEMG were equal. The points of the average rectified value were in the IEMG curve for each collection period in Fig. 6b, so the same curve was used to describe their variation trends in Fig. 6a and c. The amplitude variables of sEMG, such as RMS, ARV and IEMG, have the same variation trends in Fig. 6, so the statistical analysis was conducted only on the RMS value.
Amplitude variable analysis for subject No.2 under vibration. (a) Amplitude variables and its regression analysis of sEMG signal for some collection periods, (b) Amplitude variables of the connected sEMG data for 11 collection-periods and (c) Mean amplitude variables and regression analysis for all collection-periods.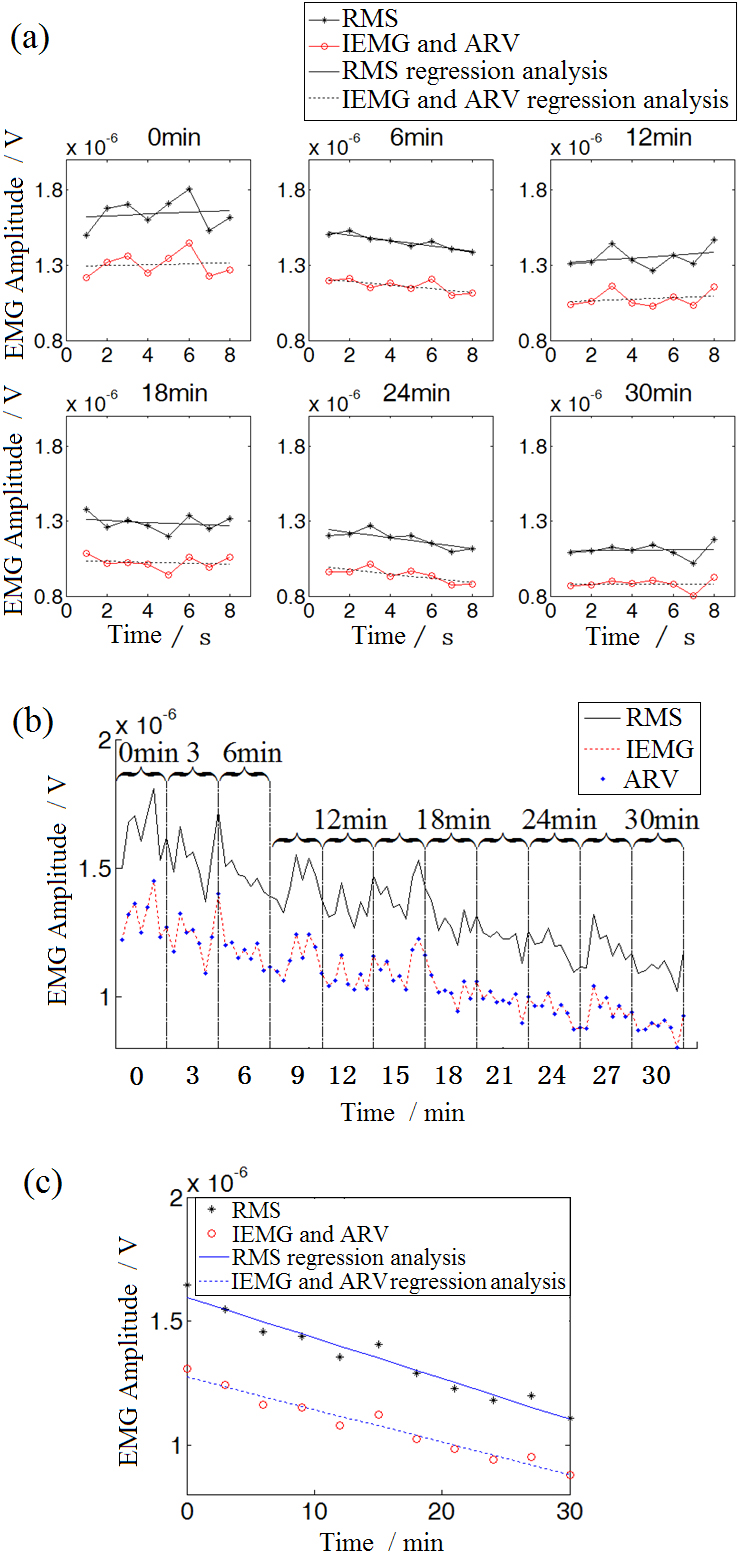
Figure 6a shows that the amplitude variables of sEMG in different collection periods have different changes. After regression analysis, it can be seen that the amplitude variables in the collection periods of the 0th min, 12th min and 30th min have the upward trend, and the amplitude variables in the collection periods of the 6th min, 18th min and 24thmin have the downward trend, but the upward or downward trends are not obvious due to the short time. Then all amplitude variables of the 11 sections of signals from the 0 min, 3 min until 30 min are spliced together, as shown in Fig. 6b. It can be seen that the general trend of each amplitude variable is declining, and the downward trend is obvious.
After averaging amplitude variables in each collection period, the regression analysis was conducted to the averaged amplitude values for all collection periods, as shown in Fig. 6c. The results indicated that the downward trend of all amplitude variables was obvious and the declining rate was similar, so the subsequent study would be carried out only to the statistical analysis of RMS regression analysis.
Figure 7 shows the frequency variable analysis on the sEMG signals. The frequency variables, such as MDF and MNF, in different collection periods have individual variation trends and appear oscillating changes. The frequency variables decrease within the 0th min, 6th min, 18th min and 30th min collection periods, and increase in the 12th min and 24th min collection periods. The oscillating amplitude of frequency variables in most of collection periods is relatively large, as shown in Fig. 7a. Although the oscillating amplitude of MNF is smaller than that of MDF, both of them are not suitable for evaluating the muscle fatigue as an indicator.
Frequency variable analysis for subject No.2 under vibration. (a) Frequency variables and its regression analysis of sEMG signal for different periods, (b) Frequency variables of the connected sEMG data for 11 collection-periods and (c) Mean frequency variables and regression analysis of all collection-periods.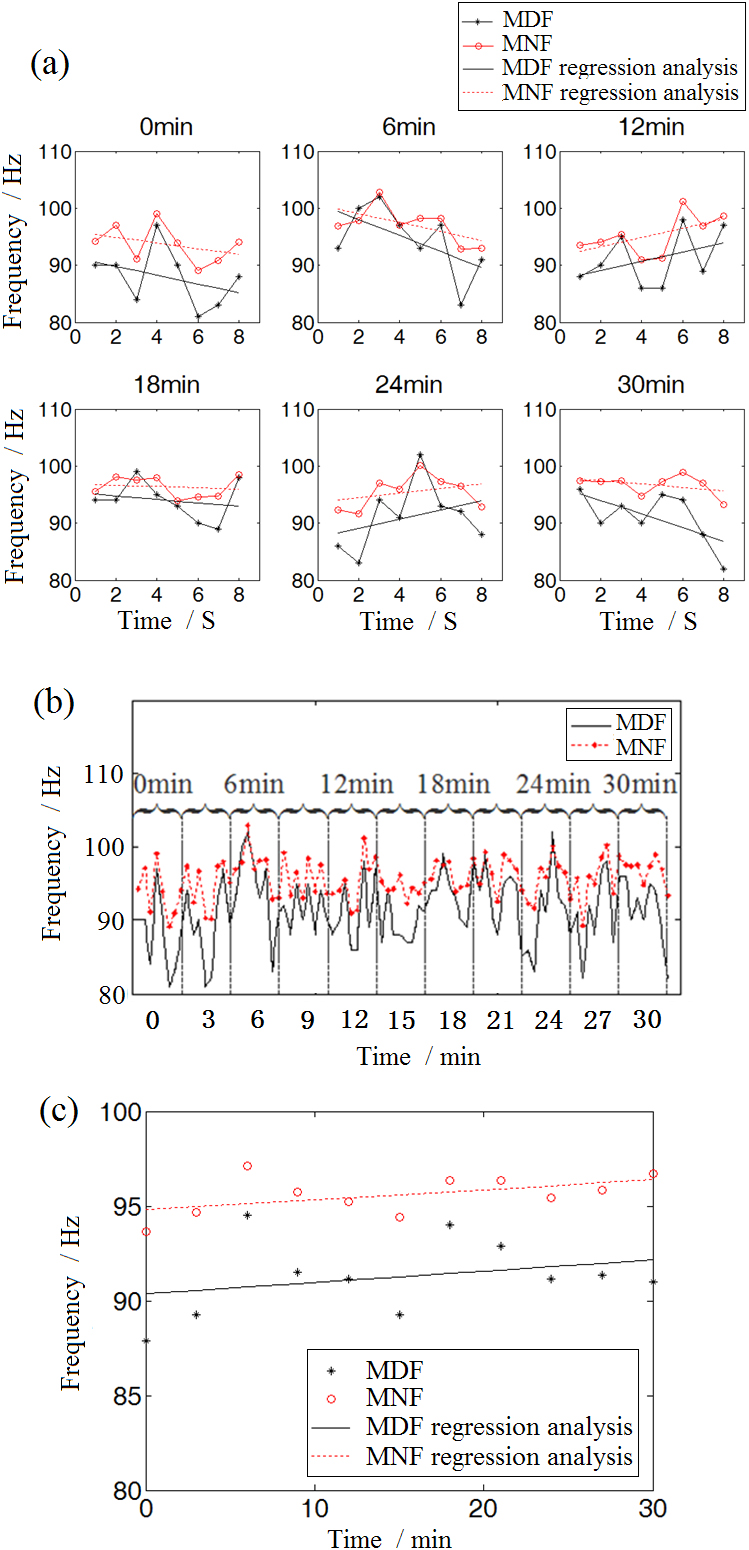
All frequency variables of the 11 sections of signals from the 0th min, 3th min until 30th min were spliced together, and the variation trends of frequency variables of the connected sEMG data during the 30 minutes are shown in Fig. 7b. There is no remarkable upward trend or downward trend in the MDF and MNF curves, and both of curves show the random changes within 80–100 Hz. After averaging the frequency variables in every collection period, the regression analysis was conducted on the mean values of all collection periods. Figure 7c shows that all frequency variables keep rising with time, but the rising amplitude is smaller than the fluctuating magnitude.
Based on the above-mentioned results of amplitude and frequency variable analyses, the statistical analysis was conducted on the slopes of linear regression analyses for six groups of experiments. The statistics of RMS and MDF regression analyses for vibration conditions are shown in Table 1. The test results for all regression analyses are shown in Table 2. The results of paired
Statistic results of regression analysis (mean value and standard errors) for vibration condition. Intercept of RMS regression analysis is equal to initial RMS of EMG, and intercept of MDF regression analysis is equal to initial MDF of EMG.
Denotes
0.05
Statistic results of regression analysis (mean value and standard errors) for vibration condition. Intercept of RMS regression analysis is equal to initial RMS of EMG, and intercept of MDF regression analysis is equal to initial MDF of EMG.
The coefficients of determination
Statistic results of RMS regression analysis in the experiments with and without vibration. (a) Slope value and (b) Intercept value.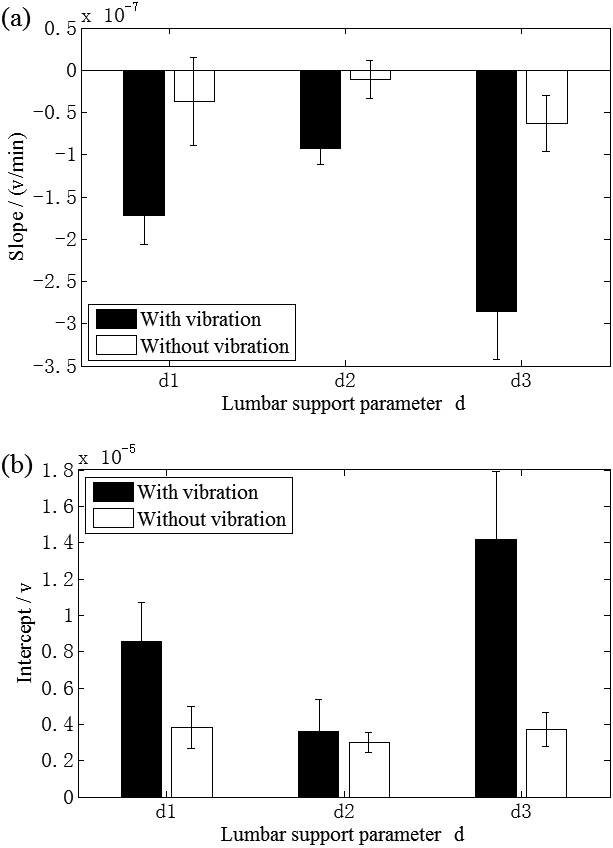
The statistical results of the intercept value of RMS regression analysis are shown in Table 1 and Fig. 8b. The results of paired t-test indicate that the intercepts in different lumbar support groups are obviously different (
After analyzing the effect of different lumbar support conditions on lumbar muscle, we analyzed the effect of vibration on lumbar muscle. It can be seen that the absolute slope and intercept of RMS under vibration are higher than those without vibration (
The effect of different lumbar support conditions of vehicle seat on lumbar muscle activation level or fatigue under whole body vibration was investigated in this study. The characteristic variables (RMS and MDF) of sEMG signal were used to analyze the lumbar muscle activation level and fatigue, namely to analyze the variation features of characteristic variables of sEMG signal along with time and the magnitude changing of lumbar support under vibration. Moreover, the effect of whole body vibration on lumbar muscle was investigated by comparing initial RMS value of sEMG (muscle activation level).
The amplitude of EMG signal measured from skin surface can be applied to monitor the level of muscle activation, as well as to estimate the magnitude of muscle contraction intensity [15]. In this study, from the intercept statistics of RMS regression analysis of all subjects in three groups of experiment under vibration, the experimental results show that the initial RMS values in group
Our vibration and no-vibration experimental results are consistent with the subjective evaluation results of Carcone and Keir [23], who performed a sedentary experiment (no vibration) under different lumbar pad conditions. Their study showed that most volunteers preferred no lumbar pad or a small lumbar pad at the lower back of vehicle seats, and they concluded that there was an optimal lumbar support thickness within 0–30 mm. In our experimental study, the results show that the best lumbar support thickness is around 20 mm for releasing the lumbar muscle fatigue under whole body vibration. The results without vibration also show that the small support case is better than the no-support case and large support case, as shown in Fig. 8. Therefore, it can be concluded that it is necessary and advantageous for alleviating the lumbar muscle fatigue for both vibration and no-vibration conditions by choosing an appropriate amount of lumbar support, such as the small support case (
In addition, many investigations mainly focused on the frequency change of EMG signal for high intensity muscle contraction (50% of the maximum voluntary contraction or more). However, the change of frequency variables of EMG signal for long time work and low intensity muscle contraction is not clear enough yet. In the experiment of low intensity of muscle contraction [25], about 25% of maximum voluntary contraction, the amplitude variables (RMS, ARV and IEMG) of EMG had been found to decrease generally with time. Clancy et al. [26] also found that the MNF of EMG signal had no statistical trend in the periodic contraction and recovery period, as well as any uniform variation trend, while monitoring the initial MNF and the slope for static contraction. From the present experimental results, it can be seen that all amplitude variables of sEMG signal have a more definitely downward trend (the slope of RMS regression analysis is negative, as shown in Fig. 6). In contrast, the frequency variable of sEMG signal sometimes decreases, and sometimes increases in different collection periods in our study. Moreover, there is not a definitely increasing or decreasing trend during the whole experiment time of 30 minutes. The amplitude value of frequency variables randomly fluctuates within 80–100 Hz (Fig. 7b). Therefore, the amplitude variables are more effective than frequency variables to monitor the muscle state on the condition of low intensity of muscle contraction and long-time work.
The study is not without limitations. Although all subjects were required to keep their body in a fixed state during the recording data time, the inevitable body moving of subjects might have affected the EMG results in the experiments. The vibration frequency in the experiments was a fixed value, and the effect of different vibration frequencies on lumbar muscle fatigue under whole body vibration should be considered in future studies. In addition, the seat belt was not used in the experiments, so its effect should also be further investigated in future studies.
Conclusions
The sEMG signal was used to analyze the effect of lumbar support on lumbar muscle fatigue under both of vibration and no-vibration. The experimental results showed that the lumbar muscle fatigue ratio decreased more quickly under the vibration condition than the no-vibration condition. Further, it was found that the self-designed lumbar support device, mounted on the seat backrest, with appropriate support magnitude (around
Footnotes
Acknowledgments
This project is supported by the National Natural Science Foundation of China (Grant nos 51875096 and 52005089) and Fundamental Research Funds for the Central Universities (Grant no. N2103010).
Conflict of interest
None declared.