
Abstract
BACKGROUND:
Analysis of the reactions of different organs to external stimuli is an important area of research in physiological science.
OBJECTIVE:
In this paper, we investigated the correlation between the brain and facial muscle activities by information-based analysis of electroencephalogram (EEG) signals and electromyogram (EMG) signals using Shannon entropy.
METHOD:
The EEG and EMG signals of thirteen subjects were recorded during rest and auditory stimulations using relaxing, pop, and rock music. Accordingly, we calculated the Shannon entropy of these signals.
RESULTS:
The results showed that rock music has a greater effect on the information of EEG and EMG signals than pop music, which itself has a greater effect than relaxing music. Furthermore, a strong correlation (
CONCLUSION:
The activities of the facial muscle and brain are correlated in different conditions. This technique can be utilized to investigate the correlation between the activities of different organs versus brain activity in different situations.
Introduction
Analysis of the reactions of different organs to external stimuli is an important area of research in physiological science. For this purpose, researchers apply different stimuli on subjects and accordingly analyze their bodies’ reactions through analysis of related physiological signals. The human brain and facial muscle are two organs that are highly reactive to external changes around humans. For this purpose, many works have been reported in the literature which employed different techniques (e.g. fractal theory [1, 2, 3, 4, 5, 6, 7, 8, 9, 10], sample entropy [11, 12, 13, 14, 15, 16, 17, 18, 19, 20], approximate entropy [21, 22, 23]) to investigate the brain or facial muscle reactions to different external stimuli by analysis of EEG and facial EMG signals.
Network physiology is a new area of research under physiological science which aims to decode the correlation between the activities of different organs. Since the brain as the top processing center of the human body controls all actions of the body by sending messages to them through the nervous system, there should be correlations between the brain signals (EEG signals) and related physiological signals of different organs. To decode this correlation, we can utilize different signal processing techniques. Focusing on decoding the correlation between brain and muscle activations, several studies have worked on this area by analyzing EEG and EMG signals in different conditions. For instance, there are works which decoded the correlation between muscle and brain activation by analysis of EMG and EEG signals in walking and standing balance while receiving different perturbations using complexity-based analysis [24], for Parkinson’s patients using Artificial Neural Network [25], for hand orthosis supported neuro-rehabilitation using a new corticomuscular feature extraction method [26], for post-stroke patients using symbolic transfer entropy [27], during “fist-rib”/“palm-fist” test using wavelet analysis [28], during isometric contraction and its imaginary execution using power analysis [29], and for startle-induced seizures using the relative gain array [30].
Since there is a transfer of information between the brain and different organs through network physiology, analysis of related physiological signals using information theory is meaningful [31]. Therefore, in this research, we decode the coupling between the brain and facial muscle by quantifying the information content of EEG and EMG signals. For this purpose, Shannon entropy was used as the indicator of the information content of signals.
Shannon entropy has been widely applied in the analysis of various biological and physiological time series (e.g., speech signals [31], eye movements [32, 33, 34], RNA time series [35, 36], GSR signals [37], ECG signals [38, 39]). Similarly, many works reported in the literature which utilized Shannon entropy to quantify the information content of EEG signals. For instance, the reported works on the analysis of brain activation in external stimulation [40, 41, 42], body movements [43], and different diseases [44] can be mentioned. Many studies have also benefited from Shannon entropy to analyze the muscle reaction in different conditions such as external stimulation [45, 46], body movements [47], and different diseases [48]. Therefore, in this work, Shannon entropy was used to decode the correlation between brain and facial muscle activation by analysis of the information content of EEG and facial EMG signals
In the next section, the method of analysis based on the Shannon entropy will be discussed. Then, the data collection and analysis are outlined. After that, the results are presented, followed by the discussion and conclusion.
Method
The correlation among the activations of the brain and facial muscle in different auditory stimulations was decoded in this paper. Since EEG and EMG signals contain information, and due to the brain-facial muscles connection through the network physiology, we hypothesize that there should be an interlink of information between them, since each stimulus transfers information to the brain and accordingly, the brain communicates with facial muscles about it. Therefore, Shannon entropy was utilized to quantify the information content of EEG and EMG signals. Shannon entropy, as shown in Eq. (1), is related to the probability of occurrence (
We quantify the information contents of EEG and EMG signals using Shannon entropy and then evaluate their changes among different auditory stimulations. We chose three pieces of music (as auditory stimuli) to stimulate subjects. For our experiment, we downloaded “Zen”, “Happy”, and “My life” music from YouTube, and used them in our experiment as relaxing, pop, and rock music. Therefore, we stimulate subjects using these pieces of music and then analyze how the information contents of EEG and facial EMG signals change between different stimulations.
The experiment has been approved by the ethical committee of Monash University (No. 19050). The experiment was conducted on thirteen healthy students (3 F, 10 M, 18–22 years old). All participants signed the consent form prior to the start of the experiment. The participants were interviewed before the start of the experiment to ensure that they are healthy and without any history or current neurological and visual disorder. They were also asked whether they had previously taken any medications or currently took any. The participants did not consume beverages containing alcohol/caffeine within 48 hours before the start of the experiment.
EMOTIV EPOC
Schematic of the experiment.
Placement of EEG electrodes based on the 10–20 system.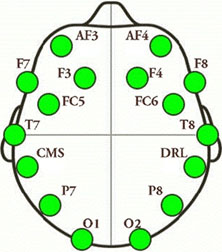
The placement of EMG electrodes.
The experiment was started by recording EEG and EMG signals of subjects during rest for one minute. Then, we played first, second, and third music files for the subjects, and recorded their EEG and EMG signals. Each music was played for one minute, and one-minute rest was given to subjects between every two stimulations. The experiment was repeated for all subjects in a second session. The recorded data belonging to some sessions were removed from analysis due to the poor connection (or disconnection) of devices.
In the case of data analysis, initially, we removed the DC offset (at approximately 4200
The information content of EEG signals (and EMG signals) among various stimulations was compared by running the Posthoc Tukey test. Cohen’s
The values of the Shannon entropy of EEG signals are shown in Fig. 4. As can be seen, EEG signals’ entropy has the biggest value during rest. On the other hand, when we play relaxing, pop, and rock music to subjects, the EEG signals’ entropy decreases. In other words, the information of EEG signals reduces by playing relaxing, pop, and rock music to subjects. The ANOVA test’s results (
Table 1 presents the results of pairwise comparisons of the entropy of EEG signals. Based on this result, there were significant changes in the information of EEG signals between rest vs. rock music, relaxing music vs. rock music, and pop music vs. rock music. In other words, rock music caused a significant change in the information of EEG signals compared to other conditions (rest and stimulation). The results also show that by moving toward rock music, the alterations of information of EEG signals become more significant.
Posthoc test results for the entropy of EEG signals
Posthoc test results for the entropy of EEG signals
Table 2 compares the effect of different music on the information of EEG signals. Based on the results, in general, rock and relaxing music had the biggest and least effect on changing the information of EEG signals. In other words, by moving toward rock music, music’s effect on changing the information of EEG signals increases.
Effect sizes for the entropy of EEG signals
The entropy of EEG signals in different conditions.
The values of the Shannon entropy of EMG signals are shown in Fig. 5. Based on this figure, EMG signals’ entropy has the biggest value during rest. On the other hand, when we play relaxing, pop, and rock music to subjects, the EMG signals’ entropy decreases. In other words, the information of EMG signals reduces by playing relaxing, pop, and rock music to subjects. The ANOVA test’s results (
The results of pairwise comparisons of the entropy of EMG signals are presented in Table 3. Based on this result, there was not any significant change in the information of EMG signals between different conditions. Here we should note that in this research we look for the correlation between the variations of EEG and EMG signals, not the significance of their alterations in different conditions. The results also show that by moving toward rock music, the alterations of information of EMG signals become more significant.
Posthoc test results for the entropy of EMG signals
Comparisons of the effect of different music on the information of EMG signals are presented in Table 4. Based on the results, rock and relaxing music had the biggest and least effect on changing the information of EMG signals. In other words, by moving towards rock music, the music’s effect on changing the information of EMG signals increases.
Effect sizes for the entropy of EMG signals
The entropy of EMG signals in different conditions.
Comparing Fig. 5, Tables 3 and 4 with Fig. 4 and Tables 1 and 2 indicate similar trends of variations for the entropy of EEG and EMG signals. Furthermore, the correlation coefficient of 0.9980 indicates a strong coupling between the alterations of the information of EEG and EMG signals.
In general, we can state that the analysis of the alterations of the information in EEG and EMG signals in different conditions (rest and stimulations) showed that the brain and facial muscle reactions are strongly correlated.
This paper investigated the correlation between the activities of the brain and facial muscles in rest and auditory stimulation. We employed the concept of information and calculated the Shannon entropy of EEG and facial EMG signals in rest and stimulation using different pieces of music. The analysis of EEG signals showed that by moving toward the rock music, the information content of EEG signals decreases. The statistical analysis result also showed that the information of EEG signals changes greater by moving toward the rock music. Besides, the results of the analysis of EMG signals showed similar results. In other words, by moving toward the rock music, the information content of EMG signals decreased. Similar to the result of the analysis of EEG signals, the statistical analysis showed that the information of EMG signals changes greater by moving toward the rock music. Therefore, based on this result, we conclude that brain and facial muscle activities are correlated in different conditions. The investigation in this study is one step forward compared to the studies that analyzed the brain’s reaction in different muscle stimulations [50, 51] without considering the muscle’s reaction and trying to link it to the brain reaction.
As mentioned before, the observed correlation in this research is due to the interlink of information between the brain and facial muscle in different conditions. The transferred information from the brain increases the information content of facial muscles. Therefore, if a stimulus changes the information content of EEG signals, it will have a similar effect on the information of EMG signals.
The conducted investigation in this research is not limited to auditory stimulation. We can run similar analyses in the case of other types of stimuli (e.g., visual stimuli [52], olfactory stimuli [53]) to decode the connection between facial muscles and the brain in different conditions. Besides, we can expand our analysis to decode the correlation between the activities of other organs by analysis of their physiological signals. For instance, we can investigate the link between heart and brain activities in different conditions by analyzing the information content of the R-R time series and EEG signals. We can also investigate the connection of more than two organs. For instance, we can analyze the connection between the brain, eyes, and facial muscles while watching different images. Mathematical (e.g., using fractional diffusion equations [54]) or computational [55, 56, 57, 58, 59] modeling of the connection between the brain and facial muscles is another potential future work. This model shall potentially enable us to forecast the facial muscle’s reaction based on the brain’s reaction to external stimuli. Overall, all these analyses have great importance in physiological science.
Footnotes
Acknowledgments
This work was supported in part by the project (2021/2205) Grant Agency of Excellence, Faculty of Informatics and Management, University of Hradec Kralove, Czech Republic.
Conflict of interest
None to report.