
Abstract
BACKGROUND:
Human facial muscles react differently to different visual stimuli. It is known that the human brain controls and regulates the activity of the muscles.
OBJECTIVE:
In this research, for the first time, we investigate how facial muscle reaction is related to the reaction of the human brain.
METHODS:
Since both electromyography (EMG) and electroencephalography (EEG) signals, as the features of muscle and brain activities, contain information, we benefited from the information theory and computed the Shannon entropy of EMG and EEG signals when subjects were exposed to different static visual stimuli with different Shannon entropies (information content).
RESULTS:
Based on the obtained results, the variations of the information content of the EMG signal are related to the variations of the information content of the EEG signal and the visual stimuli. Statistical analysis also supported the results indicating that the visual stimuli with greater information content have a greater effect on the variation of the information content of both EEG and EMG signals.
CONCLUSION:
This investigation can be further continued to analyze the relationship between facial muscle and brain reactions in case of other types of stimuli.
Keywords
Introduction
Facial muscles shape the human face and respond to external stimuli. For instance, when an individual sees something scary, the facial muscles react and the face changes. Therefore, due to the importance of facial muscles, in this research we analyzed their activities.
For several years, many researchers have focused on the analysis of the activity of facial muscles. As the electromyography (EMG) signal is the main indicator of muscle activities, most of the researchers analyzed this signal in different conditions. These studies investigated the variations of facial muscle activity during ageing [1, 2], evaluated EMG signals during decompression operation for patients with hemifacial spasm [3, 4], and analyzed the effect of visual [5], emotional [6, 7] and mental [8] stimuli on variations of EMG signals. The studies also recognized intensive valence and arousal affective by analysis of EMG signals [9], estimated intraoperative stimulation threshold of the facial nerve for patients who underwent microvascular decompression [10], and judged smile authenticity by analyzing EMG signals [11].
The human brain controls all activities of the body through the nervous system. Due to the controlling role of the brain in organizing human activities, there should be relations between brain activity and other organs’ activities. For instance, when we smell a pleasant odour, our brain reacts to the stimulus and issues a command to our facial muscles. Accordingly, our facial muscles react and our face changes.
One of the important categories of the work is the decoding of the relationship between the activities of different organs and brain activity. Despite all reported investigations in the literature that evaluated the reaction of facial muscles or the brain in different conditions, there is no study that analyzed the relationship between the activities of facial muscles and the brain. As a result, in this research, we investigated how the activity of facial muscles is linked to the activity of the brain.
When an external stimulus is received, the information about the stimulus is sent to the brain. Accordingly, the brain processes the stimulus, and, based on the type and intensity, it sends impulses to different parts of the body. These impulses contain information about the stimulus. In other words, the brain transfers the information about the stimulus to different parts of the body, which leads to related reactions. Therefore, there should be a relationship between the information contents of the brain and different organs. Considering this, in this research we decoded the relationship between facial muscle and brain activities by analyzing the information contents of EMG (as the feature of muscle activity) and electroencephalography (EEG; as the feature of brain activity) signals. To conceptualize information to the analysis, we applied Shannon entropy to investigate the information content of a message.
Besides several conducted studies that investigated the variations of different physiological signals using different analysis techniques such as fractal theory [12, 13, 14, 15, 16, 17, 18, 19, 20, 21, 22, 23, 24, 25, 26, 27, 28, 29, 30, 31, 32, 33, 34, 35, 36, 37, 38, 39, 40, 41], many researchers employed different types of entropies for their investigations. The studies that investigated heart rate [42], magnetoencephalography (MEG) signals [43], galvanic skin response (GSR) signals [44], and eye movement [45] using different types of entropies are worth mentioning.
Similarly, several researchers employed different types of entropies to investigate the variations of the EMG signal in different conditions. The reported studies include multi-scale entropy-based analysis of the effect of ageing on leg muscles during walking on a treadmill [46], detection of neuromuscular disease by neural networks and fuzzy entropy analysis of EMG signals [47], analysis of multi-scale entropy of EMG signals while walking in children with cerebral palsy [48], and detection of muscle onset by entropy-based analysis of the EMG signal [49, 50]. Moreover, other studies focused on classifying neuromuscular disorders by multi-scale entropy analysis of EMG signals [51], calculated scale symbolic transfer entropy (VS-STE) of EMG signals for patients with stroke [52], and decoded the relationship between information contents of EMG signals and walking paths [53].
By referring to the previous studies, we can also address many studies that focused on the analysis of EEG signals using different types of entropies. The studies that employed multiscale entropy [54], Shannon entropy [55], approximate entropy [56], fuzzy entropy [57], sample entropy [58], and permutation entropy [59] for analysis of EEG signals are worth mentioning.
Therefore, in this research, we benefit from the information theory to relate the activities of facial muscle and brain by analyzing EMG and EEG signals.
The paper is structured as follows. First, the method of analysis is presented that is based on Shannon entropy. Second, the details about data collection and analysis are provided. Third, the obtained results from the analysis are provided. Lastly, we discuss the results and draw conclusions for future work.
Methods
In this research, we aimed to analyze the relationship between facial muscles and brain activities. For this purpose, we benefited from the information theory and calculated the Shannon entropy of EMG (as the feature of muscle activity) and EEG (as the feature of brain activity) signals in different conditions.
Shannon entropy indicates the information content of a message, where EEG and EMG signals are considered as a message in this research. The greater the value of the Shannon entropy indicates the greater information content in the message. In general, Shannon entropy is defined as [45]:
where
For the experiment, we chose four images as the static visual stimuli, which are shown in Fig. 1. These images were selected based on their Shannon entropies that are listed in Table 1. By looking at this table, it is clear that transitioning from the first to the second, the third and the fourth stimulus (image), the information content of images increases. The selection of different images with different information contents enable us to investigate the relationship between the information content of EMG and EEG signals in different levels of brain activity. It should be noted that the Shannon entropy of these images was calculated by applying a written code in MATLAB that uses the “wentropy” command.
Visual stimuli images used in the experiment [60].
Shannon entropy of different visual stimuli
We stimulated subjects to use different images in different steps of the experiment, and, accordingly, analyzed how the Shannon entropy of the EMG signals changes with the Shannon entropy of EEG signals. The obtained results for the Shannon entropy of EMG and EEG signals are discussed using the information concept.
The Internal Review Board of Monash University approved the study (approval number 18626), and all steps of the experiment were conducted based on the approved guidelines. The experiments were conducted on fourteen healthy students (18–22 years old) at Monash University, Malaysia. Each subject was interviewed prior to the experiment to ensure that the subject was healthy and did not have any history record or current neurological disorder. Furthermore, subjects were not allowed to drink beverages that contained alcohol or caffeine within 48 hours prior to the experiments. The experiments were performed in a room isolated from any external stimuli in order to reduce the effect of environmental noises on the data collection.
We explained the study to the subjects prior to the experiment and collected informed consent forms. During the experiment, subjects comfortably sat on a chair with 60 cm distance to a computer monitor while looking at different visual stimuli and without doing any other job. We used the Emotiv Epoc
Setup of the experiment.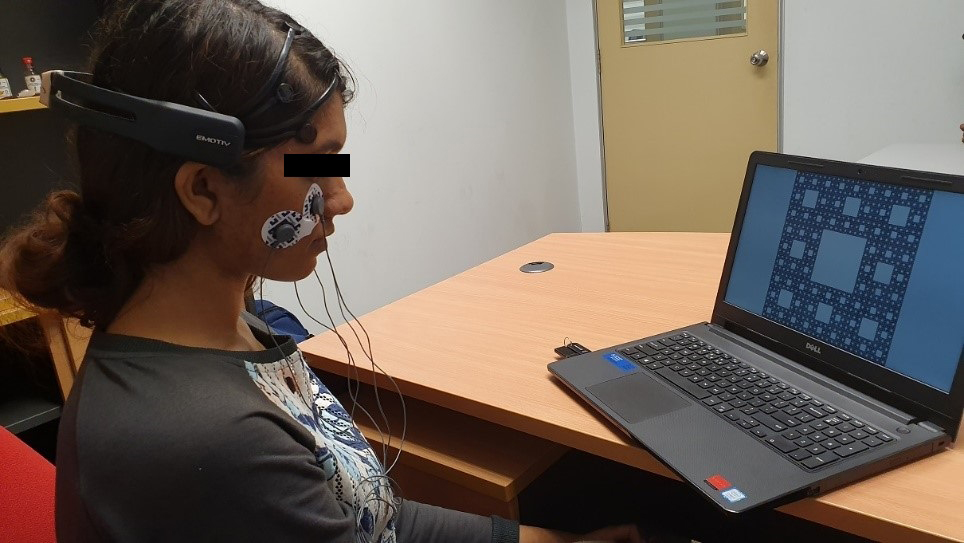
The experiment was started by recording EEG and EMG signals from subjects in the rest condition (without presenting any stimulus) for thirty seconds. During this period, participants could look anywhere on the white computer screen. After that, the first image was shown for 30 seconds. During this period, subjects explored the image by moving their eyes inside and on the border of the image. After the stimulus presentation, subjects rested for thirty seconds without receiving any stimulus (the rest period) and could close their eyes or look anywhere on the computer screen. This procedure continued to examine the effect of the second, third, and fourth stimulus (image) on the subjects. Each stimulus lasted for thirty seconds, with an inter-stimulus duration of thirty seconds. It should be noted that data collection was repeated for each subject in the second session to consider the repeatability of results.
Since the recorded EMG and EEG signals were noisy, the pre-processing was done by removing noises. We filtered EEG signals by applying the Butterworth bandpass filter in the range of 1 Hz to 40 Hz. Similarly, we applied the Butterworth filter for bandpass filtering of EMG signals in the range of 25 Hz to 180 Hz. The filtered EEG and EMG signals were processed for calculation of the Shannon entropy using a written code in MATLAB.
For the statistical analysis, mean values of the Shannon entropy for EEG and EMG signals were compared between different stimulation conditions, using one-way repeated measures ANOVA with a significance level of 95%. We also investigated the effect of different stimuli on variations of the Shannon entropies of EEG and EMG signals using effect size analysis.
The obtained results are provided in this section. It should be noted that out of 112 sets of data recorded from fourteen subjects in case of different stimuli, the Shannon entropy of seven data did not fall within the proper range. Therefore, they were removed from further investigation.
Figure 3a and b show the absolute mean values of the Shannon entropy of EEG signals in case of different stimuli and the Shannon entropy of stimuli, respectively.
As can be seen in Fig. 3a, the EEG signal has the lowest Shannon entropy for the first stimulus. As the second, third and fourth images are presented to subjects, the Shannon entropy of the EEG signal increases. Since Shannon entropy indicates the information content of the signal, it can be said that by increasing the information content of images (Fig. 3b), the information content of the EEG signal increases. In other words, the variations of the information content of stimuli are reflected on the variations of the information content of EEG signals.
The result of the ANOVA test (
The results of the effect size analysis that are listed in Table 2 indicate that the fourth image with the greatest information content had the greatest influence on variations of the information content of EEG signals.
Comparison of the effect sizes (r) of the Shannon entropy of EEG signals in different conditions
Comparison of the effect sizes (r) of the Shannon entropy of EEG signals in different conditions
Absolute value of the Shannon entropy of EEG signals in case of different visual stimuli (a), and the Shannon entropy of different visual stimuli (b).
Figure 4 shows the absolute mean values of the Shannon entropy of EMG signals in case of different stimuli. In this figure, the EMG signal has the lowest Shannon entropy in case of the first stimulus. As the second, third and fourth image are presented to subjects, the Shannon entropy of the EMG signal increases. Therefore, it can be said that by increasing the information content of images (Fig. 3b), the information content of EMG signals increases as well. In other words, the variations of the information content of stimuli are reflected on the variations of the information content of the EMG signals.
The result of the ANOVA test (
The comparison of obtained values for the Shannon entropy of EEG and EMG signals shows that information content of EEG signal changes greater between conditions compared to the Shannon entropy of the EMG signal. Therefore, it can be said that the brain is more reactive compared to facial muscles.
Comparison of the effect sizes (r) of the Shannon entropy of EMG signals in different conditions
Absolute value of the Shannon entropies of EMG signals in case of different visual stimuli.
The results of the effect size analysis (Table 3) show that fourth image with the greatest information content had the greatest influence on variations of the information content of EMG signals. Therefore, based on the obtained results, it can be said that the variations of the information content of the EMG signals (Fig. 4) are coupled with the variations of information content of EEG signals (Fig. 3a) and visual stimuli. A greater variation in the information content of visual stimuli leads to a greater variation in the information content of EEG and EMG signals. Therefore, it can be concluded that facial muscle activity is linked to brain activity.
In this paper, for the first time, we investigated the relationship between facial muscles and brain activities for visual stimulation. For this purpose, we employed the Shannon entropy that indicates the information content of the signal in this research. Four images (visual stimuli) were shown to the subjects and we accordingly analyzed how the variations of the information content of EMG signals were related to the variations of the information content of EEG signals as well as to the information content of the visual stimuli.
Based on the results of the analysis, EEG signals have the lowest Shannon entropy in case of the first visual stimuli with the lowest information content. In other words, the EEG signals contain the lowest information when the subject looks at an image with the lowest information content. In addition, the Shannon entropy of EEG signals increases when we move from the first to the fourth visual stimulus with the increasing Shannon entropy. In other words, the variations of the information content of visual stimuli are reflected on the variations of the information content of EEG signals. We obtained similar results in case of variations of Shannon entropy of EMG signals. Shannon entropy of EMG signals increased when we presented the first to the fourth images with increasing Shannon entropy to the subjects. Therefore, it can be said that the variations in the information content of the EMG signal are related to the variations in the information content of EEG signals and visual stimuli. In other words, a greater change in the information content of visual stimuli causes a greater change in the information content of EEG and accordingly EMG signals. In fact, this result is obvious, since the brain controls facial muscles and a change in its activity leads to a change in the activity of the facial muscles. Furthermore, the obtained results showed a greater variation in the information content of the EEG signals in comparison to the variation of the information content of the EMG signals.
The statistical analysis supported the results of the analysis. The fourth image with the greatest information content had the greatest effect on the variations of the information content of EEG and EMG signals. Although the ANOVA test showed the insignificant effect of stimulation of variations of EEG and EMG signals, it could have a significant effect if we had presented images with greater information contents for a longer period of stimulation.
Therefore, we successfully showed the relationship between facial muscles and brain activities by analyzing the variations of information contents of EMG and EEG signals. This study is more advanced compared to former studies [46, 47, 48, 49, 50, 51, 52, 53] that only investigated the variations of EMG signals in different conditions without relating it to the variations of EEG signals.
In future work, we want to do a similar analysis in patients suffering from different muscle or brain disorders [61, 62, 63] to decode the relationship between their muscles and brain activities by information-based analysis of EMG and EEG signals. Finding the relationship between EEG and EMG signals could help physicians with rehabilitation purposes.
We also aim to work on modelling the relationship between EMG and EEG signals. The developed model will enable us to predict the variations of the EMG signals based on the variations of the EEG signals that were affected by external stimuli. For this purpose, we can employ different mathematical and computational models [64, 65, 66, 67, 68, 69, 70, 71]. Overall, these efforts help researchers to understand the relationship between brain and muscle activities, which has a great importance in rehabilitation science.
Footnotes
Conflict of interest
None to report.