
Abstract
BACKGROUND:
The incidence of liver tumors is among the top three in China. The treatments of benign and malignant tumors are different. Accurate diagnosis plays an important role in guiding the treatment of tumors.
OBJECTIVE:
The aim of this study is to solve the following: (1) blurred boundary between the liver tumor and other organs causes incorrect segmentation of liver tumor boundaries; (2) large difference in tumor size and the diversity in texture and grayscale are major challenges in liver tumor classification tasks.
METHODS:
Firstly, the liver tumor is segmented from the original CT images by a tumor segmentation network, UNet++ with fusion loss and atrous spatial pyramid pooling (FLAS-UNet++). The proposed segmentation method can solve the problem of tumor edge segmentation error by learning the tumor edge information. Secondly they are adaptively cropped according to the tumor volume to reduce the over-fitting and over-sensitivity of the deep network. Thirdly an improved Dense Block is designed to pay more attention to the changes in grayscale and texture between benign and malignant tumors. Finally, the features extracted from the network combined with tumor volume, patient’s sex and age, are sent to a classifier for diagnosis.
RESULT:
Liver tumor segmentation results show that the dice, HD95 reached 71.9%, 12.1 mm, respectively. The classification results show that the accuracy, specificity, sensitivity and area under curve reached 82.4%, 79.8%, 84.4%, 87.5%, respectively. The segmentation and classification results are both better than other’s methods and mainstream networks.
CONCLUSIONS:
In order to solve existing problems of liver tumor CT image classification methods, our method realizes the accurate segmentation and classification of liver tumors in CT images and has important clinical application value.
Introduction
The lethality of liver tumors is among the top two in the world [1]. In China, the incidence of liver cancer is high, which seriously endangers the health of the people [2]. The treatments of malignant tumors and benign tumors are quite different. Benign tumors can be removed by surgery, while malignant tumors can be supplemented with comprehensive anti-tumor treatment programs such as local radiotherapy and chemotherapy or surgery according to the risk factors of recurrence. Classifying benign tumors and malignant tumors as early as possible is of great significance to the patient’s treatment plan. Computed Tomography (CT) technology has high time and spatial resolution, so it is regarded as an important method for the diagnosis and analysis of tumors [3].
With the rapid development of Computer Aided Diagnosis (CAD) in the field of medical images in recent years, it can be used as an effective method to improve accuracy and lighten the burden of doctors [4]. Deep learning is an important technology in CAD, it does not require manual feature extraction and makes the automatic medical image processing faster and more accurate. Song et al. proposed a U-Net with dense module, inception module and dilated convolution to segment liver tumor [5]. Li et al. proposed a novel hybrid densely connected U-Net. The model combines 2D and 3D spatial information [6]. Zhang et al. improved the combination mode of two-dimensional and three-dimensional networks, and proposed a lightweight hybrid convolution network, which uses 2D convolution to reduce complexity, and uses 3D convolution to explore spatial and temporal information in the same network [7]. Jin et al. proposed a 3D hybrid residual attention-aware segmentation method (RA-UNet), to segment tumors from the liver volume of interests [8]. Jiang et al. designed an Attention Hybrid Connection Network architecture which combines soft and hard attention mechanism and long and short skip connections, and got good results [9]. Yasaka et al. designed a multi-channel convolutional neural network to learn multi-phase information to extract features, and achieved classification accuracy of 84% [10]. Ben-Cohen et al. designed a hybrid Fully Convolutional Networks (FCN) network which accuracy is 7.4% higher than classification that only uses FCN [11]. Romero et al. proposed residual block migrating the InvecptionV3’s pre-training weights in ImageNet, and obtained an average accuracy of 96% and an F1 score of 92% [12, 13]. Chen et al. proposed to integrate the attention module into the neural network, enhancing the information to help improve the classification accuracy [14]. Pan et al. proposed a 3D convolutional neural network to learn the temporal and spatial characteristics of tumors [15].
Although the above methods made progress by using deep learning, there are still many problems that need to be solved. 1) The original CT image has a large number of other tissues besides the tumor. In order to facilitate classification, these articles firstly execute tumor segmentation, but boundary between the liver and other organs is blurred, it cause incorrect segmentation of liver tumor boundaries. 2) In CT images, most pixels belong to the background, and the proportion of pixels that contains useful tumor information is small, which may cause overfitting. 3) The size of benign and malignant tumors is quite different, and therefore the neural network will pay less attention to tumor volume. The volume is regarded as the main basis for judging benign and malignant tumors, thus network ignores the texture and grayscales. 4) Compared with benign tumors, the texture and grayscale of malignant liver tumors usually shows much more inhomogeneous and irregular. The previous methods could not adaptively focus on such differences.
To solve these problems, this paper proposes a new classification framework to classify CT images of benign and malignant liver tumors. Our method uses the deep convolutional neural network as the main part, and makes improvements in four aspects: tumor segmentation, image input, network structure and feature fusion. 1) In order to solve the problem of inaccurate tumor edge segmentation, we propose a segmentation network including atrous spatial pyramid pooling (ASPP) to enhance the learning of edge features, and use the fusion loss function to focus on the edge. 2) In light of the problems that image is highly unbalanced and the difference in tumors’ volume, an adaptive cropping is proposed to make full use of the useful information in the image. Such cropping method can prevent network’s over-fitting, and it guides the network pay less attention to tumor size. 3) Since large receptive field has a strong ability to extract global information, so it can learn the difference of change in grayscale and texture between benign and malignant tumors better. Hence, we add a branch with large receptive field to the 3D DenseNet Block substructure. 4) The adaptive cropping will lose the information of the tumor volume. Also there are differences in the demographic information between benign tumor patients and malignant tumor patients, so the patient’s tumor volume together with gender and age are added to the classifier. Experimental results show that our method can fully extract and excavate tumor information and its performance is better than other methods.
Methods
The overall framework is shown in Fig. 1. It consists of four parts: liver tumor segmentation, adaptively cropping, feature extraction and classification.
The overall framework.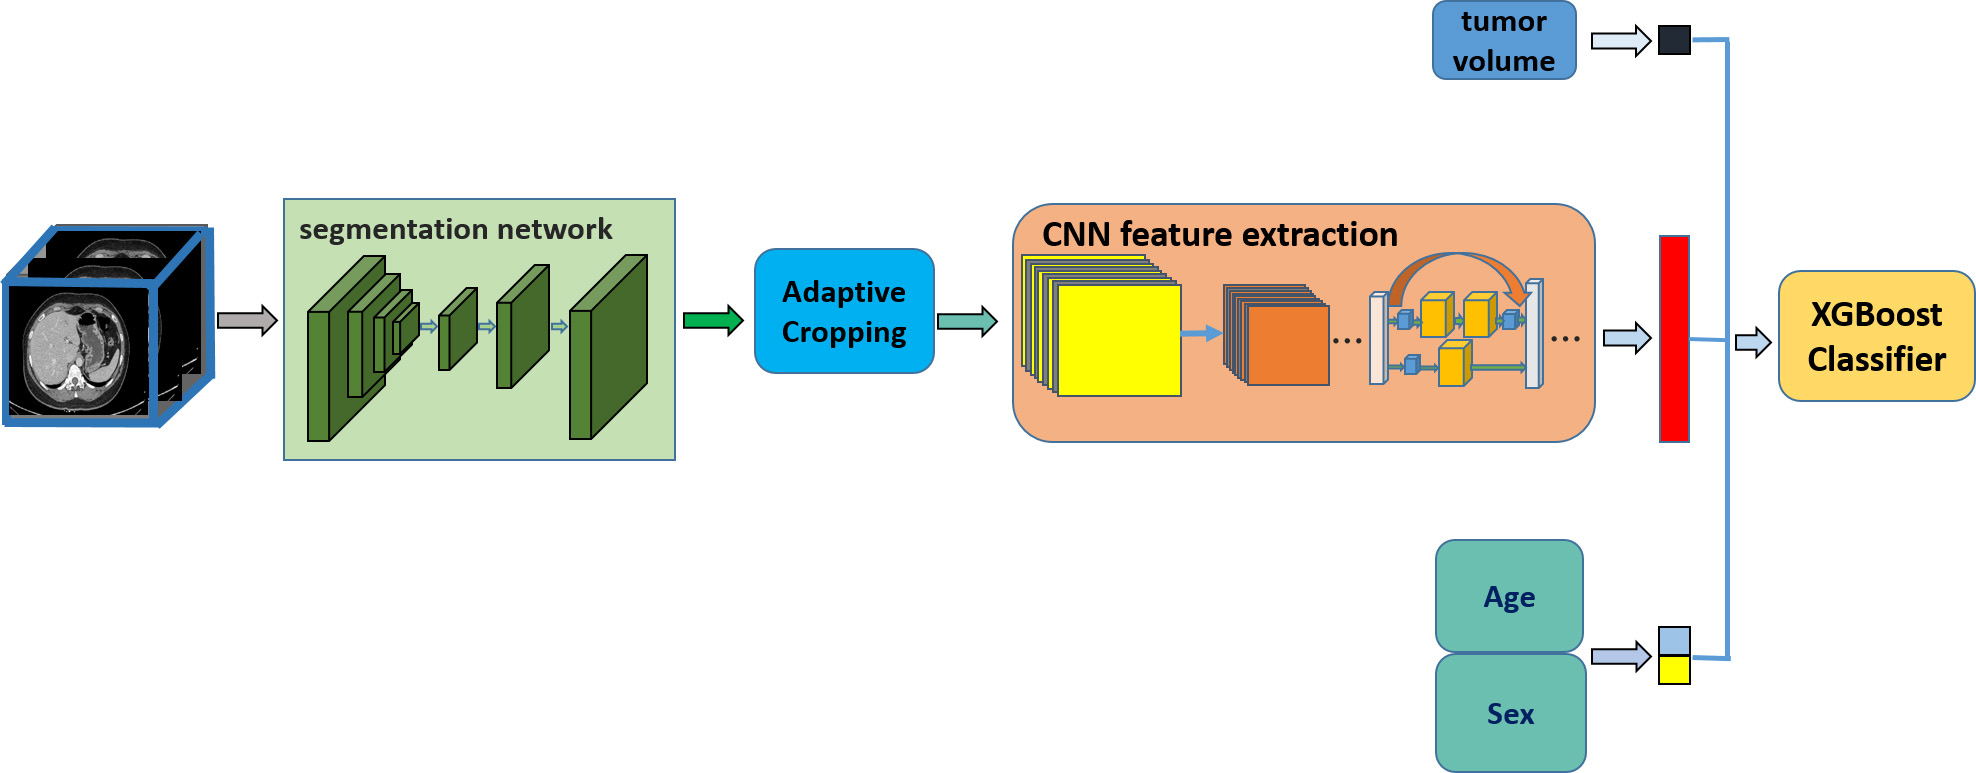
In order to capture the tumor area, we perform liver tumor segmentation firstly. The difficulties in accurately segmenting liver tumor areas from CT images, such as blurred boundary between the liver and other organs, cause incorrect segmentation of liver tumor boundaries. To solve this problem, we design a liver tumor segmentation network: UNet++ with focal loss and ASPP (FLAS-UNet++), it is based on fusion loss function and ASPP. The deep learning model is used to optimize the segmentation of liver tumor edges by combining ASPP. The multi-scale atrous convolution enlarges the receptive field in the segmentation network, and improves the feature learning ability of tumor edge, so as to improve the segmentation accuracy of liver tumor. The fusion loss function is used to constrain the tumor boundary and further improve the precision of tumor boundary segmentation.
Segmentation method
The proposed segmentation network is shown in Fig. 2. Since original CT images are 3D medical images, in order to make full use of the spatial information of the images, we use 3D convolutional neural network.
The segmentation network structure.
The algorithm is based on UNet++ network. Due to the fuzzy boundary between the liver tumor and the surrounding tissue, the convolution’s receptive field in U-Net++ is limited, there is a large error in the liver tumor edge extracted by the network compared with the gold standard. Research shows that we can better capture pixel-level details and spatial information by enhancing the receptive field of segmentation network’s feature maps and making full use of spatial structure information, so as to improve the network’s segmentation performance of tumor edge.
ASPP is based on the idea of dilated convolution and introduces more convolutions with different dilation rates to segment the image at different scales. The use of multi-scale atrous convolution expands the receptive field in the segmentation network, which helps to get more tumor’s edge semantic information. As shown in Fig. 3, ASPP layer is added in the fourth to the fifth downsampling blocks. A higher dilation rate is introduced according to the depth and density of the feature map, in which the fourth layer ASPP has dilation rates 6 and 12, and the fifth layer covers dilation rates of 6, 12, and 18.
ASPP module: a) ASPP in the fourth layer. b) ASPP in the fifth layer.
We use a combination of two loss functions as our fusion loss. Dice loss is a generally loss in segmentation network. Equation (1) is used to calculate the dice loss.
Where
The combination of these two loss functions is used to form a fusion loss function. Equation (3) is used to calculate the fusion loss function. where
The improved segmentation network is referred to as FLAS-UNet++ (UNet++ with fusion loss and ASPP).
Some patients’ tumors are too small, the ROI area contains only tens of pixels, and the features will be lost after several times of downsampling, leading to serious over-fitting. At the same time, there are large differences in the volume of benign tumors and malignant tumors. Benign tumors are generally small, and malignant tumors are large. If CT images are directly input into the convolutional neural network, the network will easily regard the tumor size as the main basis for judging two kinds of tumors, and ignores some important features such as grayscale or texture. In order to solve the above two problems, this paper designs an end-to-end adaptive cropping to ensure that our model is generally adapted to all liver tumor CT image data.
As an example, Fig. 4 shows the cropping effect of tumor images. It can be seen that there is a lot of redundant information in the original image. Adaptive cropping crops the ROI area that contains tumor.
Images before and after adaptive cropping.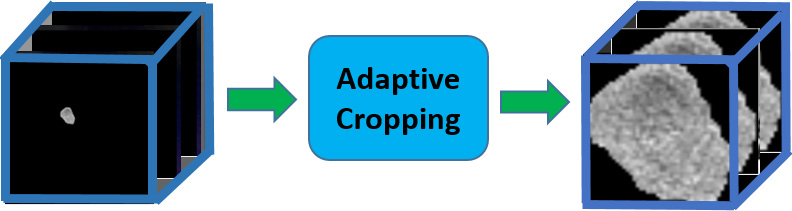
The cropping of 2D images is to find the circumscribed rectangle of the tumor, while each patient in our dataset is composed of the multi-layer CT image, they can be treated as 3D images. Therefore this paper adopts the 3D cropping method to obtain the largest circumscribed cube of the patient’s tumor. The adaptive cropping can automatically capture the tumor ROI area in each CT image, and crops them from the original image. After adaptive cropping, the amount of information in the image has been greatly improved, and the difference in tumor volume size has also been reduced, it’s convenient for the next step that using convolutional neural network to learn key tumor’s features except the volume.
Baseline network
When we use CT medical images to analyze a problem, we expect to capture spatial information, and 3D convolutional neural network can extract the features of the medical images.
DenseNet is a new CNN structure proposed by Huang et al. [19], which can alleviate the problem caused by the increase in network’s depth. The core is Dense Block, in which the structure of each Dense Block is different. In this paper, Densenet121 is used as the baseline network, whose Dense Block has a different number of sub-structures. There are six sub-structures in the first Dense Block, as shown in Fig. 5. It contains two branches, one branch’s result directly connects up one layer, and the other branch’s result is composed of two convolution kernels, then splicing the two branches at the end of the substructure.
Substructure of dense block.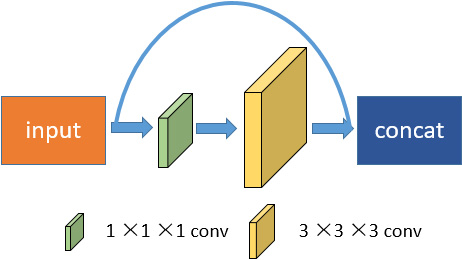
Observation shows that the texture and grayscale of malignant liver tumors usually shows much more inhomogeneous and irregular, as shown in Fig. 6. DenseNet cannot adaptively pay attention to the difference in texture and grayscale between benign and malignant tumors, so the network needs to be improved. In order to make the network learn features better, we make the following improvements in Dense Block.
Tumor image: a) malignant tumor. b) Benign tumor.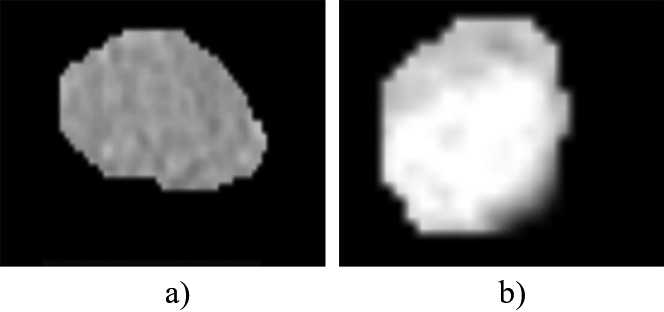
Due to the diversity in texture and grayscale between benign and malignant tumors, large receptive fields can learn these differences information better. The large convolution kernel has large receptive field, which has a strong ability to extract global information. However, large convolution kernel will increase the amount of calculation and raise requirements for hardware. In order to obtain a larger receptive field, several small convolution kernels are stacked up, and then they achieve the same receptive field as the large convolution kernel. The method can also decrease the amount of parameters, thereby reducing computation. Multiple small convolution kernels are stacked up, accordingly, forming multiple non-linear activation layers, replacing the single non-linear activation layer of single large convolution kernel, and the fitting capacity of the model can be improved. Figure 7 shows the improved Dense Block substructure.
Improved dense block substructure.
We add a new branch that is consisted by two 1
Tumor volume is one of the key features of benign and malignant tumor. However, tumor volume information will be lost after the adaptive cropping. Therefore, we should obtain the tumor volume in the original image. The calculation method is to calculate the number of voxel points in the CT picture of each patient.
From the clinical guide, the demographic information of benign and malignant tumors patients is different, sex and age are also important factors that cause tumor. In order to classify more accurately, these two features are added to the classifier.
One thousand and twenty-four features are extracted from the IDenseNet, and these features were spliced with the three features: tumor volume, patient’s sex and age, then they are sent to the XGBoost classifier for achieving classification of benign and malignant liver tumors.
Results
Dataset
In tumor segmentation experiments, we evaluated our method on a clinical CT image dataset containing 199 patient CT scans. The images were collected by Shanghai Renji Hospital. The image size was 512
Implementation
During the segmentation training, the batch size and learning ratio were set to 4 and 0.001, respectively. We trained the network for 400 epochs approximately. In the classification training, the batch size and learning ratio were set to 16 and 0.001, respectively, we trained the network for 400 epochs approximately. In the above experiment, we both minimized the loss function using Adam optimizer.
Our method was implemented using the popular open-source framework PyTorch. All experiments were performed under a Linux OS with GPU Tesla V100 SXM2 32G.
Evaluation indicators
To evaluate the performance of our segmentation model, we employed three types of indicators: Dice coefficient, 95% Hausdorff Distance (HD95). Among them, the dice coefficient is used to evaluate overlap degree of the segmented regions, the larger the overlap degree, the better the segmentation effect. HD95 is an indicator that can evaluate the distance of the segmentation edge.
In tumor classification, we employed five types of indicators: accuracy, specificity, sensitivity and AUC. Accuracy (ACC) is the proportion of correctly classified sample, and specificity (SPE) is correctly classified negative samples divide by negative samples. Sensitivity (SEN) is the correctly classified positive samples divide by positive samples, the AUC can provide a comprehensive evaluation of the performance of the model, the higher scores indicating a better model.
Discussion
Liver tumor segmentation
1) Ablation experiment
To demonstrate the effectiveness of the proposed method, we conducted some ablation experiments. Table 1 presents the results.
Results of ablation experiments
Results of ablation experiments
It can be seen that compared with the baseline, UNet++ with ASPP yielded a result of 71.3% in dice, which brings 1.4% improvements. Moreover, the UNet++ with fusion loss function also outperformed the baseline by 1.7 mm in HD95. Finally, we combined ASPP and fusion loss function into UNet++. Compared with the backbone, the FLAS-UNet++ outperforms the baseline by 2% in dice and 2.5 mm in HD95.
2) Compare with mainstream network
In order to verify the classification effect of our method, classic deep learning network is used to compared, the segmentation results were shown in Table 2.
Comparison with mainstream segmentation network
Comparison of segmentation methods. Each row represents related images of different patients, the meaning of each column: a) The original CT image. b) The ground truth. c) The results of 3D UNet. d) The results of 3D UNet++. e) The results of our method.
It can be seen from the Table 2 that the performance of our method is better than other networks. The average dice and HD95 achieve 71.9%, and 12.1 mm. Specifically, our method improves the dice rate by 3.2% and significantly reduces the HD95 index by 3.4 mm. The reason for our method excellent performance is that ASPP module is added to our method, multi-scale receptive fields enhance the learning of edge features, and the fusion loss function can focus on the edge.
In order to qualitatively evaluate the segmentation results, this paper selects representative cases for demonstration, as shown in Fig. 8.
It can be seen that compared with other columns, e)’s tumor edge is closer to the gold standard, our algorithm can effectively detect the edges, so it can be proved that the proposed network’s ASPP module and fusion loss function can effectively optimize the segmentation results and obtain a more accurate segmentation image.
3) Comparison with recently proposed methods
We compared with recently methods by using the same dataset and evaluation metrics. Table 3 shows the experimental results. Alalwan et al. [16] achieved the dice results with a value of 70.5%, while our method obtains more than 1.4% improvement in dice. We achieved 12.1 mm in HD95, which is much lower than Mourya et al. [17] and Li et al. [6]. The significant improvement indicates the effectiveness of the proposed method. The significant improvement indicates the effectiveness of the proposed method. The reason is that boundary between the liver tumor and other organs is blurred, the previous method neglected the segmentation accuracy of tumor edge. It causes that the segmentation effect is not very ideal. Our method improved the network structure, which adds ASPP muddle that has multi-scale receptive fields. It makes full use of spatial structure information, so as to improve the network’s segmentation performance of tumor edge. Our fusion loss contains focal loss and can focus on edge. Hence, our model segmentation effect is better than others.
Comparison with other liver tumor segmentation algorithms
1) Ablation experiment
To demonstrate the effectiveness of the proposed method, we conducted some ablation experiments.
Results of ablation experiments
Results of ablation experiments
Table 4 presents the results. It shows that compared to the DenseNet121, IDenseNet has increased its’ accuracy, sensitivity, specificity, and AUC by 3%, 3.6%, 2.6%, and 3.4%, respectively. Compared to the DenseNet121, the mean values of accuracy, sensitivity, specificity and AUC were further increased by 2.5%, 3.6%, 1.7% and 2.8% by adding other three features, including volume, age and sex. The key to IDenseNet’s effectiveness is that it can adaptively pay attention to the differences in the texture and grayscale with benign and malignant tumors, and strengthen the network’s ability that extracts tumor features. In addition, tumor volume is also a key feature, and there are certain differences in sex and age between benign and malignant patients.
2) Compare with mainstream network
In order to verify the classification effect of our method, classic deep learning network are used to compared, Such as ResNet [18], DenseNet121 [19] and SENet [20]. The experimental results are shown in Table 5.
Comparison with mainstream classification network
It can be seen from Table 3 that the performance of DenseNet121 is better than other networks. The average accuracy can achieve 77.9%, and the average sensitivity can achieve 80.0%. The reason for DenseNet121’s excellent performance is that its structure can strengthen features’ transfer and make full use of features, so we select DenseNet121 as baseline.
3) Comparison with recently proposed methods
Comparison with other liver tumor classification algorithms
Table 6 shows the experimental results. Pan et al. [15] achieved the best ACC results with a value of 78.4%, while our method obtains more than 4% improvement in ACC, from 78.4% to 82.4%. We achieved 79.8% in SPE and 84.4% in SEN, which are far higher than Romero et al. [12] and Trivizakis et al. [20]. Compared with Christ et al. [22], our method is 9.2% higher than them in AUC. The significant improvement on ACC and AUC indicates the effectiveness of the proposed method. The reason is that the convolution kernel of the previous method is too single so that they cannot adaptively pay attention to the difference of the grayscale and texture between benign and malignant tumors. Our method improves the network structure, which adds a field branch that has large receptive field, large receptive fields can learn the difference information better, thereby improving the network’s ability to distinguish benign and malignant tumors, and achieving better results in specificity and sensitivity indicators. Secondly, this article adds other important features such as tumor volume and patient clinical information, which makes the classified information more complete, so the classification results are more accurate.
In order to solve existing problems of liver tumor CT image classification methods, this paper proposes a new method. The method makes improvements in four aspects: 1) ASPP module enhance the learning of tumor edge, and the fusion loss function can focus on tumor edge. 2) Adaptive cropping significantly improves the amount of image information, which can eliminate over-fitting, and enable the network to learn tumor’s features except volume. 3) Texture and grayscale have diversity between benign and malignant tumors, IDenseNet can learn the difference better and it has strong feature extraction ability. 4) After adaptive cropping, the patient’s tumor volume information will be lost, at the same time, the demographic information of benign and malignant tumors patients is different, sex and age are also important factors that cause tumor, so we add these features in the process of classification. Experiments show the effectiveness of our method, which is superior to other methods in all indicators. Our method has a strong guiding significance for the clinical classification of benign and malignant liver tumors.
Footnotes
Conflict of interest
None to report.