
Abstract
BACKGROUND:
Understanding complex systems is made easier with the tools provided by the theory of nonlinear dynamic systems. It provides novel ideas, algorithms, and techniques for signal processing, analysis, and classification. Presently, these ideas are being applied to the investigation of how physiological signals evolve.
OBJECTIVE:
The study applies nonlinear dynamics theory to electroencephalogram (EEG) signals to better comprehend the range of alcoholic mental states. One of the main contributions of this paper is an algorithm for automatically distinguishing between sober and drunken EEG signals based on their salient features.
METHODS:
The study utilized various entropy-based features, including ApEn, SampEn, Shannon and Renyi entropies, PE, TS, FE, WE, and KSE, to extract information from EEG signals. To identify the most relevant features, the study employed ranking methods like
RESULTS:
Classification accuracy of 95.89%, the sensitivity of 94.43%, and specificity of 96.67% are achieved by the SVM classifier with radial basis function (RBF) for polynomial Kernel using the Bhattacharyya ranking method.
CONCLUSION:
From the result, it is clear that the model serves as a cost-effective and accurate decision-support tool for doctors in diagnosing alcoholism and for rehabilitation centres to monitor the effectiveness of interventions aimed at mitigating or reversing brain damage caused by alcoholism.
Introduction
Epilepsy, depression, and alcoholism are just a few of the lifestyle diseases that harm human cognitive abilities, and they all have their roots in the way that people live their lives. The electroencephalogram (EEG) is a tool commonly employed in the study of cortical neuronal dynamics. The methods of EEG data analysis have profoundly evolved during the last two decades [1].
Nonlinear dynamics have been used in neurophysiology to understand complex brain activity from EEG signals. Recently, many nonlinear methods have been proposed and found to be more effective to study the nonlinear behaviour of the EEG signals as compared to the linear methods [2].
Nonlinear dynamics, a hallmark of the complex real-world phenomena that we study, serves as an important mathematical subject that has attracted significant attention from researchers in many different disciplines (including physics, chemistry, economics, electronics, and biomedical engineering) [3].
Electrocardiogram (ECG), electromyogram (EMG), electrooculogram (EOG), magneto-encephalogram (MEG), and electroencephalogram (EEG) data have all been used in biomedical applications using nonlinear dynamic methods with great success in recent years [4]. It is widely accepted that our brain is a nonlinear dynamical system and its generated EEG signals are generally chaotic [5]. Since its amplitude varies with time in a seemingly haphazard fashion, we can infer that [6]. The fluid-attenuated inversion recovery (FLAIR) imaging is used to clarify the relationship between the temperature of deceased persons and CSF T 1, and to optimize the postmortem brain FLAIR imaging method using synthetic MRI. Synthetic MRI enables the quantification of the CSF T 1 resulting from postmortem temperature decreases and the calculation of the optimal TI [7].
Linear analysis of EEG signals includes time domain methods, frequency analysis and parametric modelling (e.g., autoregressive models). However, while linear methods yield promising results, they overlook the nonlinear EEG dynamics that underpin neural activity in the brain and thus provide only a partial picture. It is generally believed that nonlinear and non-stationary EEG signals are produced by the underlying subsystems of the nervous system [8]. A chaotic nervous system is reflected in EEG signals even in healthy subjects. As a result, when nonlinear dynamics techniques are applied to EEG signals, new information is revealed that cannot be quantified using traditional linear methods [9, 10]. We can put a number on the dynamic nature of the human brain by using the masked measures of stability and complexity.
The complex behaviour and hidden dynamic properties are the trademarks of EEG signals [11, 12]. The theory of nonlinear dynamics has an advantage over linear methods in identifying the innate nature of EEG signals. In the present scenario, the theory of nonlinear dynamics has been used to analyze physiological signals namely electrocardiogram (ECG), EEG and respiratory signals to name a few [13, 14, 15]. Early detection of these physiological signals will help the patient in taking timely treatment and save a life.
Alcoholism is the uncontrolled use of alcohol and despite knowing the harmful consequences; the subject has difficulty refraining from it [16]. In a clinical or primary health care scenario, alcohol use disorder often goes unrecognized. To identify the drinking of alcohol in people, one method is to give questionnaires and try to provide a solution to the problem. The problem with some of the patients is that due to fear or shame, the correct information is not provided. To overcome this, a noninvasive method using EEG signals can be used to diagnose alcoholism [17, 18].
Depression is a life-long disorder where recurrences of illness interfere with the normal functioning of the subject. One of the most prevalent mental disorders, it affects about 8%–14% of adult U.S. residents each year. Approximately 70% more women than men suffer from depressive disorders [19]. Mood disorders come in a wide range of names and presentations, including major depression, persistent depression, psychotic depression, and bipolar disorder. They result from a trifecta of biological, social, and psychological factors. As a result, EEG signals are useful for gaining insight into how the brain works. EEG signals are highly irregular and nonlinear; these features can be used to analyze the signals with nonlinear dynamics and classify them with supervised learning algorithms of varying types [20].
Recent advances in computing power have allowed for the development of more refined and accurate models of physiological systems. The nonlinear dynamical theory is used to decipher the intricate dynamics of bioelectric signals [21]. To detect the important hidden underlying dynamics of the biological phenomenon, several features have been proposed and also employed. Many branches of engineering, biology, and medicine make use of dynamic methods [21].
To accomplish this, several nonlinear techniques are applied to EEG data in this work. Electroencephalographic (EEG) signals are a representation of the neural activity occurring within the human brain. Voltage-time plotting is what we’re doing here. Both the EEG signals and their underlying processes are dynamic and nonlinear [22]. These EEG readings serve as early warning systems for developing diseases. The signs could be available at sporadic times or continuously. The available data is massive, and it will take a significant amount of time to analyze the anomalies within it. Therefore, this exhaustive analysis and classification can benefit from the use of computer-based analysis. The dynamics of the electroencephalogram (EEG) will benefit from this. To decompose, extract, select, and classify normal and diseased EEG signals, MATLAB R2013b was used.
Previous research
The DWT breaks down the signal into its component frequencies. The EEG signals have been decomposed using this method. Analysis of EEG signals in both the time and frequency domains were used to characterize epilepsy in two recent papers [3, 4]. Normal and epileptic EEG signals were separated using entropy methods and DWT in a study by Ocak [8]. Another study [6] used discrete wavelet transform (DWT) to analyze EEG data and then fed the coefficients into a network of convolutional neurons. As stated by them, the accuracy was 94.5 per cent. Researchers [8] used an ANFIS-based adaptive fuzzy system to achieve an accuracy of over 90% in their study.
According to the WHO, 3.3 million deaths worldwide can be attributed to alcohol abuse every year. An estimated 16% of people aged 15 and up are regular heavy drinkers, according to the report [10]. Approximately 85,000 people in the United States lose their lives to alcohol-related causes annually. About 76.3 million people around the world are alcoholics. Deaths from all causes, including those caused by alcohol, have risen in recent years.
While at rest, with eyes closed or open, brain activity can be recorded using EEG. Delta, theta, alpha, beta, and gamma are just some of the wave patterns that make up these signals [11]. Substance abusers, according to the literature [16], have elevated theta power at rest across the board of scalp locations. The equilibrium and stability of the brain, and the central nervous system in particular, may be thrown off by heavy alcohol consumption (CNS). A beta rhythm is characterized by rapid, low-amplitude electrical activity across the entire scalp. When comparing alcoholics and non-alcoholics, alcoholics have a stronger beta signal. Those with a family history of alcoholism may have an increased beta power [20].
Screening, diagnosis, and therapeutic estimations for a variety of mental disorders are all made using EEG. Epilepsy, sleep stage, Alzheimer’s disease, autism spectrum disorder, and hyperactivity disorder can all be detected using nonlinear methods because of the changing nature of the EEG signal. This study applies the principles of nonlinear dynamics to the classification of both typical and abnormal EEG signals in alcoholics. Variations in EEG signal shapes, amplitudes, and durations are of particular interest [24].
Different supervised learning algorithms [27] can be used to analyze highly nonlinear and irregular EEG signals. The spectral asymmetry of the EEG is determined by determining the relative difference in power between the higher and lower frequency bands. Those with depression showed positive spectral asymmetry, while those without depression showed negative asymmetry; this finding informed the development of a depression diagnosis support system. To gauge the severity of depression, the authors analyzed the participants’ vocal prosody. Speech quantitative analyses, including the timing of words and pauses, can be used to gauge the severity of depression. Circadian modulation of slow wave activity in the EEG signals of subjects with the major depressive disorder was reported by this author [26]. Psychologists have studied how people with schizophrenia and depression’s EEGs differ from the norm. Fast Fourier transforms (FFT) were used to analyze these EEG signals, and the spectral power of the resulting signals was used for evaluation. Increased delta activity was reported in depressed EEGs, while decreased beta activity was reported in normal EEGs over the frontal lobes [27]. Using relative wavelet energy and signal entropy, we were able to distinguish between normal and depressed EEG signals.
Based on the research presented above, it appears that the brain significantly alters itself during the depression. The EEG signals can reveal these alterations.
A person’s genetic makeup and upbringing both play a role in the development of alcoholism as a mental health disorder. It causes problems with thinking and moving around, and it disrupts the brain’s neural network. An alcoholic’s lack of self-control makes him a danger to himself and others. This includes serious mishaps, issues at home and work, and disturbances at social events. Moderate alcohol consumption disrupts normal brain function. Heavy drinking is associated with poor academic performance in adolescents and may have long-lasting effects on the cognitive abilities of adults [27]. Long-term alcohol consumption has been linked to brain atrophy and alterations in grey and white matter [28].
When a person is at rest, either with their eyes closed or open, the EEG can record the electrical activity occurring in their brain. There are many different types of waves in the EEG signals, including delta, theta, alpha, beta, and gamma [29]. According to the literature [29], alcoholics typically exhibit elevated resting theta power across the board of scalp locations. Heavy alcohol use has been linked to disruptions in normal brain function and may have an especially negative effect on the central nervous system (CNS). Rapid and spread out across the entire scalp, beta rhythm has a low amplitude. Alcoholics have stronger beta signals than sober people do. An elevated beta power may reflect underlying genetic issues in alcoholic subjects.
In this study, a nonlinear approach is used to create an automatic system for identifying sober and drunken EEG signals.
Objective of the research
Our current efforts are concentrated on developing methods for the automatic diagnosis of mental disorders like depression and alcoholism. Earlier diagnosis and treatment of these diseases can help patients recover from their illnesses.
Several primary goals guided this study:
To create a computer-aided diagnosis system for distinguishing between normal and alcoholic EEG signals. Using nonlinear features extracted from EEG signals, create a decision support system tailored to the needs of people suffering from depression. To suggest distinct recurrence plots for typical, alcoholic, and depressed EEG groups.
In Fig. 1 we see an example of how the CAD method can automatically distinguish between sober and drunken EEG signals by using features related to nonlinear dynamics theory. Features are extracted, including the entropies from permutations, Tsalli’s entropy, fuzzy entropy, wavelets, and Kolmogorov-Sinai. Many different ranking algorithms are used to determine how important various extracted features are. These highly-ranked features can be used to train a variety of classifiers for optimal classification results. Classifier evaluations show that these nonlinear dynamics-based, highly discriminatory features can effectively separate sober from drunken EEG activity. Accuracy, sensitivity, specificity, and positive predictive value are used to assess the classifiers’ efficacy (PPV). Positive predictive value (PPV) is a statistical measure that is commonly used in EEG data analysis to assess the accuracy of a classifier. The PPV represents the ratio of true positive results, which are cases where the classifier correctly identified the presence of a particular EEG pattern or event, to all positive results reported by the classifier, including false positives, which are cases where the classifier incorrectly identified a positive case. By considering both true and false positives, the PPV provides a more comprehensive evaluation of the classifier’s performance compared to other measures such as accuracy or sensitivity.
Methodology.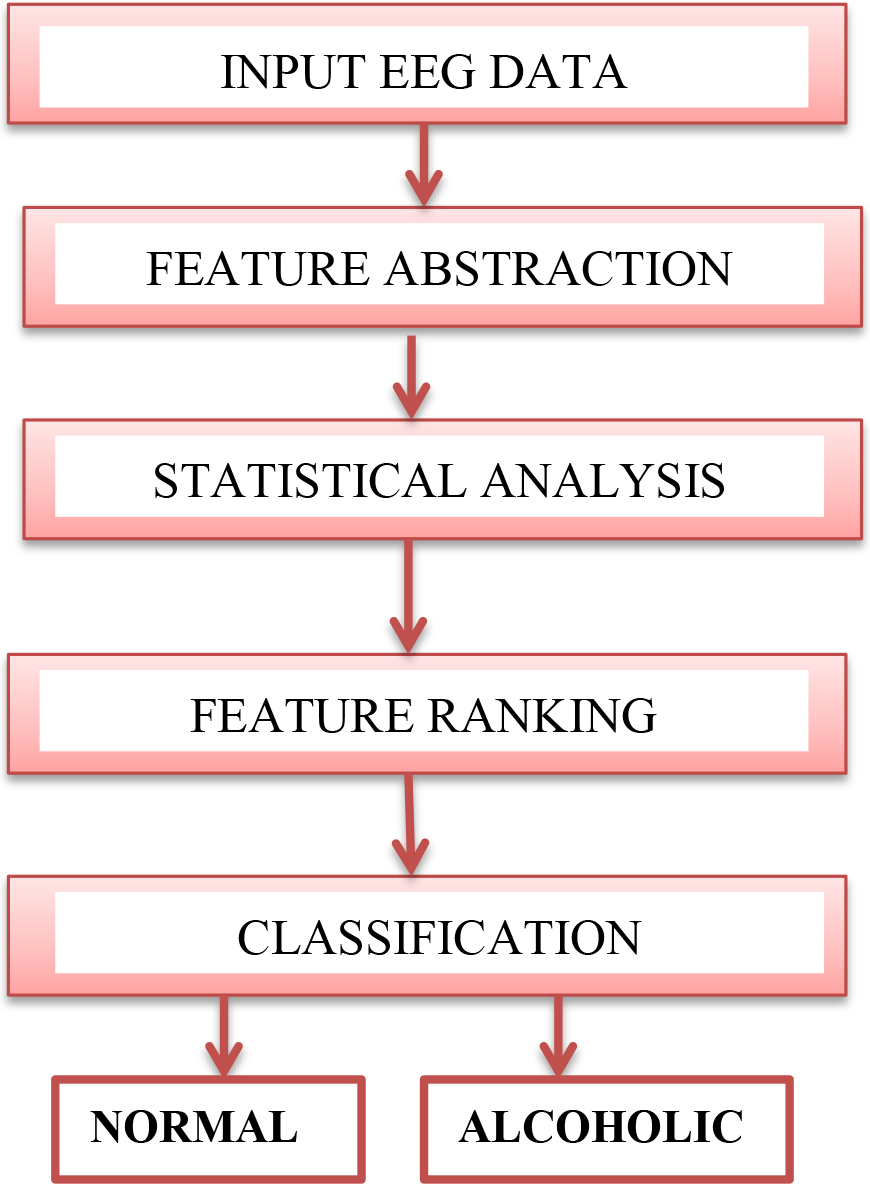
The subjects were divided into two categories: alcoholics and nondrinkers (controls). Pictures of objects from the 1980 Snodgrass and Vanderwart picture set were used as the stimuli, and either a single stimulus (S1) or two stimuli (S1 and S2) were presented to each subject. Two stimuli (S1 and S2) were presented in one of two conditions: a matched condition, in which S1 and S2 were identical, or a non-matched condition, in which S1 and S2 were dissimilar.
One hundred and twenty-two participants completed 120 trials with varying stimuli. Those with a family history of alcoholism are more likely to develop a serious drinking problem. People, who develop alcoholism due to social influences like stress, relationships, and work, as well as genetics, are represented in the EEG data.
When using nose electrodes to ground subjects, the impedance must be less than 5 k at all times. We were able to filter out the noise and other artefacts caused by interference. There were 30 control files and 30 alcoholic files taken into account. With each file containing 2048 samples, the original 30 normal/alcoholic data files were split into 120 files. Examples of normal and alcoholic EEG signals are shown in Figs 2 and 3 respectively.
Sample normal EEG signal.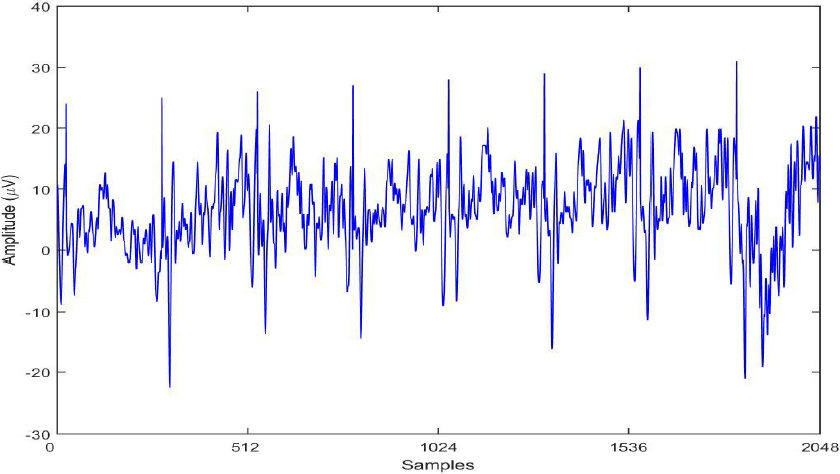
Sample alcoholic EEG signal.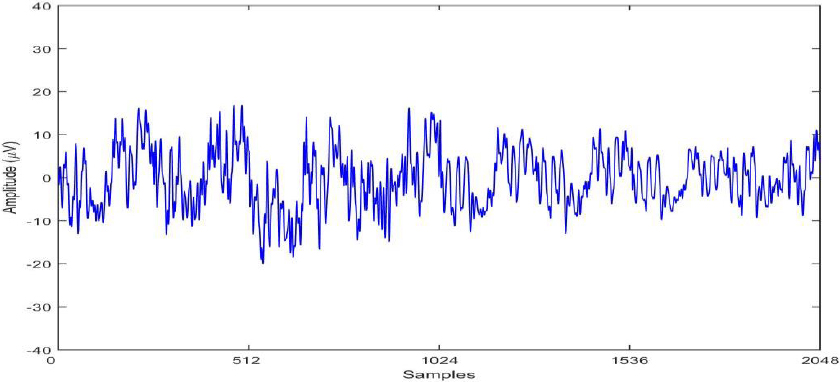
In this work, we use entropy features to characterize the behaviour of alcoholic signals. Distinguishing between normal and alcoholic EEG signal classes can be aided by the presence of significant entropy features. We can use entropy to determine how disorganized a system is.
The Kolmogorov-Sinai Entropy (KSEN)
Kolmogorov-Sinai entropy (KS) is defined as the entropy produced per unit of time by connecting the system to a weak, auxiliary bath. KS entropy is used to measure the volatility of a data signal across time and it is determined by locating points on the trajectory that are similar to one another but not connected to time in phase space. Uncertainty in the EEG time series is quantified by this entropy value. Higher entropy (greater than zero) indicates more disorder in a signal, while lower entropy indicates less disorder (close to zero). When compared to EEG signals associated with disease, normal ones tend to be quite chaotic. So, higher entropy values characterize normal EEG signals.
Sample Entropy (SampEn)
The sample entropy value indicates the regularity of the EEG signal and provides a measure of its complexity. It follows that the entropy value obtained from samples is fairly constant. An unpredictable time series is indicated by a high SampEn value, while a predictable signal is indicated by a low SampEn value.
Approximate entropy (ApEnt) is a useful tool for locating sources of instability in an EEG signal. A larger value for the approximate entropy indicates greater disorganization.
There are two main entropies in mathematics, and they are known as Shannon’s and Renyi’s, respectively. The spectral complexity of the EEG signal can be measured using several entropies, one of which is Shannon. The EEG signals’ amplitude components are used for the calculations. For data with a wide probability distribution curve, the entropy value will be high, and vice versa. When trying to describe systems where there are frequent and substantial changes in a time series, Shannon entropy falls short.
The complexity of the time series
Signals is reflected in the permutation entropy value, which is calculated in this section. The dynamics of EEG signals are related to the permutation patterns that emerge as a result of the signal’s many different components. There is a correlation between the value of the permutation entropy and the presence of asymmetry in a time series at high frequencies.
Tsallis Entropy (TEnt)
This entropy is used to quantify long-term memory effects and fluctuations in the EEG signal. Differences in the physical behaviour of healthy and diseased EEG signals can be identified. Tsalli’s coefficients characterize the spikes, bursts, and continuous rhythms of EEG signals.
Fuzzy entropy (FEnt)
The randomness of EEG signals is quantified by this entropy. These entropy numbers show how unpredictable the EEG is. According to this definition, randomness is the entropy of a fuzzy set whose elements have varying degrees of membership. The number of members can be anywhere from zero to one.
Wavelet Entropy (WE)
The level of disarray is measured by wavelet entropy. This is done by analyzing the relative energies of the EEG signals across their various frequency bands. To quantify the relative strengths of individual frequency bands in EEG data, the relative wavelet entropy provides a promising candidate for representing dynamic brain signals. Multi-frequency signal responses can be characterized by their degree of disorder, which can be quantified using wavelet entropy.
Multi-scale Multi-Variate Entropy (MMSE)
EEG signals’ inherent correlation is quantified in terms of the correlation between successive time points. If the entropy value drops, it means that differentiating the complexity of the physiological signal is becoming easier.
Feature ranking
Obtaining the best possible classification accuracy while using the fewest possible features is the goal of feature ranking and feature selection. To maximize classification accuracy, only the features with the highest ranking are kept. This allows work to be done more quickly. For this study, we employ a variety of statistical techniques for ranking features, including the
Classification
This work uses the significant features determined to be discriminative to feed the classifier SVM, which will be briefly described below.
Support Vector Machine (SVM)
As a decision surface, an N-dimensional hyperplane is built to create the maximum possible separation between the two classes of data. The two vectors on either side of the hyperplane are referred to as support vectors. A target variable and feature variables make up the training set. Based on the mapping scheme, the generated SVM model can make predictions about the class of test data [23, 24]. Separable data and non-separable data are used by the SVM classifiers. If you’re trying to classify some data that isn’t easily divisible, you’ll need to use a kernel function, like a radial basis function (RBF) or a polynomial of varying order (1, 2, or 3) [25].
Mean and standard deviation for the rankings of features extracted (A1) from sober and drunk EEG data using the Bhattacharyya method
Mean and standard deviation for the rankings of features extracted (A1) from sober and drunk EEG data using the Bhattacharyya method
Mean and standard deviation for the rankings of features extracted (A2) from sober and drunk EEG data using the Bhattacharyya method
Mean and standard deviation for the rankings of features extracted (D1) from sober and drunk EEG data using the Bhattacharyya method
Mean and standard deviation for the rankings of features extracted (D2) from sober and drunk EEG data using the Bhattacharyya method
Bhattacharyya’s ranking method yielded the most advantageous means and variances when compared to the other methods. As shown in Table 1, the Bhattacharyya ranking method was used to compare the extracted features of sober and drunk EEG signals, and the results show a wide range of values. When compared to other ranking methods, the ranges provided by this one were the best that could be achieved. The approximate coefficients at the 1, 2, and 3 levels are shown in columns A1, A2, and A3, respectively. Similarly, D1, D2, and D3 are level 1, level 2, and level 3 detailed coefficients. A number of the entropies we’ve been talking about can be calculated from these levels. Less disorder, or more order, is indicated by a negative entropy value in a signal. That’s why, in a healthy state, the entropy of an EEG signal is typically close to 1 and displays a greater range of values. Entropy decreases as a result of abnormalities such as epilepsy, depression, or alcoholism (more negative).
Discussion
In this investigation from Tables 1–4, we found striking behavioural variations between EEG signals recorded from sober and drunk people. Our findings show that the EEG signals of alcoholics may be distinguished from those of sober people. Time domain and frequency domain analyses of normal and alcoholic EEG signals are performed. As the authors demonstrated, the AR-Burgs technique performs admirably when tasked with distinguishing between the two groups. Distinguishing sober from drunken signals is accomplished with the aid of techniques based on nonlinear dynamics theory [27, 30]. They found that the nonlinear dynamics-based aspects of the alcoholic EEG showed less variability than the normal EEG.
As a means of accurately quantifying the alterations in EEG signals, this work proposes a categorization scheme for such signals based on features such as ApEn, SampEn, Shanon’s entropy, tsallis, fuzzy, wavelet, etc. There was a maximum classification accuracy of 95.89 per cent, a sensitivity of 94.43%, and a specificity of 96.67 per cent with this method. This method can be implemented in software at no additional expense, and it yields objective results. There is no need to examine it by hand.
The findings showed that normal EEG signals are characterized in a way that is distinct from those of alcoholics. The feature values unequivocally show that in an alcoholic condition, the brain’s dynamic behaviour is less erratic. It’s because alcoholics take longer to react to inputs from the outside world, which causes their brain performance to plateau. When a normally functioning person consumes alcohol for the first time, alpha waves become more prominent in the EEG. Alcohol has been shown to boost alpha power at low doses and theta power at high doses, according to a few studies.
The study utilized a narrow range of analysis techniques with a focus on entropy-based measures, which may not provide a complete understanding of the relationship between physical activity and brain activity. Furthermore, the study did not account for potential confounding variables, such as participant age, sex, or fitness level, that may have affected the results.
Conclusion
This study analyzed EEG signals using entropy features and classified them as either normal or alcoholic. The analysis revealed distinctive characteristics of normal and alcoholic EEG signals, with the latter showing less erratic dynamical behaviour due to a lag in processing external stimuli and reduced neural performance. Alcohol consumption was also found to increase alpha power at low doses and theta power at high doses, although the degree of change varies between individuals. The SVM classifier with a polynomial kernel of order 2 achieved the highest classification accuracy (95.42%) based on the Bhattacharya ranking. Such an alcohol screening system could be beneficial in various settings, such as employment, driver’s license issuance, criminal behaviour assessment, and addiction program evaluation. Additionally, the study proposed an alcoholic index that provides a single score to distinguish between the two groups, aiding clinicians in making quick and accurate diagnoses based on EEG signals in patients who have consumed alcohol.
Funding
No funds or grants were received by any of the authors.
Data availability
All data generated or analysed during this study are included in the manuscript.
Author contributions
All authors contributed to the design and methodology of this study, the assessment of the outcomes and the writing of the manuscript.
Footnotes
Conflict of interest
There is no conflict of interest among the authors.