
Abstract
BACKGROUND:
Due to the increasing prevalence of respiratory diseases and the importance of early diagnosis. The need for non-invasive and touchless medical diagnostic solutions has become increasingly crucial in modern healthcare to detect lung abnormalities.
OBJECTIVE:
Existing methods for lung abnormality detection often rely on invasive and time-consuming procedures limiting their effectiveness in real-time diagnosis. This work introduces a novel Touchless Lung Abnormality (TO-LAB) detection model utilizing universal software radio peripherals (USRP) and machine learning algorithms.
METHODS:
The TO-LAB model integrates a blood pressure meter and an RGB-D depth-sensing camera to gather individual data without physical contact. Heart rate (HR) is analyzed through image conversion to IPPG signals, while blood pressure (BP) is obtained via analog conversion from the blood pressure meter. This touchless imaging setup facilitates the extraction of essential signal features crucial for respiratory pattern analysis. Advanced computer vision algorithms like Mel-frequency cepstral coefficients (MFCC) and Principal Component Analysis (PCA) process the acquired data to focus on breathing abnormalities. These features are then combined and inputted into a machine learning-based Multi-class SVM for breathing activity analysis. The Multi-class SVM categorizes breathing abnormalities as normal, shallow, or elevated based on the fused features. The efficiency of this TO-LAB model is evaluated with the simulated and real-time data.
RESULTS:
According to the findings, the proposed TO-LAB model attains the maximum accuracy of 96.15% for real time data; however, the accuracy increases to 99.54% for simulated data for the efficient classification of breathing abnormalities.
CONCLUSION:
From this analysis, our model attains better results in simulated data but it declines the accuracy while processing with real-time data. Moreover, this work has a significant medical impact since it presents a solution to the problem of gathering enough data during the epidemic to create a realistic model with a large dataset.
Keywords

Introduction
Lung disease endures to be a vital global health concern, as evidenced by current statistics and projections through 2023. Health-related respiratory issues play a critical role in overall well-being, and early detection of lung abnormalities is imperative for effective medical treatment [1]. According to the World Health Organization (WHO) [2], the global rates of morbidity and mortality are significantly affected by respiratory infections and chronic obstructive pulmonary disease (COPD). Approximately 10.8 million people will die from lung diseases worldwide by 2020 [3].
Traditionally, the diagnosis of lung disease has relied on various imaging modalities like X-rays, CT scans, and bronchoscopy, coupled with clinical assessments and pulmonary function tests [5, 6, 7]. While these techniques are valuable, they may have limitations in terms of accuracy, accessibility, and cost-effectiveness. Since, finding the breathing rate and breathing activity of the patients is crucial for COVID-19 scenarios since irregular breathing readings could signify a decline in the patient’s health [8]. Many health problems including latent injury or metabolic ailments could result in erratic respiration. Shallow, deep, or fast breathing are the sign of respiratory disorders [9].
Non-contact monitoring is one effective method of stopping the spread of contagious diseases during a pandemic [10, 11]. In recent years, advancements in medical imaging [12], FPGA [13, 14] artificial intelligence [15], and touchless technologies have opened new avenues for enhancing the accuracy and efficiency of lung abnormality detection. Nowadays, machine learning (ML) techniques have gained increasing attention for their potential to enhance the detection and diagnosis of lung disease. To construct the ML model [16], the breathing patterns of test individuals must be examined. By leveraging large datasets of medical data, ML algorithms can learn complex patterns and relationships associated with different lung conditions. In pandemics, this method of recording breathing patterns yields very little data, which makes it impossible to build a reliable detection model [17, 18]. The need for non-invasive and touchless medical diagnostic solutions has become increasingly crucial in modern healthcare to detect lung abnormalities. In this work, a novel Touchless Lung Abnormality (TO-LAB) detection model has been proposed that includes universal software radio peripherals (USRP) and machine learning algorithms. The key contribution of this research work is pointed below:
The ML based monitoring model is presented in this paper for efficient detection of breathing abnormalities of an individual in non-contact manner. Initially, the digital-to-analog conversion is applied BP data, while HR data is captured using a camera and subsequently transformed into frames that are converted into IPPG signals.
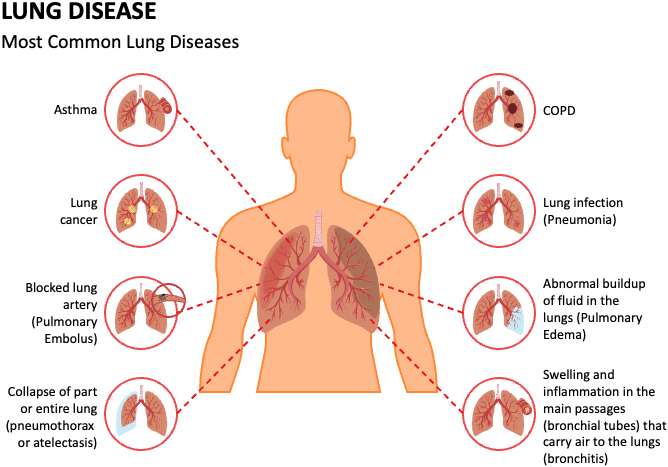
Sample image illustrating the different lung diseases [4]. The feature extraction process is employed with MFCC and PCA techniques for retrieving the most important features and fused them using multiplier for better classification. The ML-based Multi-class SVM classifies the breathing abnormalities into normal, shallow and elevated patterns based on fused features of the input data. The experimental results are verified and compared with different ML algorithms based on accuracy with the simulated and real-time data.
The rest of the paper is pre-arranged as follows Section-2 precises current research works in non-contact disease recognition, Section-3 comprises the comprehensive description of proposed TO-LAB model, Section-4 includes with results and discussion and Section-5 encompasses with conclusion and future work.
The literature presents a number of contact-based and non-contact breath monitoring methodologies. The contactless methodologies include constant monitoring at homes and even in sleeping using camera-based imaging or radio-frequency technologies. On the other hand, Contact-based methodologies includes wearable sensors and Smart watches, etc. Further, few of them were described in this review section.
In 2020 Al-hababi et al. [19] designed contactless sensing testbed with artificial intelligence to classify post-surgery behaviors. In spinal cord surgery, patients are equipped with a USRP device to monitor their movements while lifting weights. The orthogonal frequency division multiplexing (OFDM) technology was used to retrieve wireless channel state information (WCSI). For experimental research, machine learning is used to categorize the proper and incorrect methods of lifting weights. According to the proposed testbed, the fine K-nearest neighbor algorithm (FKNN) is 99.6% accurate.
In 2021 Rahman et al. [20] had introduced a QUCoughScope framework to detect COVID-19 patients with cough and respiration rate. This project implements a web application and a deep learning-based backend server to collect coughing and breathing data from users at home and screen them for COVID-19 infection. The stacking algorithm performed better than the other CNN networks for binary categorization with 96.5% of accuracy.
In 2021 Khriji et al. [21] had developed a deep learning algorithm to analyze COVID-19 cough and breath data gathered on wearable sensors or mobile phones. This technique can distinguish between positive and negative COVID-19 cases. Initially preprocessing was used to eliminate noise from audio signals and noise from coughing and breathing. After deep LSTM was used to extract deep features, the recognition phase was completed using the audio elements recovered for classification.
In 2021, Purnomo et al. [22] suggested using frequency-modulated continuous wave (FMCW) to create a non-contact medical gadget that tracks and categorizes breathing patterns in real time. The peculiar breathing characteristics of patients with breathing disorders cannot be modeled by breathing rate. A classification model called Xtreme Gradient Boosting (XGBoost) was created to classify breathing pattern decisions. It also used Mel-frequency Cepstral Coefficient (MFCC) feature extraction.
In 2021, Rehman et al. [23] proposed a non-contact SDR platform for the recognition of breathing patterns and the categorization of COVID-19 and non-COVID-19 states. utilizing fine-grained OFDM symbols, different breathing patterns are detected utilizing differences in CSI brought on by human breathing. It has a 99.4% accuracy rate for detecting and categorizing respiratory patterns. Because this platform can be used practically in pandemic and non-pandemic conditions, it has a substantial clinical effect.
In 2021, Melek et al. [24] suggested an ML to focus on a single cough sound to identify COVID-19 patients from non-COVID-19 patients. The characteristics were collected from the cough noises using the MFCCs approach, and were then classified using seven different machine learning classifiers. The distinction between COVID-19 and non-COVID-19 patients could be made with 98.3% accuracy.
In 2021, Vrindavanam et al. [25] presented a different approach for categorizing COVID-19 cough samples. Patients with COVID-19 could quickly begin using contactless identification. The model was developed using fifteen dominant features. It used a technique for choosing features that involved ranking various scores obtained from the feature selection algorithms. It can be trained using different algorithms for samples of a forced cough and a natural cough.
In 2022, Nassif et al. [26] proposed that identifying COVID-19 could require speech signal and image pre-processing. There are many different kinds of queries using image-based, speech-based, and image and speech -based models. The patient’s breathing, voice, and cough were then categorized using both long- and short-term (LSTM) memory. Additionally, CNN models Densnet201, VGG16, Inceptionv3, Xception and ResNet50 for classifying chest X-ray images.
In 2022 Dong et al. [27] detects the respiratory rate, heart rate, muscle moment, sleep, and several other biological pointers with the aid of impulse-radio ultra-wideband radar. A reference group of healthy individuals was compared with 140 radar monitoring data from a hospital. XGBoost and logistic regression were then employed to divide the data into unhealthy and healthy groups. Compared to other single machine learning methods, the XGBoost with LR algorithm showed good precision of 92.5%
In 2022 Alkhodari and Khandoker [28] examined the viability of separating COVID-19, including asymptomatic, and healthy people using breathing sounds recorded from smartphones inside a structure of deep learning. This framework based on manually created features that were taken from the original recordings and the MFCC using CNN-BiLSTM. Additionally, it effectively identified COVID-19 individuals with a maximum sensitivity of 94.21%.
In 2023 Jamil and Roy [30] introduced efficient DL frameworks for detecting various VHDs, featuring simpler network architectures. Three frameworks were demonstrated, analyzing both 1D and 2D PCG signals. D-CNN extracts features for 2D PCG, while MFCC and LPCC were used for 1D PCG. Nature-inspired algorithms like particle swarm optimization (PSO) and genetic algorithm (GA) enable automatic feature selection from raw PCG data. They developed a vision transformer (ViT) model using self-attention on 2D PCG’s time-frequency representation, achieving an outstanding mean average accuracy of 99.90%.
Badnjevic et al. s[31] had designed an integrated software suite has been developed to aid physicians in analyzing and interpreting pulmonary function test results, enhancing asthma detection, diagnosis, and treatment. Utilizing fuzzy rules and a trained neural network, the software determines and classifies asthma status. Over one thousand report samples were utilized for training data. In testing with 289 patients previously diagnosed by physicians, the software achieved a classification accuracy of 97.22% for asthma and 98.61% for normal lung function, aligning closely with physicians’ reports.
In 2023 Singh et al. [32] developed “Tinku,” an affordable robot inspired by “WALL-E,” to assist children with special needs. It utilizes models like Yolo v3-tiny and SSD for tasks like obstacle avoidance and nonverbal communication. Developed under clinical supervision, Tinku undergoes thorough testing, including a survey on its appearance and interaction with children, particularly those with autism spectrum disorders (ASD). Tinku’s extensive features and meticulous management make it a valuable tool for teaching and supporting children with special needs in today’s world where ASD diagnoses are increasingly prevalent.
Badnjevic et al. [33] presented the outcomes of a software suite designed for asthma categorization, highlighting the significance of bronchodilator response (BDR) tests in evaluating variable airway obstruction, especially in patients with compromised lung function during visits. An intuitive integrated software solution was developed based on these aspects to assist physicians in interpreting and understanding data from pulmonary function tests, thus imprsoving the detection, diagnosis, and management of asthma. The software demonstrated a high level of agreement with physicians, accurately classifying asthma in 65 cases (90.27%).
Tabulation analysis of the existing literature works
Tabulation analysis of the existing literature works
The technical advantages and disadvantages of the existing works are summarized in Table 1. The devices employed in contact-based methodologies are often problematic, heavy, and expensive for patients. Camera-based imaging breath monitoring requires a thermal imaging camera or depth camera that can be computationally demanding and expensive [37]. Traditional diagnostic methods, often reliant on invasive procedures or extensive physical contact, may present challenges in terms of patient comfort, hygiene, and accessibility. In response to these challenges, a touchless approach was introduced that harness the power of USRP and ML have emerged to detect lung abnormality. The current application uses an MFCC and PCA feature extraction block and a recognition engine to categorize touchless infection. The feature computing algorithm is implemented in FPGAs for real-time lung abnormality categorization of breathing using a system-level design approach.
In this section, a novel TO-LAB model was described foe effective identification of breathing abnormalities such as normal, shallow and elevated breathing. Figure 2 shows the systematic model for our proposed machine learning-enabled respiratory abnormality detection system.
Schematic flow of the proposed TO-LAB model.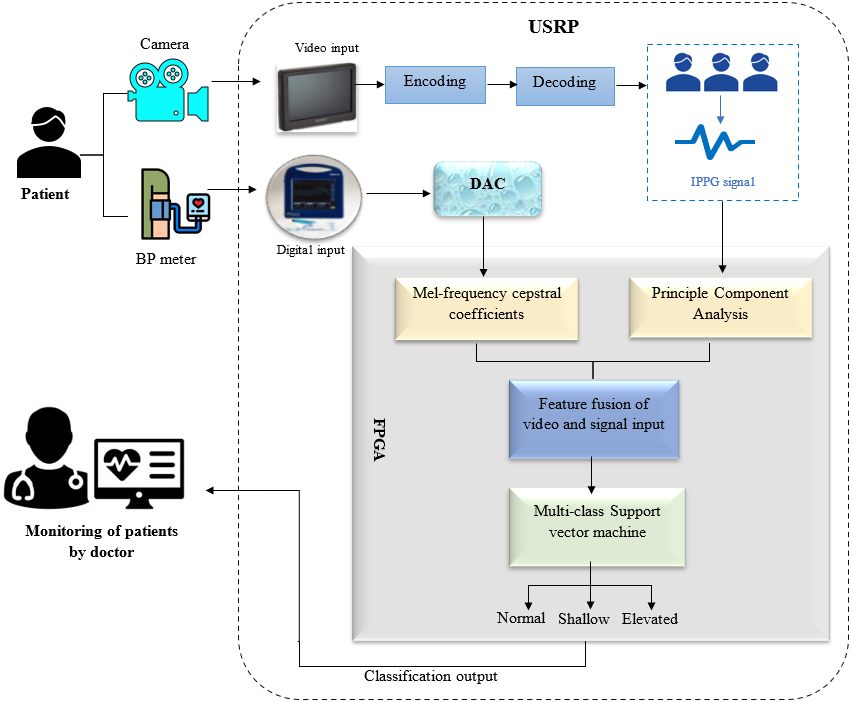
Digital-to-Analog Converter (DAC) plays a vital role in converting digital representations of blood pressure patterns into analog voltage signals. In this application, digital data derived from monitoring a person’s breathing, often obtained through sensors, is processed and converted by the DAC into a continuous analog voltage signal. This reconstructed analog signal mirrors the variations in chest movement during inhalation and exhalation. The precision and accuracy of the DAC are crucial in faithfully reproducing the digital breathing data as an analog signal. This analog output can then be utilized for applications such as interfacing with external devices or systems that respond to analog signals, allowing for real-time feedback or integration into various healthcare and physiological monitoring setups.
Mel-frequency cepstral coefficients
In this section, the relevant features are extracted from the breathing patterns using MFCC to detect breathing abnormalities in the lungs. The MFCC considers breathing patterns to be frequencies. The last step in MFCC is Discrete Cosine Transform (DCT) which measures the similarity of the BP signals.
Representation of MFCC for the input BP signal.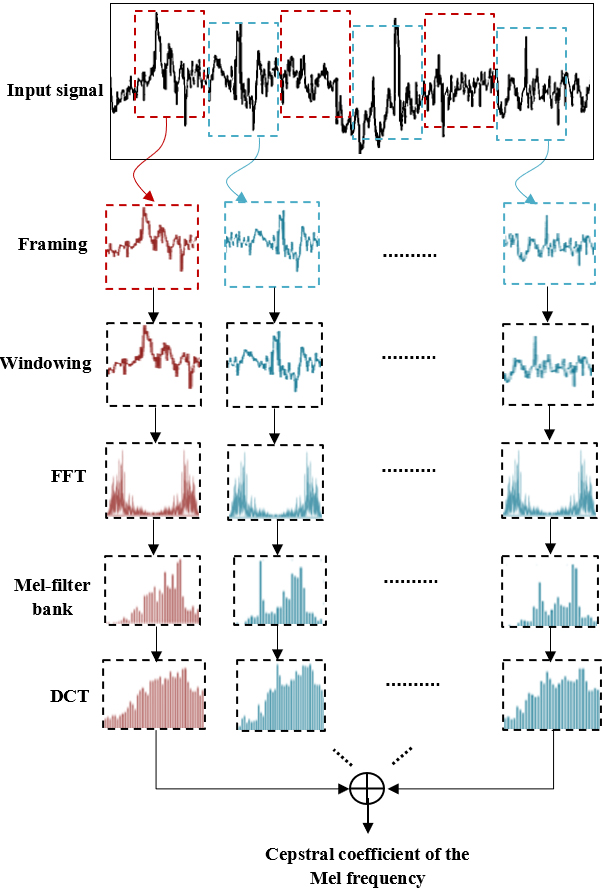
Figure 3 displays the process of feature extraction in BP signal with the MFCC technique. The MFCC approach involves five important steps as shown in Fig. 2 to extract cepstral features that is represented as (A). The BP rate for each time window was derived through the analysis of the frequency content of the extracted respiratory signals. Thus, a high frequency filter produces a wider bandwidth. For particular patterns of time, the coefficients serve as a good representation of the key elements in the signal information. The mathematical definition of MFCC is:
An FPGA was used to implement the MFCC calculation algorithm utilizing a system level approach with Xilinx System Generator (XSG) tool. To fully capture the temporal properties and variations of the input signal, it is first divided into time frames, which typically overlap significantly.
A high-frequency component known as the leakage effect will be produced at each end of a signal block. The initial and last points in the frame are kept continuous while the leaking impact is reduced through the employment of a Hamming window. After Hamming windowing, the signal is indicated by c(m)*x(m) if the signal in a frame is denoted by c(n), where m=0….M-1 and x(m) defines the Hamming window as,
where
This method produces a breakdown of the frequency elements that made up the original signal. Third, the bandpass filters integrated into the Mel-frequency scale are used to pass these frequency-separated signals. The MFCC technique offers two essential pieces of information, one of which is the generalized frequency response. Cepstral coefficients for the Mel frequency are the second important piece of information. The coefficients of the band-passed frequency response are extracted from the log by DCT of each intermediate signal. The DCT transform typically produces the MFCC of the audio signal. The following equation describes a collection of cepstral coefficients (
The I/O protocols and hardware that are used to implement the PCA method. MicroBlaze controls direct memory access (DMA) using a prefetching-based DRAM and DDR3 SDRAM for data input. Programmable components are used in the implementation of the PCA method. Debugging is also carried out using a RS232 controller (during development). MicroBlaze and its memory, PLB bus, DMA, and RS232 controllers are fixed components, while the reconfigurable unit is a reconfigurable component, which allows us to co-design hardware and software. An algorithm is implemented entirely on this reconfigurable unit or just its most suitable components (those that can be executed on hardware). The process converting the image to IPPG signal is displayed in Fig. 4.
Representation of image to IPPG signal conversion.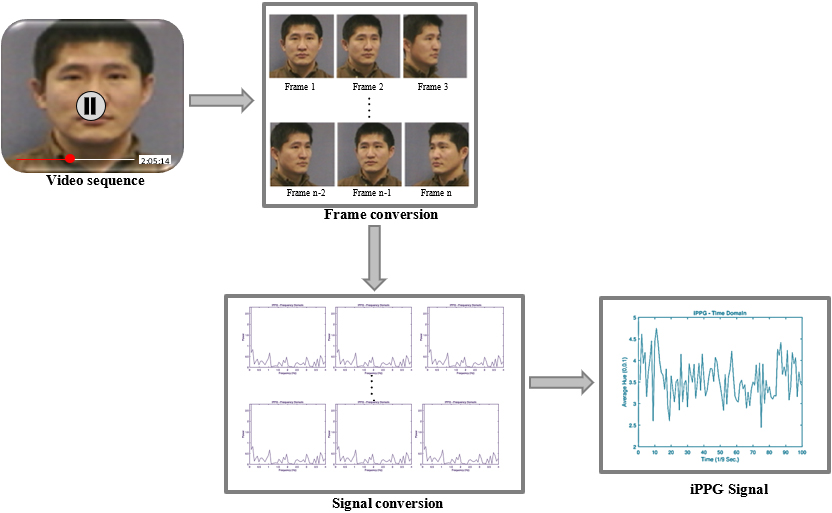
A MicroBlaze has the main advantage of allowing easy reconfiguration and adaptation for various inputs and outputs (SD Card, Ethernet, PCI bus, etc.). The covariance matrix was not computed using a hardware implementation. Due to the penalty caused by I/O communications, this option is inferior to computing them using software. Consequently, these variations are computed by the MicroBlaze CPU. The various computations are combined between software and hardware in this way. The concept is that the hardware will perform operations on the covariance matrix elements while the software calculates the variances. PCA method was constructed by utilizing the hardware and bus interactions, which use two FIFOs. The Jacobi module is applied to compute the frequency and amplitude of the signal in the new base are retrieved by the projection modules.
In order to detect heart rate from a video sequence, the iPPG signal is transformed from the time-domain to the frequency domain as shown in Fig. 3. The frequency and time domains of an iPPG signal captured during an 11-second user face capture using a standard laptop camera recording at 30 frames per second with a 640
The primary and mean components of the data are determined through PCA. It is frequently applied as a method of feature extraction. The technique is typically used to boost variance and capture potent feature patterns. The feature extraction from respiratory patterns improves PCA performance. A lower frequency subspace is created by the various operations on the feature matrix. then, from the lower dimension matrix, determine the covariance matrix. The covariance matrix illustrates the relative variance between signals. Principal components are regarded as being the frequency with the highest amplitude are defined as the principal coefficients features (B) from this feature extraction modules and this features also fused in the fusion module.
In the fusion module design, two feature vectors are dot-product using the architecture of the multiplier. The first vectors are extracted from the BP i.e., represented as
Hardware architecture to fuse the two feature vectors.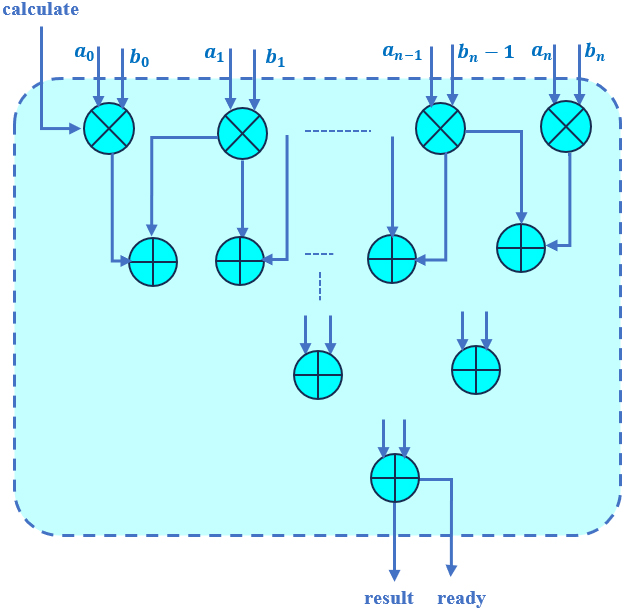
The product element by element resulting
Multi-class SVM is a classification technique used to classify data into more than two classes. This approach was used to classify breathing patterns based on the extracted features. Multi-class optimization problems are usually decomposed into several binary classification problems in this method instead of solving them directly. In order to classify breathing abnormality, a three-fold random cross-validation procedure was used. In the preceding module, the multi-class SVM was used to categorize breathing abnormalities. Multi-class SVM was designed with the help of statistical learning theory and structural risk minimization. A multiclass SVM is usually composed of multiple binary SVMs. Data points belonging to a particular class are trained to distinguish them from those belonging to all other classes during training. In the case of a multiclass classifier, the output class is predicted based on the class with the highest confidence value among all classes. The decision function in a linear SVM is mathematically derived as,
Where
Where
Hyperparameter tuning of Multi-class SVM
Table 2 illustrates the hyperparameters of the multi-class SVM. In the multiclass classification, the SVM is tuned with the radial basis function (RBF) kernel that allows the model to create nonlinear decision boundaries by mapping the input data into a high-dimensional feature space. Selecting an appropriate value for gamma is scaled (0.0) for achieving good generalization performance. Particularly in the selection of RBF kernel, the parameter gamma reaches the high values in classification. The regularization parameter is C which specified as 0.1 to control the trade-off between maximizing the margin and minimizing the classification error. Epsilon loss specifies the variance among the predicted value and the actual target value falls within this margin of tolerance for errors.
This section presents the experimental arrangement and discusses the findings. To evaluate the proposed touchless detection of lung abnormality, parallel architecture of breathing patterns for three classes of respiration (normal, shallow and elevated) are utilized for training and testing samples. The same categorization results are obtained using MATLAB software and XSG tool. The overall experimental setup was displayed in the Fig. 6.
A framework for FPGA-based touchless detection accepting a sequence as input is designed for the experiments. The different breathing pattern calculated and then determines the video sequences for the classification of breathing abnormalities. The signal vectors are based on FPGA technology and reach a frequency of 100 KHz. The selected sample frequency allows the system to categorize vectors every 3 seconds after receiving 300 vectors. The proposed TO-LAB method consists of two phases: an online categorization stage and an offline training phase.
Calculation of classifying the different breathing abnormalities
Calculation of classifying the different breathing abnormalities
Dataset description of the proposed model
Experimental arrangement of the proposed TO-LAB framework.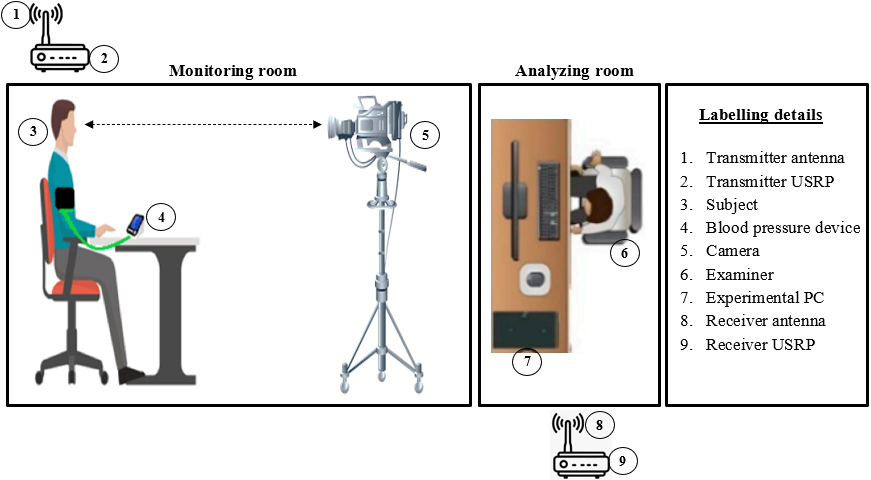
Table 3 shows the condition statements for classifying the breathing abnormalities such as normal, shallow breathing and elevated breathing. The normal breathing ranges from 80 to 120 mmHg with heart rate of 72 bpm; Elevated breathing ranges from 120 to 129 mmHg with heart rate of 90 bpm; and Shallow Breathing ranges greater than 129 mmHg with heart rate more than 90 bpm. The analysis is carried out based on this calculation for classifying the breathing abnormalities.
In this work, we have collected 3650 samples from a publicly available MIT-BIH arrhythmia database [38]. The details of data distributions are shown in Table 4. We collected the sample with different class targets omprising of three types of lung abnormalities.
The MIT-BIH Arrhythmia Database accessible on the Physionet website, comprises various segments categorized as atrial premature beats (AP), ventricular premature beats (VP), normal beats (N), right bundle branch block beats (RB), and left bundle branch blocks (LB).
The data was recorded using a sample frequency of 360 Hz with two leads. In practical applications, certain samples are captured using a real-time camera setup. Among six distinct breathing tasks, 3650 samples were collected, resulting in 14,888 samples for each lasting 30 seconds of all breathing activities. These data are then augmented are used for training or analysis of the ML algorithm.
Performance analysis
A real-time wireless monitoring and classification system for respiratory problems is based on the acquisition of fine-grained CSI. There were three distinct conditions examined in this section: elevated, shallow, and normal breathing.
Coefficients values for simulated breathing abnormalities
Coefficients values for simulated breathing abnormalities
Three respiratory regimes were assessed using three devices (USRPs, RGB-D depth-sensing camera and BP meters) with University of Glasgow ethical approval. For ten seconds each, the participant was instructed to breathe shallowly and elevated. In addition, different data are collected from the USRP and the BP meter is attached to the arms of the participant at the same time. During the testing and data collection of our experiment, many factors including any physical items that might interfere with the wireless signal.
Table 5 illustrates the efficacy of the proposed TO-LAB model based on amplitude and frequency of the signals. The three different breathing patterns namely normal, shallow and elevated breathing of the gathered signals is illustrated in Table 5. The breathing patterns are varied from 0.25 to 3.85 for the amplitude variations and the breathing patterns are varied from 0.002 to 0.028 for the frequency variations.
Performance assessment of breathing factor with proposed model
Table 6 shows the efficiency assessment of random breathing component with selected model. MSE is a measure of the average squared difference between corresponding values of the estimated signal and the true signal. It is often used as a metric to assess the accuracy of a prediction or estimation algorithm. The correlation coefficient is a statistical measure that quantifies the degree of association or linear relation among two variables. In the context of signals, the correlation coefficient is often used to assess the similarity or resemblance between two signals. The experiment was conducted in order to classify respiratory components according to two distinct classes using the proposed model. To differentiate between different respiratory classes, the proposed framework uses breathing rate to detect and link the extracted breathing factors to the proposed TO-LAB model. The effectiveness of the proposed model was determined using the specific parameters viz., precision (P), recall (R), F1 score (F1), accuracy (A), and specificity (S).
where TP and TN signifies true positives and negatives of the sample images, FP and FN indicates false positives and negatives of the input data samples.
The results attained by the multi-class SVM for the simulated and real-time datasets is illustrated in Table 7. The multi-class SVM reaches the average accuracy of 99.54% and 96.15% for simulated and real-time datasets. From this analysis, the multi-class SVM acquires the overall P, R, S and F1 of 97.34%, 95.37%, 93.64% and 91.42% respectively for simulated dataset.
Performance analysis of the proposed model
Validation curve of the proposed model for (a) simulated data and (b) real-time data.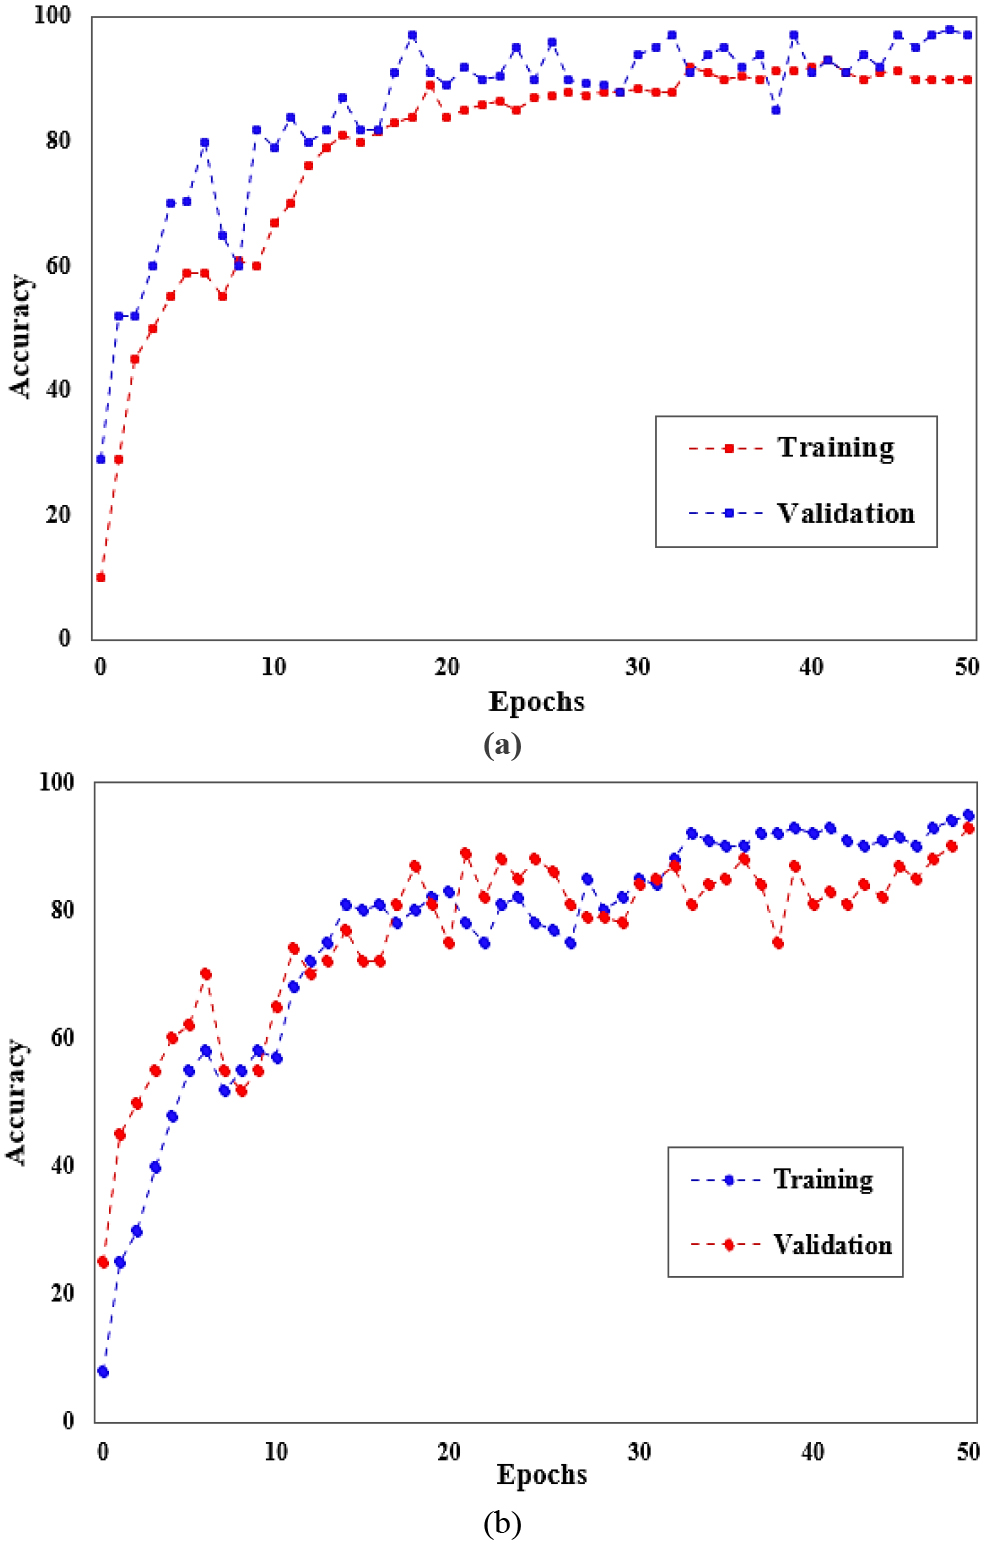
Figure 7 displays the validation curve of the proposed approach for the simulated dataset and real-time dataset. The overall accuracy attained by the proposed approach is 99.54% as shown in Fig. 7(a) for the simulated data. The overall accuracy attained by the proposed approach is 96.15% as shown in Fig. 7(b) for the real-time data. A significant gap between the training and validation curves that indicate overfitting. Moreover, the loss rate of the proposed network is low that attains higher accuracy level.
Quantitative evaluation based on MSE and CC parameters
Table 8 shows that the evaluation of the proposed approach in terms of the MSE and CC for classification. The correlation coefficient applied to assess the similarity between an original signal and a processed or distorted version of that signal. A lower MSE value indicates a smaller average error between the estimated and true signals, suggesting better accuracy of the estimation algorithm.
A confusion matrix (Fig. 8) used in classification to evaluate the efficacy of a classification algorithm. The confusion matrix is based on the comparison between the predicted labels and the true labels of a set of images. The Fig. 6(a) shows high classification accuracy for simulated data than the Fig. 6(b) for simulated data to classify the breathing abnormalities. This matrix is particularly useful for analysing the Multi-class SVM to classify signals into different abnormal categories in the context of signal classification.
In this section, a comparative examination of the proposed TO-LAB model with the existing machine learning models are discussed. To estimate that the fallouts of the proposed TO-LAB is more effective on the basis of A, S, P, F1, and R. Table 6 illustrates the comparison of different machine learning classifiers like Naïve Bayes (NB), Decision tree (DT), Random Forest (RF) and Support vector machine (SVM) with the proposed Multi-class SVM.
The effectiveness of each machine learning method was assessed based on its specific parameters, as shown in Table 8. Accuracy, prediction speed, and training duration were measured and observed per second respectively.
Comparative analysis of existing machine learning models
Comparative analysis of existing machine learning models
Confusion matrix of Multi-class SVM (a) for simulated data (b) for real-time data.
Four different machine learning methods are employed as classifiers. As shown in Table 9, the efficacy of each ML model was assessed in terms of accuracy and other parameters. Among all ML algorithms, Multi-class SVM has the highest classification accuracy for the simulated data. The comparison of the existing ML algorithms for classification of breathing abnormalities based on the specific parameters. The Multi-class SVM achieved a high accuracy than the prior methods. From Table 9, it is clear that Multi-class SVM better than the other ML models like NB, DT, RF and SVM. Relatively, Multi-class SVM attains high accuracy of 99.54%, that was greater than the other ML classifiers in the categorization stage. From Table 8, the proposed Multi-class SVM increases the overall accuracy by 12.07%, 10.17%, 5.89%, and 4.41% better than NB, DT, RF and SVM respectively.
Accuracy comparison – Existing models vs TO-LAB model
Table 10 illustrates the comparison of existing techniques and proposed touchless detection model based on the simulated data. The proposed TO-LAB model improves the overall accuracy range of 0.50%, 1.01%, 0.48% and 3.065% better than [22, 24, 19, 20] respectively based on the simulated dataset. According to Table 10, the Proposed machine learning-based TO-LAB model yields the accuracy of 99.54% which is comparatively higher than existing works. Yet, the existing techniques not performs well when contrasted to the proposed TO-LAB framework. Thus, it is clearly seen that the proposed TO-LAB model has good competence than other existing techniques for the categorization of breathing patterns.
An experiment was conducted to assess the effectiveness of the proposed TO-LAB model using an ablation study on the gathered simulated dataset. Table 10 shows the comparison of removing the PCA and MFCC feature extraction techniques for the detection of lung abnormalities.
Ablation analysis – with and without feature extraction techniques
Ablation analysis – with and without feature extraction techniques
This section extensively assessed the efficacy of the proposed TO-LAB model by various performance metrics, employing either a single feature extraction technique PCA or MFCC. From Table 11 MFCC is found to be more suitable for assessing breathing conditions and detecting subtle changes with high accuracy. Detailed breathing patterns allowed for the thorough evaluation of any anomalies or damage attributed to lung abnormalities. In this ablation analysis, the proposed TO-LAB model demonstrated superior accuracy (97.08%%) when utilizing MFCC, which outperformed than PCA (95.42%). Additionally, all other evaluated metrics exhibited variability alongside accuracy. Interestingly, combining both PCA and MFCC resulted in a notably higher level of recognition accuracy (99.54%). Through ablation analysis, it was determined that the proposed TO-LAB model utilizing both PCA and MFCC achieved high accuracy in categorizing breathing patterns into different classes.
In this work, the goal is to detect lung disease by classifying the breathing abnormalities using ML algorithms with low complexity and high accuracy. For the experimental analysis, we used both the simulated data and real-time data for the detection of lung abnormalities. the results were assessed using multiple assessment parameters with MSE, correlation, A, P, R, F1, and S. Table 4 presents the efficiency evaluation of the random breathing component using the chosen model. The experiment aimed to classify respiratory components into two distinct classes utilizing the proposed model. To distinguish between different respiratory classes, the framework employs breathing rate to detect and associate the extracted breathing factors with the proposed TO-LAB model. Moreover, the efficiency of the proposed Multiclass SVM with A, P, R, F1, and S. Table 6 shows the performance analysis based on these parameters. The multi-class SVM reaches the average accuracy of 99.54% and 96.15% for simulated and real-time datasets. Additionally, the multi-class SVM reaches the overall P, R, S and F1 of 96.87%, 97.51%, 96.81% & 98.43% and 97.26%, 97.57%, 98.27% & 96.45 respectively for simulated and real-time datasets.
The Multi-class SVM was compared with the existing ML algorithms based on the forementioned parameters. Multi-class SVM yields maximum accuracy level of 99.54%, that was greater than the other ML classifiers in the categorization stage. It is clear that Multi-class SVM performs better than the other ML models like NB, DT, RF and SVM based on the simulated data as illustrated in Table 8. The training and prediction time complexity of the Multi-class SVM is specified as
Moreover, the efficacy of the proposed TO-LAB model was assessed with the different prevailing models as depicted in Table 9. From this scrutiny, the proposed TO-LAB model improves the overall accuracy range of 0.50%, 1.01%, 0.48% and 3.065% better than Non-contact SDR platform, ML-MFCC, Non-contact sensing testbed and QUCoughScope respectively based on the simulated dataset.Hence, it is evident that the proposed TO-LAB model exhibits superior performance compared to other existing models in categorizing breathing patterns. Further, the ablation study thoroughly assessed the efficacy of the proposed TO-LAB model with various performance metrics, utilizing either PCA or MFCC as a single feature extraction technique. Results indicate that MFCC is more effective in evaluating breathing conditions and detecting subtle changes with greater accuracy, as observed from the Table 10. This ablation analysis revealed that the TO-LAB model, incorporating both PCA and MFCC attained impressive accuracy in classifying breathing patterns across various categories.
Conclusion
This work introduced a novel TO-LAB model for touchless detection of lung disease by classifying the breathing abnormalities as normal, shallow and elevated patterns. The touchless nature of the proposed TO-LAB model enhances patient comfort, reduces the risk of cross-contamination, and facilitates remote monitoring. The efficiency of this TO-LAB model was evaluated with the simulated and real-time data. The specific parameters such as accuracy, specificity, precision, recall and f1 score were calculated for evaluating the performance of Multi-class SVM. The proposed Multi-class SVM increases the overall accuracy by 12.07%, 10.17%, 5.89%, and 4.41% better than NB, DT, RF and SVM respectively. According to the findings, the proposed TO-LAB model attains the maximum accuracy of 96.15% for real time data; however, the accuracy increases to 99.54% for simulated data for the efficient classification of breathing abnormalities. The proposed TO-LAB model improves the overall accuracy range of 0.50%, 1.01%, and 0.48% better than Non-contact SDR platform, ML-MFCC, and Non-contact sensing test bed respectively based on the simulated dataset. From this analysis, our model attains better results in simulated data but it declines the accuracy while processing with real-time data. Moreover, this work has a significant medical impact since it presents a solution to the problem of gathering enough data during the epidemic to create a realistic model with a large dataset. In the future, we aim to enhance the data collection by augmenting and concurrently monitoring multiple individuals and incorporating additional environmental factors. Additionally, we plan to fine-tune advanced deep learning models to improve the performance of our model on the specific dataset.
Ethical approval
My research guide reviewed and ethically approved this manuscript for publishing in this Journal.
Author contributions
The authors confirm contribution to the paper as follows: Study conception and design: C. Rajeshkumar, K. Ruba Soundar; Data collection: C. Rajeshkumar; Analysis and interpretation of results: K. Ruba Soundar; Draft manuscript preparation: C. Rajeshkumar, K. Ruba Soundar. All authors reviewed the results and approved the final version of the manuscript.
Funding
None.
Availability of data and material
Data sharing is not applicable to this article as no new data were created or analyzed in this Research.
Human and animal rights
This article does not contain any studies with human or animal subjects performed by any of the authors.
Informed consent
I certify that I have explained the nature and purpose of this study to the above-named individual, and I have discussed the potential benefits of this study participation. The questions the individual had about this study have been answered, and we will always be available to address future questions.
Footnotes
Acknowledgments
The author would like to express his heartfelt gratitude to the supervisor for his guidance and unwavering support during this research for his guidance and support.
Conflict of interest
This paper has no conflict of interest for publishing.