
Abstract
Introduction
Ocular misalignment as an indicator of central functioning has a long history in vestibular system testing and diagnosis. For example, static misalignment of ocular torsion has been suggested as a marker of vestibular impairment, specifically otolith impairment [5]. The data about static and dynamic misalignment are complex and difficult to interpret. This problem may be related to the method for collecting data on ocular counter roll. Markham and Diamond reviewed the evidence that ocular counter roll under static conditions is a poor marker of otolith impairment [3]. These investigators were interested in developing predictive metrics for space motion sickness [3, 4].
Perceived tilt with reference to gravity can be made more overt with the use of visual cues. Therefore, in the quest for a better marker of space motion sickness Beaton et al., developed the Vertical Alignment Nulling (VAN) and Torsional Alignment Nulling (TAN) tests [1]. In each test the final positions of a movable horizontal or rotated line was compared to a fixed horizontal line. VAN and TAN were tested under conditions of micro- and hypergravity during parabolic flight. Beaton et al., reported differences in VAN and TAN scores dependent on the amount of gravitational exposure. They concluded that VAN and TAN were valid measures of ocular misalignment in the context of the space environment. VAN and TAN have recently been validated against prism diopter and established as reliable over repeatedmeasures [2].
Based on the previous work by Beaton et al., we updated the original prototypes of VAN and TAN. Then, in the present study, we compared scores from patients with vestibular disorders and scores from healthy controls. The goal was to determine whether VAN and TAN can identify spatial orientation impairments that would be consistent with ocular misalignment in a clinical population with mixed disorders of the peripheral vestibular system.
Methods
Subjects
Subjects were 14 healthy controls and 8 patients with known vestibular disorders recruited from visitors to the Otology service at Baylor College of Medicine. Patients were diagnosed based on bi-thermal caloric tests, Dix-Hallpike tests, low frequency whole-body sinusoidal rotations in darkness, and cervical vestibular evoked myogenic potentials (ENG). Patients were recruited after having been seen for clinical services including neurotology, ENG testing, and vestibular rehabilitation. The cohort is described in Table 1. All subjects gave informed consent prior to participation. This study was approved by the Institutional Review Board for Baylor College of Medicine and Affiliated Hospitals.
Demographic data about control and patient groups. Age in years. Sex: F, female, M, male.Diagnoses of patients: benign paroxysmal positional vertigo (BPPPV), vestibular neuritis (VN),including unilateral vestibular labyrinthitis, vestibular hypofunction and vestibular neuronitis;pre-operative acoustic neuroma (AN), and Meniere’s disease (MD); numbers in parentheses are sample sizes
Demographic data about control and patient groups. Age in years. Sex: F, female, M, male.Diagnoses of patients: benign paroxysmal positional vertigo (BPPPV), vestibular neuritis (VN),including unilateral vestibular labyrinthitis, vestibular hypofunction and vestibular neuronitis;pre-operative acoustic neuroma (AN), and Meniere’s disease (MD); numbers in parentheses are sample sizes
Subjects were tested while seated in a dark room, wearing corrective lenses as needed. The tests were administered on a tablet computer, Samsung Galaxy Model SM-T700, mounted vertically at eye level for the subject, inside a black enclosure for maximal light reduction. The enclosure was covered with a black-out curtain that covered the subject’s head, shoulders, and arms while the subject sat 46 cm away, (Fig. 1). The room lights were turned off during testing. A bubble-level application installed on the tablet ensured that the device was upright with respect to Earth horizontal.
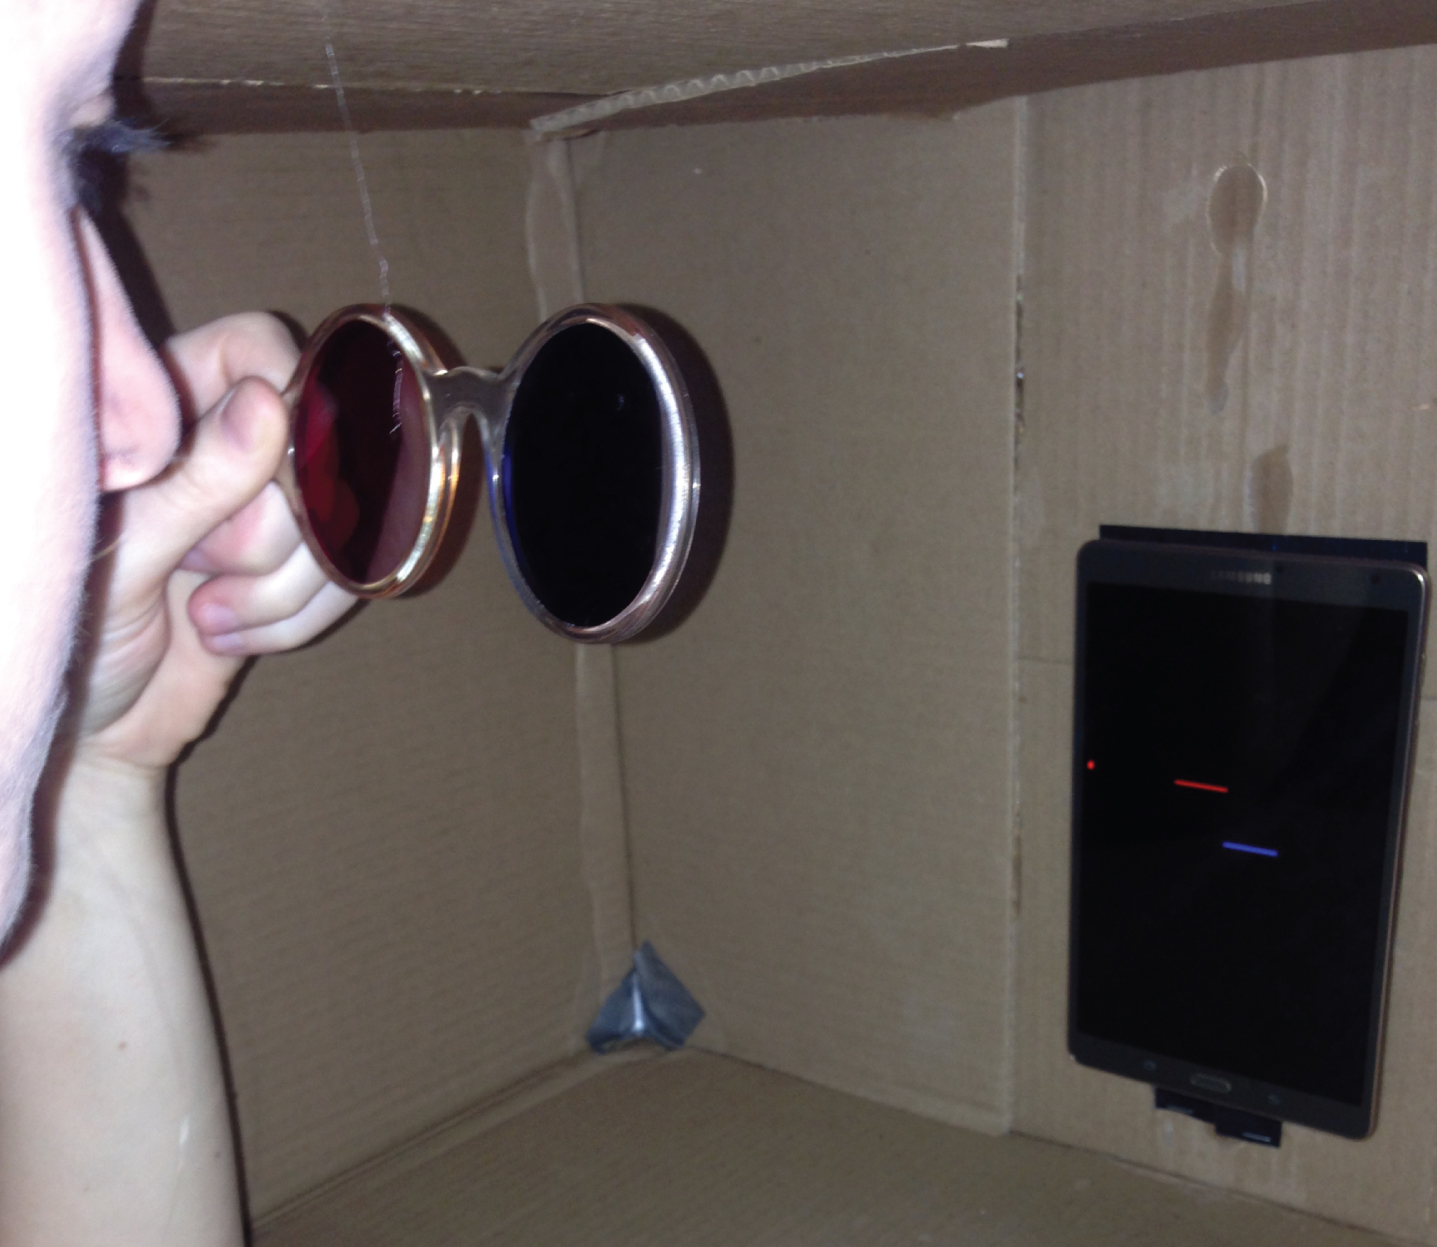
Illustration of the VAN test. The subject is holding a lorgnette frame with lenses that are color-matched to the red/blue lines displayed on the tablet. The subject uses a finger-swiping motion on the tablet to adjust the vertical position of the blue line so that it appears in line with the stationary red line. During actual testing, the cardboard housing was not illuminated, the subject’s head and body and the cardboard housing were covered with a blackout curtain, the room was dark, the lorgnette frames were held directly over the eyes or against the subject’s eyeglasses, and the tablet was placed in front of the subject and level with earth-horizontal by using a bubble level app.
During testing the subject held a pair of 5 cm diameter, colored lenses up to his or her eyes mounted in a lorgnette frame, provided by the local optician. The lens tints, from BPI Therapeutic Tints, were: left lens, Deep Ruby Red, BPI Monochrome 600, and right lens, Deep Dark Blue, BPI Deep Blue Zee 550. The lorgnette lens ensured that the subject saw dissociated images, thus the brain saw two separate lines. Subjects practiced the task prior to using the lorgnette and had 5 practice trials of VAN and 5 of TAN prior to data collection.
During VAN and TAN testing, the subject viewed one red and one blue line on the tablet screen through the color-matched red and blue filters. The red line was designated as the stationary line and remained fixed on the screen, while the blue line was designated as the moving line, and was repositioned by the subject: vertically (up and down) during VAN and torsionally (clockwise and counter-clockwise) during TAN. During both VAN and TAN the subject was instructed to adjust the moving line until it appeared perfectly in-line with the stationary line (i.e., to null any apparent vertical or rotational offset between the two lines). Subjects were instructed to tap a spot on the tablet screen to indicate trial completion. After five practice trials of VAN and five practice trials of TAN each subject performed 20 trials of VAN followed by 20 trials of TAN. The tests were not timed. Subjects could take as long as they wanted on each trial. The dependent measures were the final amounts (degrees) by which the lines were separated from one another vertically or rotated relative to oneanother.
For both the TAN and VAN scores, we examined mean changes (least square means) over the 20 trials and compared them between patients and controls using generalized mixed models (proc mixed in SAS). We controlled for any possible confounding influence of age and gender by including them as co-variates on each model. P < 0.05 was considered statistically significant. All analyses were performed in SAS statistical software (SAS, version 4.0,Cary, NC).
Results
Patients had significantly worse scores than controls on TAN, (mean 2.2° vs 0.75°, p = 0.01), and no differences than controls on VAN, (mean 0.4° vs 0.8°, p = 0.07). On TAN and VAN, both patients and controls changed significantly over the 20 trials (p < 0.05). As shown in Figs. 2 and 3, on both tests the mean score was reached by approximately trial 6.
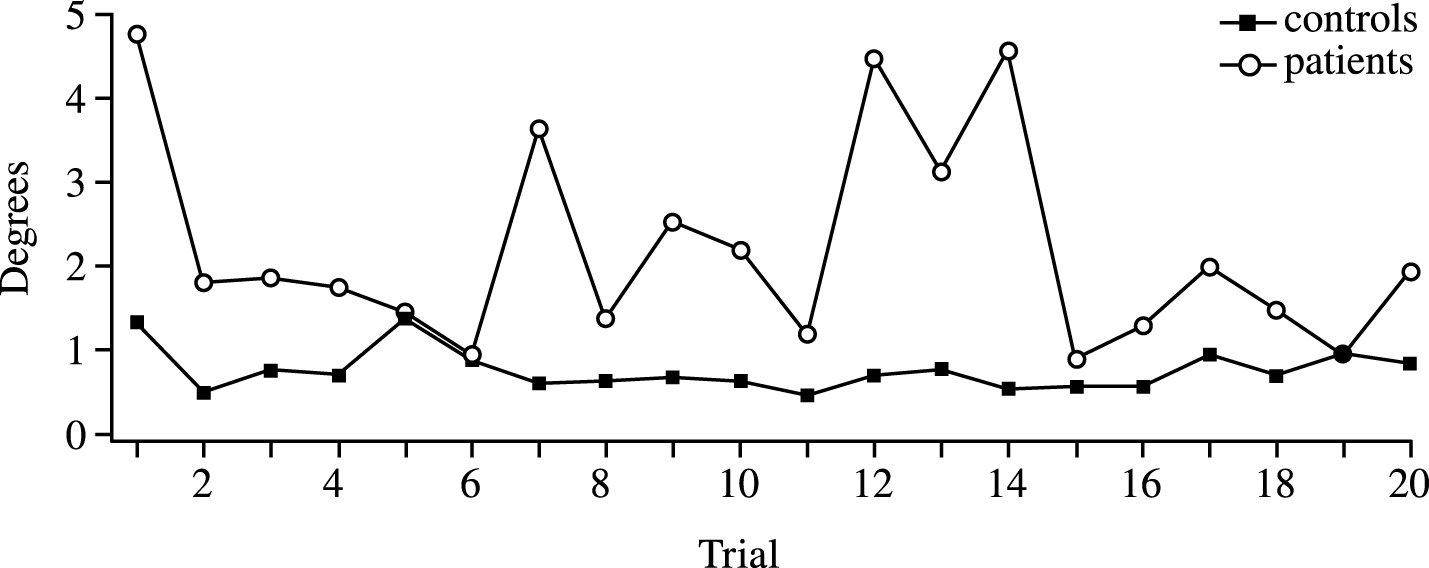
Absolute values of mean TAN scores over trials. Closed squares are controls. Open circles are patients. Note the scale, from 0 to 5 deg.
The control group was significantly younger than the patients, p = 0.002. To control for any possible influence of age and gender, we included those variables as co-variates when examining the difference between patients and controls on TAN and VAN. Overall, after adjustment, we saw a pattern similar to the unadjusted analysis. Patients performed worse than controls for TAN (mean 1.87° vs 0.86°), although this difference did not reach statistical significance (p = 0.1). No difference between patients and controls was seen for VAN after adjustment (mean 0.4° vs 0.8°, p = 0.16).
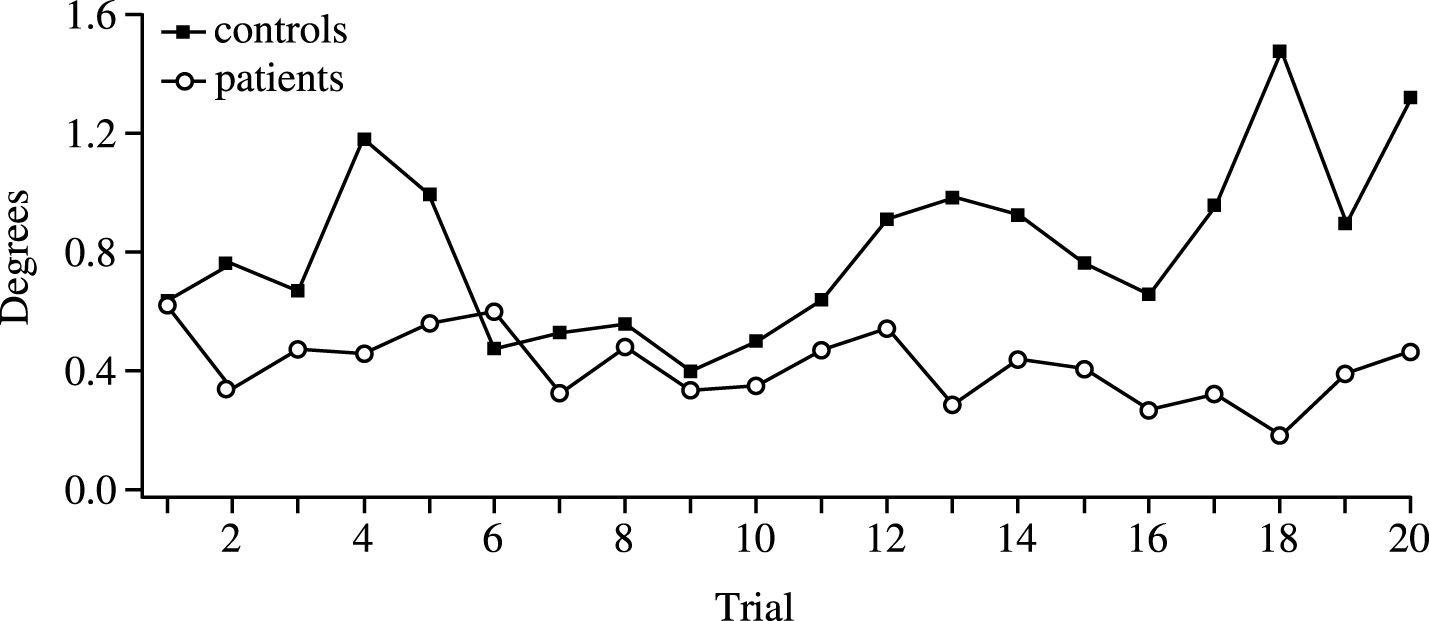
Absolute values of mean VAN scores over trials. Closed squares are controls. Open circles are patients. Note the scale, from 0 to 1.6 deg.
The results suggest that TAN might be useful as a screening test for vestibular impairment. The finding supporting the use of VAN for screening is not as strong. The data suggest that subjects fatigued before or by the time they performed trial 10. Subjects’ anecdotal reports support that idea. After a while most subjects asked how many more trials they had to do. Some subjects had to be encouraged to complete the trials because they were fatigued.
This study had several limitations. The sample size was relatively small, due to unanticipated delays in software development and patient recruitment. A larger sample might have shown the variability of the VAN and TAN outcomes in patients across wide ranging vestibular disorders and might have shown a difference in the adjusted scores for TAN. The finding of significant differences with such a small sample using TAN, however, indicates the robustness of the test concept despite variability in vestibular function. The test was cognitively challenging for some subjects. Although we did not prescreen with cognitive tests, we excluded subjects known to have dementia. All subjects were competent to give informed consent. Some of the subjects who found the task to be challenging were younger than age 65. VAN and TAN would not be appropriate for patients with dementia or other limitations of cognition.
Further development must be done to make the software more user-friendly, to develop population-based age- and sex-related norms, and to upgrade the hardware and software for current use. We did not measure eye movements during testing. Therefore, the amount of vergence, ocular misalignment, or ocular counter-roll used by each subject is unknown.
Also, ensuring complete darkness was impossible. Tiny light leaks in the enclosure may have confounded the results. Some subjects had said they were mildly claustrophobic but no subjects were unable to perform the test or to complete the trials. A severely claustrophobic person might not have been able to perform the test. Finally, our data suggest that the optimal number of trials to measure TAN and VAN data adequately is 6 trials for TAN and approximately 10 trials for VAN. Most subjects appeared to fatigue and the data became more variable beyond thosetrials.
Despite these limitations the findings suggest that TAN, at least, and possibly VAN, have potential for clinical use. These tests might be useful for screening patients in facilities that are not equipped to perform cervical and ocular vestibular evoked myogenic potentials (VEMP), or to test ocular misalignment directly. VAN and TAN are behavioral measures of ocular misalignment, which is different from the physiologic measure of VEMP or the perceptual measure of subjective visual vertical (SVV). Additionally, SVV is performed with both eyes viewing the same image; in contrast, VAN and TAN avoid any suppression of ocular positioning mis-alignments by ensuring that the subject’s eyes see two different images. This difference is a critical advantage of VAN and TAN vs. SVV given the visual system’s remarkable capacity to fuse disparate visual scenes [6]. In conclusion, VAN and TAN require minimal equipment, include the use of colored lenses that can be held up to any size or shape eyes or eyeglasses (i.e. lorgnette), and the test instructions are easily learned.
Footnotes
Acknowledgments
We thank Chris Miller, MS, KBRwyle; Debbie Orr, FNAO, BCM Optical Shop; and the staff of the Center for Balance Disorders, Baylor College of Medicine, for invaluable technical assistance.
Supported by NIH grant 2R01Dc009031 (HSC), a grant to from the National Space Biomedical Research Institute through NASA NCC 9-58 (APM, JJB), DOD grant W81XWH-15-1-0442 (MCS), and a fellowship from the Austria Marshall Plan Foundation (JS). The technology described herein is protected by US Patent 9,072,481.