
Abstract
BACKGROUND:
Sound is not only detected by the cochlea, but also, at high intensities, by the vestibular system. Acoustic activation of the vestibular system can manifest itself in vestibular evoked myogenic potentials (VEMPs). In a clinical setting, VEMPs are usually evoked with rather high-frequency sound (500 Hz and higher), despite the fact that only a fraction of saccular and utricular hair cells in the striolar region is available for high-frequency stimulation.
OBJECTIVE:
As a growing proportion of the population complains about low-frequency environmental noise, including reports on vestibular symptoms, the activation of the vestibular system by low-frequency sound deserves better understanding.
METHODS:
We recorded growth functions of oVEMPs and cVEMPs evoked with air-conducted sound at 120 Hz and below. We estimated VEMP thresholds and tested whether phase changes of the stimulus carrier result in changes of VEMP amplitude and latency.
RESULTS:
The VEMP response of the otholith organs to low-frequency sound is uniform and not tuned when corrected for middle ear attenuation by A-weighting the stimulus level. Different stimulus carrier phases result in phase-correlated changes of cVEMP latencies and amplitudes.
CONCLUSIONS:
VEMPs can be evoked with rather low-frequency sound, but high thresholds suggest that they are unlikely to be triggered by environmental sounds.
Introduction
In recent years, complaints from the general public about exposure to low-frequency (LF) sounds (i.e. with frequencies below about 100 Hz) have been mounting. This concurs with a significant increase in the numbers of electricity-generating wind turbines and other forms of sustainable energy production such as heat pumps, possibly suggesting causality. Probably as a result, a rising number of people oppose the construction of new wind turbines, partly because they fear adverse health effects. Despite reports of various health problems from complainants in the vicinity of wind turbines, it is unclear whether and how human health can be affected by exposure to LF sound [e.g. 3, 23, 28]. When dealing with LF sound pollution, the human auditory system is the obvious starting point for the dissection of the events leading from LF sound emissions to reports of annoyance or impaired health, and yet, data on the effects of LF sound on the human auditory system are scarce. Notable exceptions are reports on the Bounce phenomenon, a slowly-cycling (over several minutes) change of cochlear sensitivity after exposure to intense LF sound [29, 35]. The Bounce phenomenon manifests itself in reversible changes of the hearing threshold [29, 30] and cochlear by-products such as evoked and spontaneous otoacoustic emissions [20–22, 33–37].
The human auditory system is not well suited to process LF sounds, as several peripheral mechanisms attenuate the detection during transduction [45]: The middle ear transfer function shows high-pass characteristics [17] and the helicotrema, a small connection between the fluid spaces of Scala Vestibuli and Scala Tympani, shunts LF pressure waves and therefore attenuates the driving force for hair cell stereocilia displacement [16]. Cochlear inner hair cells are not connected to the overlying tectorial membrane, and are hence velocity-coupled, which attenuates stereocilia displacement with decreasing frequency [18].
The vestibular sensory system, however, is inherently suited by design to detect slow passive and active movements, but it can also be triggered by intense air-conducted (AC) or bone-conducted (BC) sound [6, 44]. This is routinely exploited in a clinical context by measuring vestibular evoked myogenic potentials (VEMPs). VEMPs are part of a vestibular reflex arc and are mainly driven by activity of the otolith organs, saccule and utricule, induced by AC or BC sound [9, 14]. Hence, VEMPs are an indirect measure of vestibular activity, contrary to recordings from vestibular afferents. However, as VEMPs are non-invasive, they are easily applicable in humans and can serve as a surrogate for otolith organ function. For correctly interpreting VEMPs it is crucial to understand what aspects of otolith organ activity are reflected in the response. This is especially important when assessing the potential of LF sound for activating the vestibular system.
In the clinical setting, VEMPs are typically evoked with intense tone bursts of 500 Hz or higher, as responses have been shown to be largest at these frequencies [24]. This is surprising, because the otolithic membrane acts as a low-pass filter [10, 39] and only hair cells in the striolar region, which are not, or only loosely, attached to the otolithic membrane, are available for stimulation with frequencies higher than 100 Hz [13]. VEMPs, when evoked with frequencies around 500 Hz or higher, therefore presumably only reflect the activity of the small proportion of striolar hair cells, and not that of the entire macula. The majority of the extrastriolar vestibular hair cells in the otolith organs, however, should be driven by acoustic stimulation with frequencies lower than 100 Hz.
For a thorough understanding of the effects of LF sounds on humans, the vestibular organ should be included in any investigation. As cVEMPs and oVEMPs evoked with AC sound are now widely considered to selectively reflect activity of the saccule and utricle [8, 40], respectively, we assessed cVEMP and oVEMP thresholds in the range between 40 and 120 Hz in order to gain selective information from the two otolith organs. In a second step, the relation between the stimulus carrier phase and cVEMP characteristics was established, based on earlier indications that VEMP waveforms may lock onto AC sound carrier waveforms at low frequencies [48].
While VEMPs have been evoked by AC sound with frequencies as low as 50 Hz [24, 50], it has, to the best of our knowledge, not been attempted to establish thresholds by recording VEMP growth functions evoked by LF, AC stimuli.
Methods
Participants
Twenty-four participants were included in this study for the first set of experiments, out of which 21 participants showed a robust cVEMP wave configuration for threshold detection, (9 male, 12 female, age range 19–30 years, median age 22 years) and 21 had stable oVEMPs (9 male, 12 female, age range 19–30 years, median age 22 years). From 18 participants datasets for both cVEMPs and oVEMPs could be obtained. 27 participants (18 female, 9 male) took part in the second set of experiments. Only participants with normal audiograms (<20 dB HL between 125 Hz and 8 kHz) and without any reports of chronic or temporary diseases of the middle or inner ear took part. This study was approved by the Ethics Committee of the University Hospital Munich, Ludwig-Maximilians Universität München, Germany, in agreement with the Code of Ethics of the World Medical Association (Declaration of Helsinki). All participants gave their written informed consent. Experiments were conducted in a sound-attenuated laboratory space at the Department of Biology, Ludwig-Maximilians Universität München, Martinsried, Germany.
VEMP recording setup
A medical-grade, optically-isolated, battery-powered headstage (ISO-Z Isolation Head Stage, CWE, Ardmore, Pennsylvania, USA) was used to differentially record myogenic potentials from the sternocleiodmastoid muscle (cVEMPs) or from the extraocular muscles (oVEMPs) with an amplification gain of 20 dB. The analogue signal was fed into the A/D input of an external soundcard (Fireface UC, RME, Haimhausen, Germany), further amplified by 35 dB and sampled at a rate of 48 kHz and with a word length of 24 bits. Signals were filtered with a digital band-pass (high-pass: 20 Hz, low-pass: 500 Hz), covering the most relevant frequency content of both cVEMPs and oVEMPs [42]. An inbuilt calibrator of the head stage provided an electrical square wave with known amplitude, and enabled us to express the recorded VEMP waveform amplitudes in microvolt.
In contrast to most studies investigating otolith organ tuning by recording AC sound-evoked cVEMPs and oVEMPs, no headphones were used in the present study for acoustic stimulus delivery. Rather, we developed a sound system with very little harmonic distortion consisting of a loudspeaker coupled to PVC tubing, the tip of which was sealed into the ear canal. Software- and hardware settings, as well as the low-pass filter properties of the sound-conducting tube limited the frequency and intensity contents of the stimuli and made it impossible that high-frequency sounds with high intensities were accidentally delivered to the participants’ ears. The sound system is based on an 8-inch aluminium cone subwoofer (Rockwood, Sintron GmbH, Iffezheim, Germany) covered with an acrylic glass plate containing a 3 cm opening in the centre. A gasket between the plate and the loudspeaker ensured a pressure-tight seal. The tip of a 4.2 m long PVC-tube (inner diameter 0.5 cm) was sealed into the opening by the use of a custom-made adapter. The subwoofer was driven by an AV receiver (AVR 135/230, Harman/ Kardon, Northridge, California, USA). The other end of the tube was coupled to custom-built ear tips made from PVC tubes (inner diameter 0.3 cm) and foam ear tips (E-A-R Classic II PD01200, 3M, Nadarzyn, Poland), which ensured a good seal of the sound system in the participants’ meatus. A very thin silicone tube, connected to a probe microphone system (ER-7C, Etymotic Research, Inc., Elk Grove Village, Illinois, USA), was inserted through a small hole in the tube wall of the ear tip, and sealed. This ensured that sound pressure levels could be calibrated in situ. For this, the frequency response of the probe microphone system was compared to the frequency response of an artificial ear (B&K ear simulator type 4157, Brüel & Kjaer, Naerum, Denmark) and corrected accordingly. Sound pressure levels, owing to the brief duration of the acoustic stimuli, were expressed in peak-equivalent dB SPL (abbreviated dB peSPL in the following). Harmonic distortion in the acoustic system, assessed with continuous tones, was present but relatively low, with the magnitude of the 2nd and 3rd harmonic at least 30 dB lower relative to the 1st harmonic at all used frequency-level combinations. The acoustic stimuli were calibrated in the participants’ ear canal before each recording to ensure constant sound pressure levels. This also served to detect acoustic leaks in the sound system. The analogue signals for all acoustic stimuli were generated with an external soundcard (see above). The sound system was placed in the ipsilateral meatus, relative to the electrode placement, for cVEMPs recordings, and in the contralateral meatus for oVEMP recordings. All sound generation and data acquisition was carried out with custom-written scripts run in the MatLab (MathWorks Inc., Natick, Massachusetts, USA) environment. Sound stimulation and data acquisition were sample-exactly synchronised by employing the SoundMexPro toolbox (HörTech, Oldenburg, Germany) for Matlab.
Electrode placement
After carefully cleaning the participants’ skin at the electrode positions with isopropanol (70%), electrodes (MLAWB19 EEG flat electrodes, AD instruments Ltd, Oxford, UK) were filled with conductive gel. For cVEMP recordings, electrodes were placed just above the belly of the sternocleidomastoid muscle (inverting input), on the lower end of the muscle near the sternum (non-inverting input), and on the sternum itself (ground). cVEMPs were recorded with the participant lying down and while holding the elevated head turned away from the recording site at an angle of about 45°. Participants were instructed to maintain an approximately constant muscle tension, which was trained before the actual experiment by providing visual feedback of the recorded potentials.
For oVEMP recordings, electrodes were placed as close as possible to the lower eye lid (inverting input), below the inverting input next to the ala of the nose (non-inverting input), and on the sternum (ground). During recordings, participants sat upright and kept a constant upward gaze angle (and therefore constant muscle tension) of about 30° by fixating a target placed accordingly on the wall in front of them. In-between recordings, participants were asked to rest and relax in order to avoid muscle fatigue.
Stimuli
cVEMPs and oVEMPs were evoked with AC sound. Stimuli consisted of pure tones with frequencies between 40 and 120 Hz in 20 Hz increments, and with a duration of one period. In a second set of experiments, the phase of a sinusoidal 120 Hz stimulus (the carrier) was pseudo-randomly changed in 45° steps between 0° and 360°. To avoid on- and offset transients, and thus a broadening of the frequency content, all stimuli were multiplied with an equal-length Hanning window, at the cost of a slight upward shift in the spectral peak of the stimulus. For each trial, 128 acoustic stimuli were presented with a repetition rate of 6 Hz (cVEMPs) or 3 Hz (oVEMPs), and the resulting VEMP responses were averaged in the time domain for further analysis.
Procedure and analysis
Establishing thresholds for VEMPs (i.e. the lowest sound pressure evoking a significant VEMP signal) and varying the phase of the stimulus carrier necessitates repeated recordings with various sound pressure levels. As VEMPs are evoked with short, but relatively intense acoustic stimuli, great care was taken to avoid overexposure and the delivered accumulated acoustic energy was carefully monitored. The maximum peak sound intensity was no more than 140 dB SPL, and it was ensured that the daily total energy delivery [5, 41] was always below 132 dB compared to 20μPa for 1 s (equal to the reference of LAeq 87 dB for 8 hours, based on the European Union (2003) and U.K. (2005) guidelines). During experiments, the expected total energy delivery was re-calculated before each subsequent recording, and the recording session was concluded for the day when the reference value was predicted to be exceeded. Participants were also reminded to immediately report any discomfort during the recordings. None were reported. Participants in the threshold trials completed the datasets for all five tested frequencies within about four recording sessions on different days, separated by at least 24 hours, while the phase-carrier trials were typically completed within one day. To determine VEMP thresholds, VEMP recordings were started with supra-threshold stimulus levels, based on pilot recordings, and the levels were then lowered in 3 dB decrements. After undershooting the threshold, the levels were increased in 1 dB increments until the threshold was reached again [see also 42 for recommended threshold procedures].
The root mean square (RMS) value within a time window of 50 ms after the stimulus onset was calculated and the latencies of the largest positive and negative peaks were used to characterise the recorded VEMP waveforms (see Fig. 1a –d). We chose the RMS as a measure of VEMP amplitude because previous literature indicates that morphology of the waveform is very variable at low stimulus frequencies so that the commonly given peak-to-peak value does not adequately quantify the strength of the VEMP in our measurements [48]. These RMS values are however not directly comparable with VEMP amplitudes expressed as peak-to-peak values in previous studies that used higher-frequency stimulation. Latencies were collected from all significant waveforms (see below for significance procedures), corrected for the required travel time in the sound system’s tubing (12 ms), and expressed relative to stimulus onset. Thresholds were defined as the lowest sound pressure level needed to evoke a significant VEMP waveform. Significance was determined with an objective procedure based on a bootstrapping algorithm as detailed in J. Lv et al. [38]. In short, the 128 recorded epochs were concatenated to form a long, continuous sequence. Within this sequence, 128 random starting points for new epochs with the same length as the original epochs were calculated, the new epochs were averaged in the time domain, and the RMS was calculated. This procedure was repeated 500 times. The ratio of the number of reordered, averaged epochs with an RMS equal to or larger than the original RMS and the 500 new sequences was determined. The original VEMP waveform was deemed significant when the ratio was equal to or smaller than 0.05. Only significant waveforms were included in the subsequent analysis.

cVEMPs and oVEMPS evoked with various stimulus intensities. Representative, unnormalised waveforms of cVEMPs (a, c) and oVEMPs (b, d) evoked with 120 Hz (a) and 100 Hz (b), and 40 Hz (c and d) at various sound pressure levels (cVEMPs: between 93 and 137 dB peSPL, oVEMPs: between 110 and 137 dB peSPL). The vertical lines demarcate the signal part used for analysis (0–50 ms relative to acoustic stimulus onset). e–h: corresponding growth functions of the waveforms shown in a–d as a function of stimulus level. Solid markers indicate significant waveforms (see methods on how significance was established). Magnitudes are expressed as RMS of the signal within the vertical lines. Note that within the level ranges tested (typically 20–30 dB) growth functions do not appear to saturate.
For the phase-dependence trials, the carrier of a single-period, Hanning-windowed, 120 Hz-sinusoid was varied in 45° increments over a full cycle, resulting in nine trials per participant. The level of acoustic stimuli were set individually to achieve a robust cVEMP, as tested with stimuli without a phase shift, satisfying the statistical criterion described above, and were between about 120 and 127 dB peSPL. All other parameters were kept constant, and were the same as in the threshold trials. Stimuli with different carrier phases were presented in an individually randomised order. All statistics reported are the results of Skillings-Mack tests [46], as datasets were shown to be not normally distributed (Kolmogorov-Smirnov–test).
General characteristics
cVEMPs and oVEMPs evoked with rather LF sound in the present study shared general characteristics with those evoked with higher frequencies in previous studies by other groups [e.g. 6, 24, 27, 43, 50], and showed a typical waveform with a positive-negative, and a negative-positive peak, respectively (see Fig. 1a, c and 1b, d, respectively, for representative examples of cVEMP and oVEMP waveforms). As reported before by others, the maximum amplitude of oVEMPs (typically up to 5μV, [50]) is much smaller than the amplitude of cVEMPs (several 100μV, [6]). VEMP amplitudes increased almost monotonically with increasing sound pressure levels as soon as the threshold was reached (see Fig. 1e–h), again consistent with reports in earlier studies [e.g. 19, 47]. Within the sound pressure level range used in this study to detect thresholds, no saturation of VEMP amplitudes could be observed (see Fig. 1 for representative examples of cVEMP and oVEMP growth functions).
cVEMP and oVEMP threshold estimates as a function of stimulus frequency
Thresholds were determined as a function of stimulus frequency. In general, for both oVEMPs and cVEMPs, thresholds decreased with increasing stimulus frequency, and consequently more participants showed consistent VEMP waveforms within the tested level range as stimulus frequency increased (Fig. 2). For cVEMPs, the median threshold at 40 Hz was 137 dB peSPL decreasing to 118 dB peSPL at 120 Hz, indicating a clear stimulus frequency dependence (Fig. 2a: p < 0.001, df = 4, T = 49.32). Thresholds of oVEMPs showed a similar frequency dependence as cVEMPs, with a median of 135 dB peSPL at 40 Hz, decreasing to 121 dB peSPL at 120 Hz (Fig. 2b: p = 0.052, df = 4, T = 9.409). A-weighting the thresholds eliminates the frequency dependence (see Fig. 2) for both cVEMPs (p = 0.46, df = 4, T = 3.56) and oVEMPs (p = 0.94, df = 4, T = 0.77), and suggests that the frequency dependence is mainly due to middle ear transfer characteristic, which is the dominant factor reflected in the A-weighting in this frequency region.
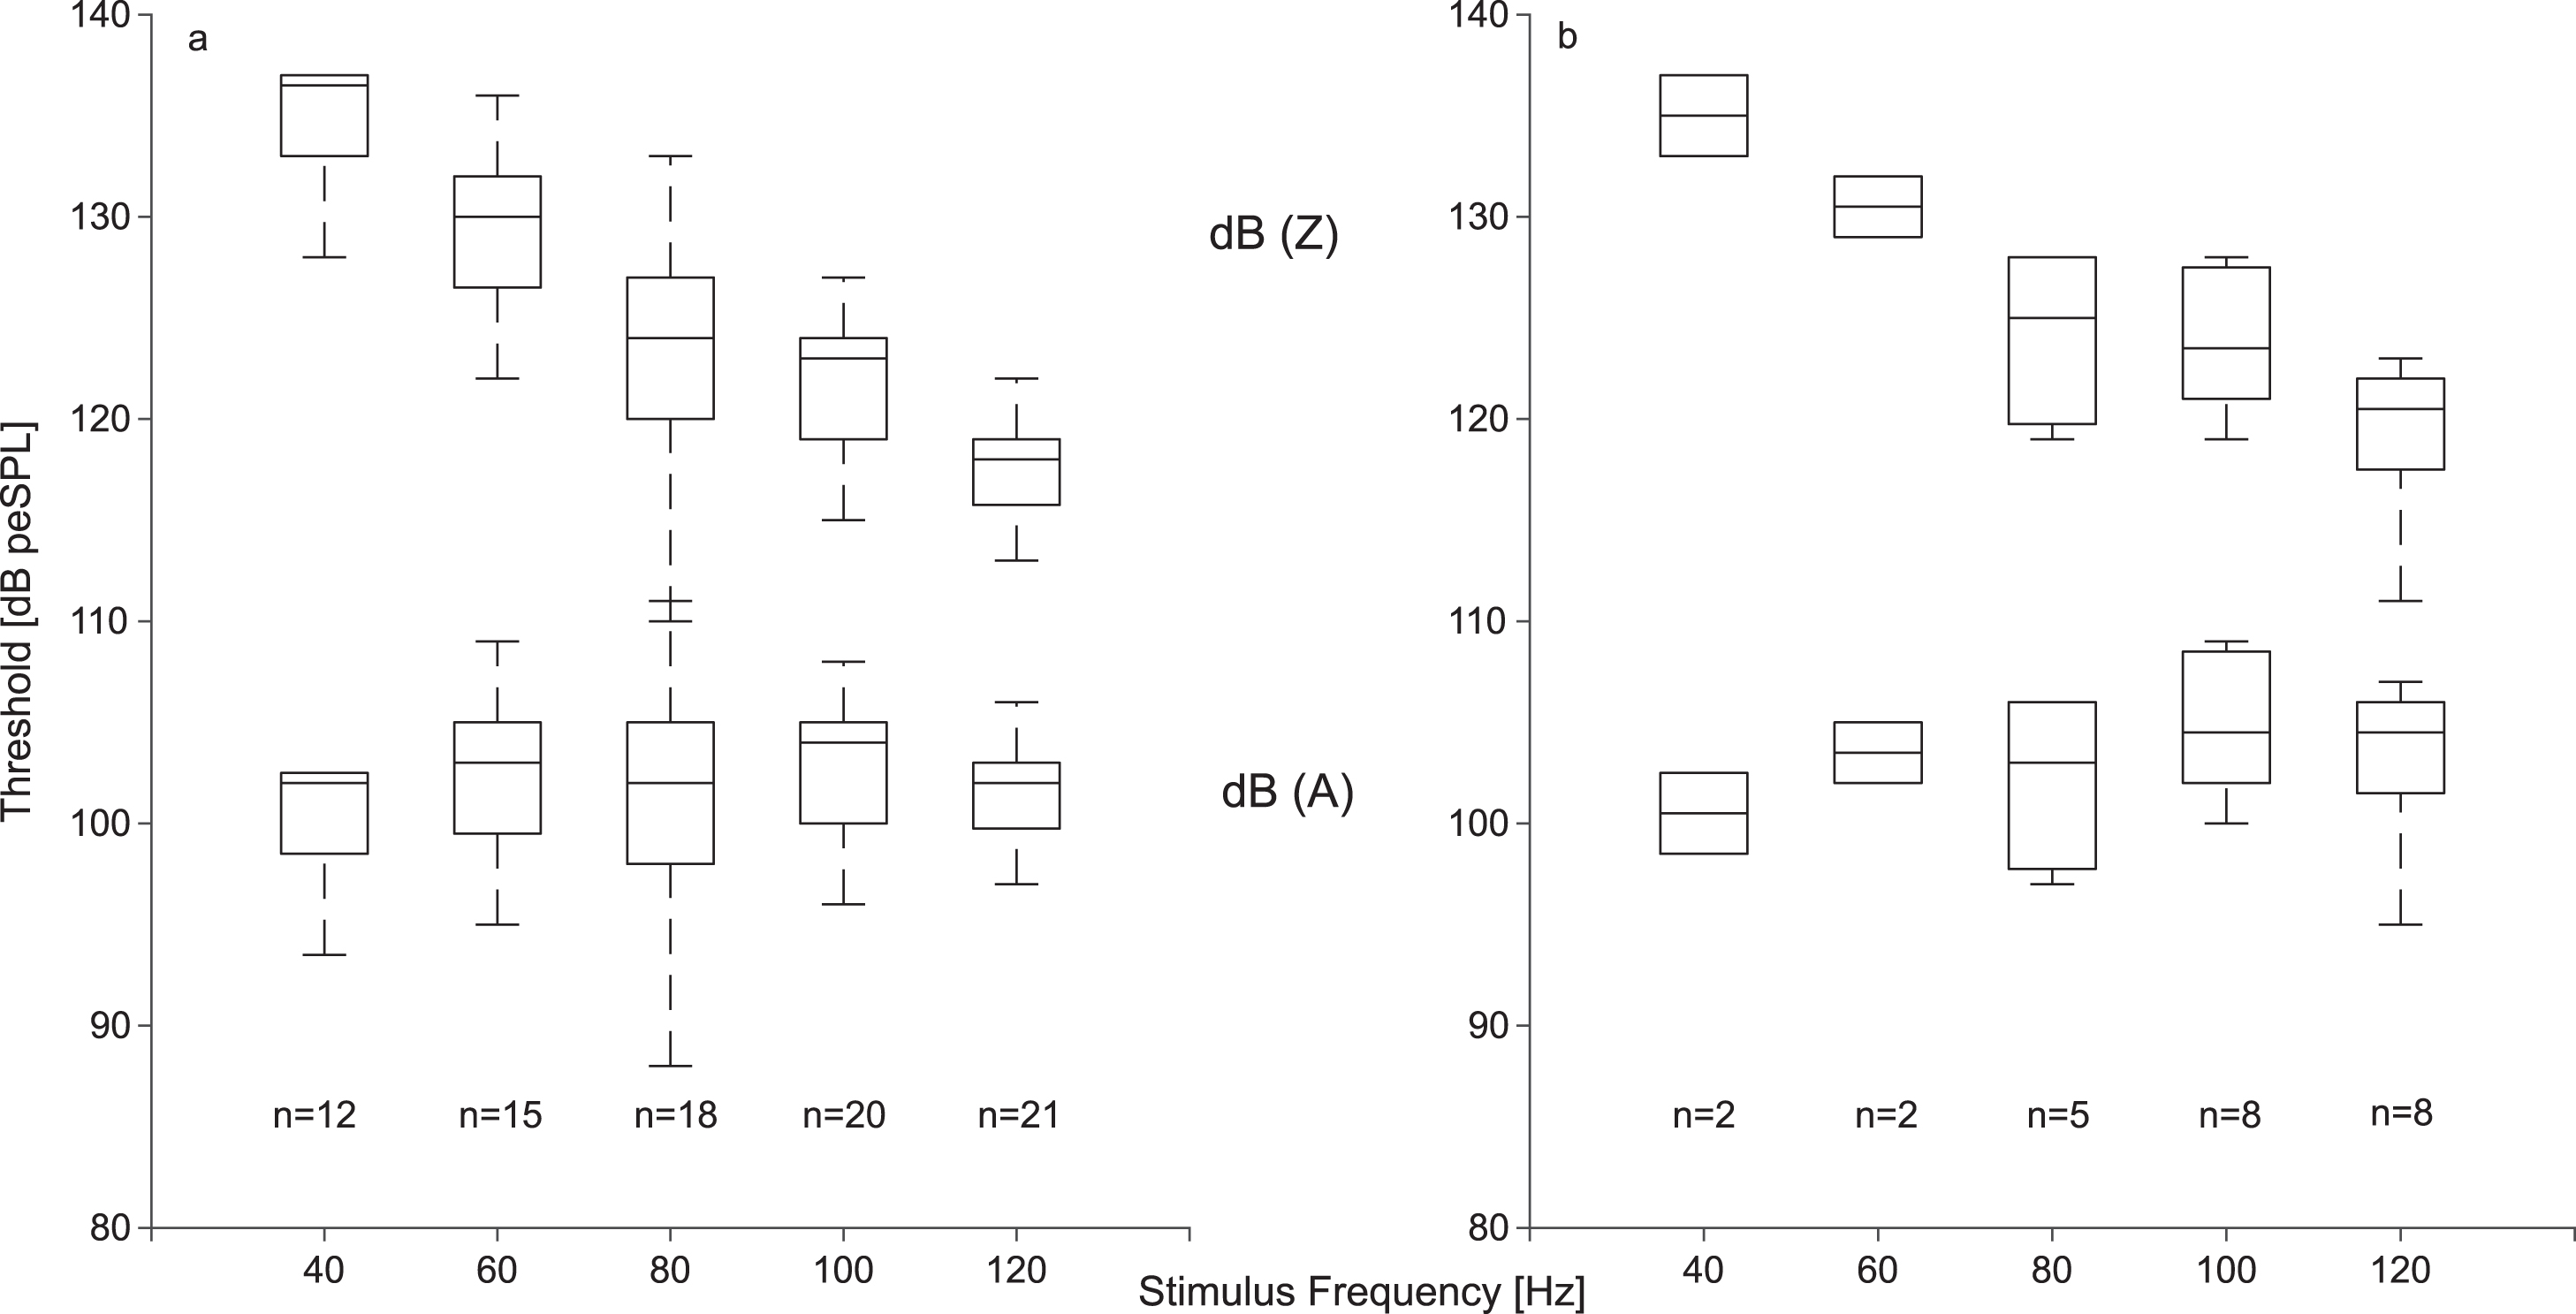
Thresholds of cVEMPs (a) and oVEMPS (b) evoked with stimulus frequencies between 40 and 120 Hz (upper boxplots, unweighted (dB (Z)) thresholds, lower boxplots: A-weighted (dB (A)) thresholds, n: number of thresholds). The median, the 25th, and 75th percentile are shown, whiskers represent the 5th and 95th percentile. Note that the oVEMP threshold curves are strongly biased downwards because the shown median values were calculated only from the most sensitive subjects who showed valid oVEMPs below the stimulation maximum.
In this study, VEMPs were evoked with stimuli consisting of one cycle and, as a consequence, increasing stimulus duration with decreasing frequency. Increasing latencies of both oVEMPs and cVEMPs (measured at and above threshold) have been observed with increasing period length (i.e. decreasing frequency), but only cVEMPs showed a significant relation between stimulus frequency and both latencies (n1: p < 0.001, df = 4, T = 70.09; p1: p < 0.001, df = 4, T = 67.12). Median p1 latencies (Fig. 3, left column) of cVEMPs evoked with a stimulus frequency of 120 Hz were 25 ms, and 32 ms for n1 latencies (Fig. 3, right column). At 40 Hz, latencies increased to 32 ms (p1) and 37 ms (n1).

cVEMP latencies of p1 (left column) and n1 (right column) as a function of stimulus level and frequency. Only latencies of waveforms evoked with stimulus levels at or above the threshold were included (which means that participants can contribute more than one data point, n = number of participants, m = total number of data points). Solid lines indicate the median latency across all levels, which increases with decreasing frequency. Dash-dotted lines represent median latencies corrected for the peak time of the stimulus. Note that with corrected latencies the frequency dependence is much weaker.
It has been shown previously in the literature that VEMP latencies depend on the rise time of the stimulus [4, 32]. As the stimuli employed in this study were Hanning-windowed, the time to the envelope peak increased with increasing period duration, resulting in longer rise times. To compensate for this, the time needed to reach the envelope peak was subtracted from the latencies. This reduced the frequency dependence of the latencies, suggesting that the peak time of the stimulus envelope (corresponding to the rise time of the trapezoidal envelopes typically used in clinical VEMP applications) contributes to VEMP latency (p1: p = 0.003, T = 25.84; n1: p = 0.004, df = 4, T = 15.55). It should be mentioned here that a decrease of cVEMP n1 latencies [24] and of oVEMP p1 latencies [50] was reported with decreasing frequencies, where stimulus rise/fall times were held constant.
The late positivities clustering around 40 ms are most likely cochlea-related potentials, as already discussed in one of the first publications reporting VEMPs [6]. These late responses can become the dominating positivity, and contribute as such to our latency analysis, as they fulfil our objective analysis criteria (since they occur within the 50 ms analysis window). The few randomly-distributed positivities originate from small, but significant waveforms with more complex shapes.
For oVEMP latencies, the relation is less clear, probably due to the smaller numbers of significant waveforms and the smaller signal-to-noise ratio (see Fig. 4).

oVEMP latencies of n1 (left column) and p1 (right column) as a function of stimulus level and frequency. Please see Fig. 3 for descriptions and labels.
To further test the aforementioned suggestions, we recorded cVEMPs evoked by one-period, 120 Hz stimuli, where the envelope was kept constant, and the carrier phase was varied between 0° and 360°. This resulted in significant (p = 0.0039, df = 8, T = 34.11), carrier phase-dependent, cyclic changes of VEMP amplitude (see Fig. 5b), with amplitude minima near 45° and 225°, and amplitude maxima near 180° and 315° While p1 latencies did not change significantly as a function of carrier phase (Fig. 5c, p = 0.51, df = 8, T = 7.21), n1 latencies did (fig. 5d, p < 0.001, df = 8, T = 38.32) and a clear phase jump can be seen between carrier phases of 135° and 180°. These n1 changes are mainly driven by complex wave morphology changes (see Fig. 5a for representative example).

cVEMPs evoked with a AC acoustic stimulus of 120 Hz as a function of carrier phase. a; examples of cVEMP waveforms at two different carrier phases, b: the amplitude RMS, and latency (c, d) of cVEMPs evoked with a series of 128 acoustic stimuli consisting of single, Hanning-windowed 120 Hz periods, as a function of carrier phase (N = 26). Black lines: median, grey lines: 25th and 75th percentile, respectively. To exclude effects of varying muscle tension and to make these supra-threshold recordings comparable among individual participants, VEMP amplitudes were expressed as a ratio of the tonic EMG before acoustic stimulus onset and are therefore dimensionless. Note that the resulting individual curves were normalised before averaging across subjects to give the individual curved shapes equal weights (see results).
Note that the functions of individual subjects were normalised before calculation the average function shape so that their morphology contributed equally. The normalisation consisted of two steps: To exclude effects of varying muscle tension on VEMP parameters [e.g. 1], each RMS value calculated within the 50 ms window after stimulus onset was normalised by the tonic EMG level before stimulus onset (calculated as the mean rectified EMG of the corresponding pre-stimulus recordings). Subsequently, the individual curves were scaled to a range between zero and one.
It has been known for several decades now that sound in the mid-frequency range of human hearing can stimulate the otolith organs of the vestibular system [6]. The lower frequency range, however, has received little attention in this context, despite its intuitively better suitability for evoking vestibular activity. With the emerging discussion revolving around wind turbines and other anthropogenic sources of LF sound and their potential effects on human health [e.g. 2], it seems important to assess the thresholds for vestibular organ activity evoked by LF sound as a first step. cVEMPs and oVEMPs, as a surrogate of otolith organ activity, can be evoked with frequencies as low as 40 Hz (this study), and there are also reports from other groups of VEMPs evoked with frequencies down to 50 Hz [24, 50]. The frequency range used here was restricted by technical limitations of our sound system, and it seems conceivable that VEMPs can be evoked with frequencies lower than that. Our most important finding relevant for public health is that the thresholds needed to evoke VEMPs are quite high at low frequencies, and the levels used in this study exceed by far what can be expected from anthropogenic LF sound sources such as wind turbines. This makes it unlikely that LF sounds present in our environment activate the otolith organs to an extent sufficient for evoking VEMPs. Having said that, it has been shown that loud dance music can evoke VEMPs [47].
In our measurements, median thresholds for LF sound evoked cVEMPs and oVEMPs, reflecting saccular and utricular activity, respectively, were similar. It should be noted here, however, that the number of significant waveforms contributing to the median oVEMP threshold was much lower than for the median cVEMP threshold, indicating that only the most sensitive subjects were included (due to exposure limitations preventing higher stimulus levels). The median threshold reported here might not reflect the additional, higher oVEMP thresholds that would have been obtained without the level limitations, suggesting that cVEMPs are more sensitive than oVEMPs. This conclusion is in agreement with animal studies revealing that neuronal thresholds of afferents from the saccule and the utricle, assessed with AC sound containing frequencies between 500 and 3000 Hz [15], differ, with the former being significantly lower. As an explanation, it has been proposed that saccular afferent thresholds are lower because of the more direct route of excitation from the oval window to the saccule [12]. Both unweighted cVEMP and oVEMP thresholds show a simple high-pass correlation, i.e. the higher the frequency of the acoustic stimulus, the lower the threshold. A-weighting, which serves here as a frequency-dependent approximation of attenuation by the middle ear transfer function [24, 50], eliminates this frequency dependence. This suggests that the VEMP frequency dependence we observed, at least in the narrow low-frequency range explored, is mainly due to the filter properties of the middle ear. S. Govender et al. [24] reported cVEMP amplitudes evoked with A-weighted supra-threshold stimuli as a function of frequency, and the frequency dependence they observed is comparable to our results, with the exception of measurements taken at 50 Hz, which were obtained with a lower sound pressure level at that particular frequency in their study because of overexposure limitations. In conclusion, their cVEMP amplitudes evoked with AC were also fairly frequency-independent in the range of 80–150 Hz. In another study [50], a similar relation was found when evoking oVEMPs, with no significant differences in the frequency range of about 80–200 Hz, but significantly lower oVEMP amplitudes at 50 Hz, again probably driven by the lower stimulus levels used at 50 Hz. This is in line with our data, where no significant frequency dependence could be seen in the narrow frequency range between 40 and 120 Hz. This might agree with the suggested two different modes of operations of the otolith organs at low and high stimulus frequencies [13, 26], where, at low stimulus frequencies, the presumably broadly tuned otolith membrane dominates the response.
There is good evidence in the literature that the vestibular irregular afferents innervating the striolar hair cells of the otolith organs phase-lock onto acoustic stimulation with frequencies of up to at least 1 kHz [11, 49]. This necessitates that hair bundle displacements follow the carrier of the acoustic stimulus, a feature which can only be achieved, at higher frequencies, by hair cells in the striolar region where hair bundles are only loosely, or not at all, in contact with the overlying otolithic membrane [see 10 for review]. The otolithic membrane acts as a low-pass filter and attenuates hair bundle displacement at higher frequencies. At low frequencies (lower than about 100 Hz) however, extrastriolar hair cells might also extract phase information. While it is unlikely that the phase information from acoustic stimuli as high as 1 kHz and above contributes to a derived measure such as VEMPs, it appears conceivable at low frequencies. There are indications that the VEMP waveform does depend on the stimulus carrier frequency and follows the stimulus carrier with decreasing frequency [48], almost resembling a full-wave rectification of the acoustic stimulus wave form. Only a few studies explored the relation between AC acoustic stimulus carrier phase and VEMP characteristics: S. Govender et al. [24] explored the effect of alternating the polarity of the acoustic stimulus and did not find any significant effects with AC sound. Changes of VEMP waveforms as a function of stimulus phase were reported, however, when BC sound was employed [25]. In the present paper, the carrier phase of acoustic stimuli was changed in 45° increments, and phase-related changes of both VEMP amplitude and latency were detected. The amplitude changes we observed are cyclic, and repeat within about half a period, i.e. VEMP amplitudes at phases separated by 180° are quite similar. In agreement, S. Govender et al. [24] also did not observe any effects on cVEMP amplitudes evoked with AC sound stimulation with frequencies between 50 and 1200 Hz with reversed stimulus polarity (i.e. a 180° phase shift).
While the ability of the vestibular system to detect acoustically –induced pressure waves in the inner ear can be regarded as a vestigial response with no apparent function, it could contribute to the annoyance some people feel in the vicinity of LF sound sources. The stimulation of the vestibular system by LF sound is weak and only detectable at rather high intensities; at lower intensities it might nevertheless modify the vestibular percept evoked by a regular vestibular stimulus.
Footnotes
Acknowledgments
This study was funded by a grant from the German Ministry of Science and Education to the German Center for Vertigo and Balance Disorders (01EO1401).
The authors would like to thank Prof. Dr. Benedikt Grothe and Prof. Dr. Lutz Wiegrebe for the opportunity to work and conduct experiments in their laboratories. Prof. Dr. Lutz Wiegrebe was also of great support during the development of the experimental set-up.