
Abstract
BACKGROUND:
Anxiety and depression are common in individuals with vestibular disorders and anecdotally symptoms of these disorders have been associated with poorer scores on subjective outcome measures of dizziness and balance. It is unknown if symptoms of psychological distress impact individual outcomes with vestibular rehabilitation therapy (VRT).
OBJECTIVE:
To compare subjective and objective outcome measures in subjects with vestibular disorders who have symptoms of anxiety and/or depression to those who do not exhibit those symptoms.
METHODS:
A retrospective chart review was performed at two outpatient vestibular rehabilitation clinics. Data recorded included demographics, scores on the Positive and Negative Affective Scale (PANAS), and subjective and objective outcome measures of balance and gait.
RESULTS:
The PANAS scale was utilized to group subjects (N = 118) into two groups: Subjects with abnormal affect (SAA) (18.6%; N = 22) and subjects with normal affect (SNA) (81.4%; N = 96). Both groups demonstrated a statistically significant improvement in all outcome measures (p < 0.001) from evaluation to discharge. SAA subjects took longer than SNA subjects to achieve goals (p < 0.05). SAA subjects tended to have poorer outcome measure scores at both initial and final assessment, but this was not statistically significant (p > 0.05).
CONCLUSIONS:
Results from this study indicate that VRT is effective in treating vestibular disorders in individuals with symptoms of psychological distress such as anxiety and depression. However, individuals with these symptoms may not achieve as high of outcomes as those that do not report symptoms of psychological distress.
Introduction
Dizziness ranks among the most common health complaints, affecting 15% –35% of the general population [18, 19]. Approximately 50% of patients who complain of dizziness have dysfunction in the vestibular system [22]. Some of the common causes of peripheral vertigo include vestibular neuritis or labyrinthitis, benign paroxysmal positional vertigo (BPPV), and Meniere’s disease [15]. Central vertigo is commonly caused by disorders such as migraines, cerebrovascular disease, brainstem lesions, and demyelinating diseases [17]. Symptoms of vestibular disorders may include vertigo, imbalance, oscillopsia, nausea, visual vertigo, and hearing loss or tinnitus. These symptoms can result in falls, fear of falling, anxiety, depression, activity restriction and disability that can cause a decrease in quality of life [15].
One effective way to mitigate the symptoms of vestibular disorders and to improve the quality of life in an individual with a vestibular disorder is through Vestibular Rehabilitation Therapy (VRT) [15]. VRT has been shown to be effective in the treatment of both peripheral and central vestibular disorders [7–9]. The goals of VRT include improving gaze stability, improving postural stability, decreasing symptoms of vertigo, and improving performance of activities of daily living [7]. VRT has also been shown to improve quality of life in individuals with vestibular dysfunction [25].
Outcome measures are used in VRT to determine both a level of disability as well as to track changes with body structure/function, activity, and participation levels of the International Classification of Function (ICF). Specifically for individuals with vestibular disorders, outcome measures are used to assess fall risk, assign a numeric value to subjective feelings of dizziness and imbalance, and track progress across all three areas of the ICF. Two sub-classifications of these measures are subjective and objective outcome measures. Subjective outcome measures aim to assess the patient’s perceived disability and quality of life while objective measures quantify patient performance on a specific task [3].
One factor which might impact outcome measure scores for individuals with vestibular disorders is comorbid symptoms of anxiety and/or depression. These symptoms are common in individuals with vestibular disorders. People who report symptoms of dizziness have a three times greater prevalence of self-reported anxiety or panic-related symptoms than among those who do not complain of dizziness [31]. More than 25% of patients with dizziness present with symptoms of panic and agoraphobia with a co-morbid prevalence of dizziness and anxiety of 11% [15]. Patients who experience dizziness also have a higher incidence of depression as compared to the general population [5]. Additionally, more than half of subjects who reported anxiety also reported dizziness, with evidence to suggest that the symptoms may be triggered by a primary psychogenic disorder or a primary vestibular disorder [15]. This connection between vertiginous symptoms and symptoms of anxiety and/or depression has led to a poorer prognosis, especially for older adults [10].
Anecdotally it is thought that patients with symptoms of anxiety and/or depression make less progress and require a longer length and number of treatment sessions in VRT as compared to patients without these symptoms. It has been observed that patients with symptoms of anxiety and/or depression may improve on objective outcome measures but do not report as robust of improvements on subjective measures.
There is no known literature specifically quantifying the differences on outcome measures for individuals with vestibular disorders who exhibit symptoms of anxiety and/or depression with those who do not exhibit these symptoms. Furthermore, there is no literature that compares score improvement on subjective and objective outcome measures between these groups. The purpose of this study is to 1) determine if VRT improves scores on subjective and objective outcome measures in subjects who report abnormal affect 2) compare subjective and objective outcome measure achievement in subjects with vestibular disorders who report abnormal affect and those subjects with vestibular disorders who report normal affect and 3) determine if individuals with vestibular disorders who report abnormal affect require more visits and a longer length of care compared to individuals who report normal affect.
Methods
Study design
The study was designed as a retrospective chart review and was approved by Louisiana State University Health Sciences Center Institutional Review Board. The medical record systems of LSUHSC-New Orleans Outpatient Physical Therapy Faculty Clinic in New Orleans, LA and the Hearing and Balance Center at Our Lady of the Lake Regional Medical Center in Baton Rouge, LA were utilized for this study.
Participants
A convenience sample (N = 118) was taken from the patients of two Physical Therapists (PTs) who specialize in VRT and are employed at the above-mentioned clinics. All potential subjects were referred to VRT between January 2011 and August 1, 2014. Subjects met the inclusion criteria for diagnosis if they were diagnosed with a specific vestibular disorder by a physician. 154 individuals were excluded due to either premature discharge from VRT or if the individual did not complete VRT. Premature discharge was defined as discontinuing VRT prior to goal achievement as decided by the patient, PT, or physician.
Included charts were reviewed for diagnosis, demographic data, and subjective and objective outcome measures scores. The following information was recorded: subject identification, diagnosis, age, sex, ethnicity, Positive and Negative Affect scale (PANAS) scores, Dynamic Gait Index (DGI) score, Functional Gait Assessment (FGA) score, Activities Specific Balance Confidence Scale (ABC) score, Dizziness Handicap Inventory (DHI) score, gait speed (GS) in meters/second, length of VRT in weeks, number of VRT sessions, and time since onset of disorder in weeks. DGI, FGA, ABC, DHI, and GS values were recorded at two time points: initial evaluation and at discharge.
Rehabilitation program
All subjects completed an individualized VRT program specific to their diagnosis, impairments, and limitations in activity as determined by the evaluating PT. The length of VRT depended on the severity of the disorder, but typically each subject was seen one time per week or every other week for multiple weeks or months. During VRT sessions, the subjects performed activities that were designed to decrease dizziness, improve gait and balance abilities, improve gaze stability, and increase overall function and independence. These activities included but were not limited to gait training, balance activities, oculomotor exercises, and vestibular ocular reflex exercises. Subjects were also given an individualized home exercise program that they were instructed to perform at home on a daily basis multiple times per day.
Outcome measures
The PANAS was used in this study to operationally categorize the subjects into two groups: 1) subjects with abnormal affect (SAA) and 2) subjects with normal affect (SNA) [26]. This scale was developed in 1988 by Watson et al. as a concise way to identify the different dimensions of mood and affect [26]. The developers of the PANAS use a two-factor model to define affect, consisting of positive affect (PA) and negative affect (NA). These two mood factors, NA and PA, can be measured as state dimensions (how does someone feel currently) or as trait dimensions (how does someone feel in general). The instructions used in this study were designed to capture trait symptoms by asking the subject to indicate “to what extent you generally feel this way, that is, how do you feel on the average” [26]. Tellegen has suggested that abnormal affect (low PA and high NA) are factors in anxiety and depression [24]. Though not diagnostic of anxiety and/or depression, the PANAS has been shown to be an effective measure of psychological distress [24]. Anxiety may be represented by high NA and depression may be associated with low PA and high NA [24].
Subjects were identified as abnormal affect (SAA) if their NA score was greater than 29.9 and/or their PA score was less than 22 [26]. These cutoff scores were based on two standard deviations (SD) from the mean for the instructions “in general, that is, on the average”. The average PA score for a sample of normal adults is 35 (SD±6.4), whereas the average NA score in is 18.1 (SD±5.9) [26]. Subjects who scored greater than 29.9 on the NA, or who scored 22 or less on the PA, were 2 standard deviations away from the mean, and were characterized as having abnormal affect. The PANAS intercorrelations and internal consistency reliabilities were calculated using Cronbach’s α. The reliabilities are relatively high, ranging from 0.86–0.90 for PA and 0.84–0.87 for NA [26]. The PANAS has been used in a variety of populations, including patients with vestibular disorders [1].
Two objective outcome measures for dynamic balance were utilized in this study, the DGI and FGA. These were both created to assess the ability of an individual to modify their balance in the presence of external demands [23]. The DGI was used for lower functioning subjects, and the FGA, which is more challenging, was used in higher functioning subjects. The DGI is an 8 item walking test that has a maximum score of 24 and a fall risk cutoff of 19 or less for individuals with vestibular disorders [27]. It has excellent test-retest reliability (ICC = 0.86) for individuals with vestibular dysfunction [6]. The FGA is a 10 item walking assessment that was originally created to limit the ceiling effects of the DGI and has a fall risk cut off of <22/30 in older adults [29, 30]. Interrater and intrarater reliability are excellent when used with individuals with vestibular dysfunction: ICC = 0.84 and ICC = 0.83 respectively [29]. Internal consistency was determined to be 0.79 in the same population [30].
Gait speed (GS) was measured using the first item of the DGI and the FGA, which instructs the individual to walk at a normal pace for 6 meters. GS was measured over one trial, and the PTs allowed a five foot acceleration and deceleration distance. Though the 10 Meter Walk Test is the distance most researched for gait speed measurement, other distances can be used as long as there is an allowance for acceleration and deceleration [4].
Two subjective outcome measures were administered to the subjects: the Activities-Specific Balance Confidence Scale (ABC) and Dizziness Handicap Inventory (DHI). The ABC is used to measure self-perceived balance abilities while performing home and community activities [21]. Subjects rate their level of confidence using a 0–100 scale on 16 items that range in difficulty from reaching at eye level to bending over or walking in a crowded mall [21]. An average score of <67% indicates increased risk of falling in older adults [13]. The ABC scale has been tested on subjects with vestibular disorders, though some of the psychometric properties are not specific to this population [14]. Test-retest reliability was found to be 0.92 over a two week period in the general elderly population [21]. The internal consistency is excellent in older adults: α= 0.96 [11].
The DHI was created in order to evaluate the self-perceived handicap that dizziness induces on everyday life [11]. Subjects respond “yes”, “no”, or “sometimes” to 25 questions to identify the amount of perceived disability caused by their dizziness. A higher score on the questionnaire suggests increased perceived disability with a score of 0–30 considered mild, 31–60 moderate, and 61–100 severe [12]. The test-retest reliability was shown by Jacobson and Newman to be ICC = 0.97 and internal consistency was Cronbach’s α= 0.89 [12].
Statistical analysis
A split-plot mixed analysis of variance was used to compare differences in the DGI, FGA, ABC, DHI, and GS across the two different groups (SNA and SAA). Test-retest reliability statistics were performed on the DHI and ABC, and internal consistency was assessed via Cronbach’s α for the ABC, DHI, and PANAS positive and negative affect subscales. The SPSS statistical package (version 21; SPSS, Inc., Chicago, IL) was used for the analysis.
Results
Of the 272 charts reviewed for potential subjects, 118 matched the inclusion criteria and were used as part of the study. Descriptive mean information concerning age, sex, ethnicity, diagnosis, length of therapy, number of sessions, and time of onset is included in Tables 1 and 2. As shown in these tables, the information from the 118 subjects was varied, but with a majority of the sample consisting of Caucasian females with a peripheral diagnosis who reported normal affect. See Tables 1–3. There were 22 subjects (18.6%) in the SAA group and 96 subjects (81.4%) in the SNA group. Females represented a significant majority of the SAA group. See Table 3.
Population descriptive characteristics (N = 118)
Population descriptive characteristics (N = 118)
Percentages of population characteristics of sex, ethnicity, and diagnosis (N = 118)
Prevalence of abnormal affect by gender and diagnosis (N = 118)
*1 subject had a diagnosis of both peripheral and central.
The psychometrics for the PANAS positive affect subscale and the negative affect subscale were assessed via Cronbach’s α. The PANAS positive affect subscale had a Cronbach’s α of 0.89, and the negative affect subscale had a Cronbach’s α of 0.93, which is similar to published statistics [26]. The psychometrics for the DHI and ABC were also assessed via Cronbach’s α and test-retest reliability. Cronbach’s α for DHI pretest is 0.91 and for the posttest is 0.90, which is comparable to the literature [12]. Cronbach’s α for ABC pretest is 0.96 and for the posttest is 0.95, which is also similar to published statistics [11]. Test-retest reliability for the DHI was r = 0.60. Test-retest reliability for the ABC was r = 0.68. Both test-retest reliabilities are low compared to the literature [12, 21].
There was a statistically significant improvement from beginning to end of rehabilitation within the SAA and SNA groups for all outcome measures (DGI, FGA, gait speed, DHI, and ABC: p < 0.001). See Tables 4 and 5. However, the rate of change between the two groups was not significant. The SAA group scored lower on objective measures (DHI, FGA, and gait speed) both at initial evaluation and at discharge than did their normal affect peers, though this difference was not significant (p > 0.05). Similarly, the subjects with abnormal affect rated themselves with an increased perception of handicap per the DHI and lower balance confidence per the ABC, both at initial and final assessments, than the subjects with normal affect, though this difference was also not significant (p > 0.05).
Within-subjects analytical statistics of outcome measures
*p < 0.001.
Pre/post means and Standard Deviation (SD) for outcome measures
Pre-post for all within-subjects p < 0.001.
For the SAA group, the mean DGI score on the initial evaluation was lower on average (8.69) as compared to the SNA group (15.70). See Fig. 1. Both groups exceeded the minimal detectible change (MDC) of 3.2 points, showing significant improvement from pre to post VRT [6]. The mean final score of the SAA subjects was 16.87, which remained below the fall risk cut off of 19/24. However, the SNA group did exceed this cut off score with a final mean of 20.20. See Table 5.
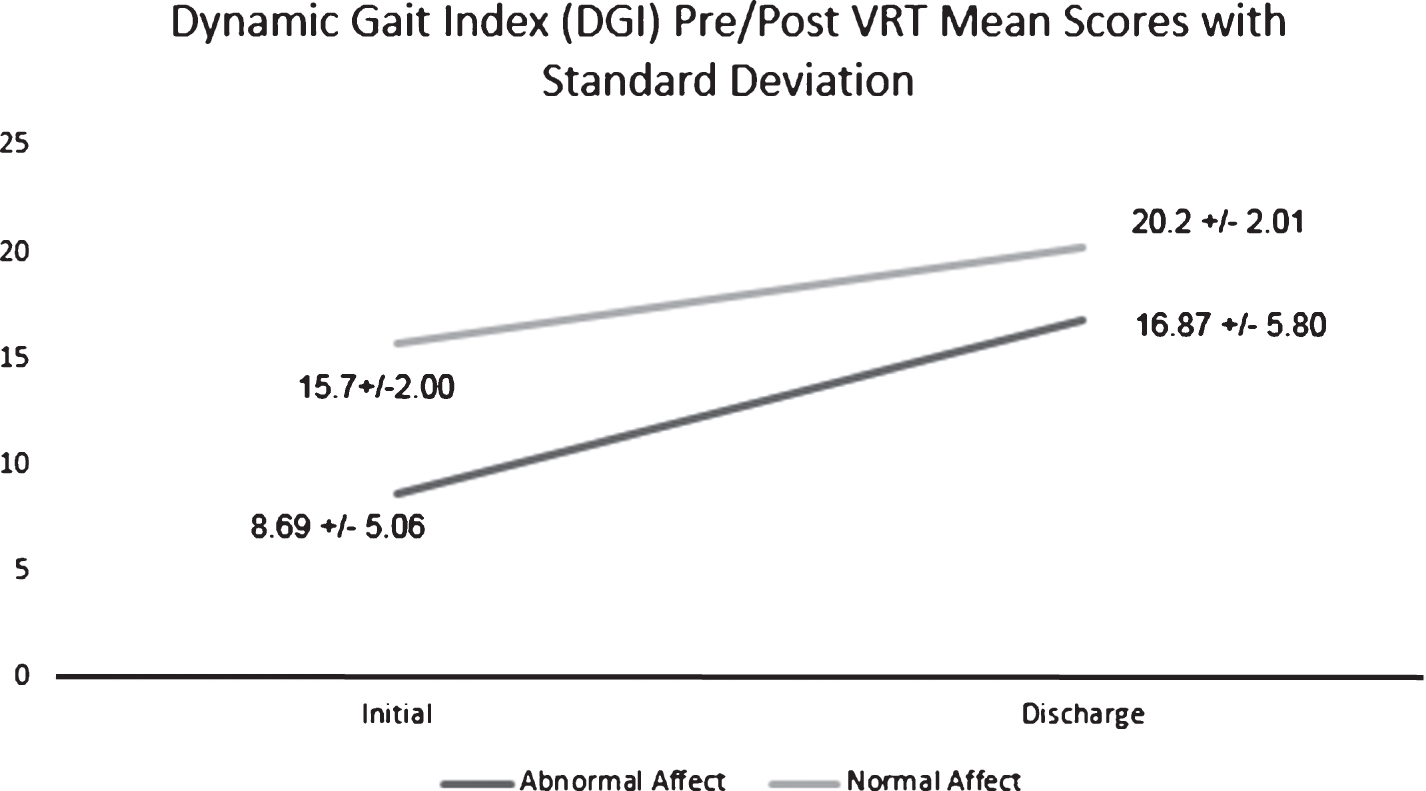
Dynamic Gait Index (DGI) pre and post scores. Values are mean±SD. Significant change from pre to post within-groups (p < 0.001). There was not a significant difference between-groups (p > 0.05).
A similar trend was noted with the results of the FGA, as demonstrated in Fig. 2. Both groups exceeded the fall risk cut off of 22/30 at discharge, but neither group achieved the MDC of 6 points. The SAA group had lower initial and final scores than the SNA group.
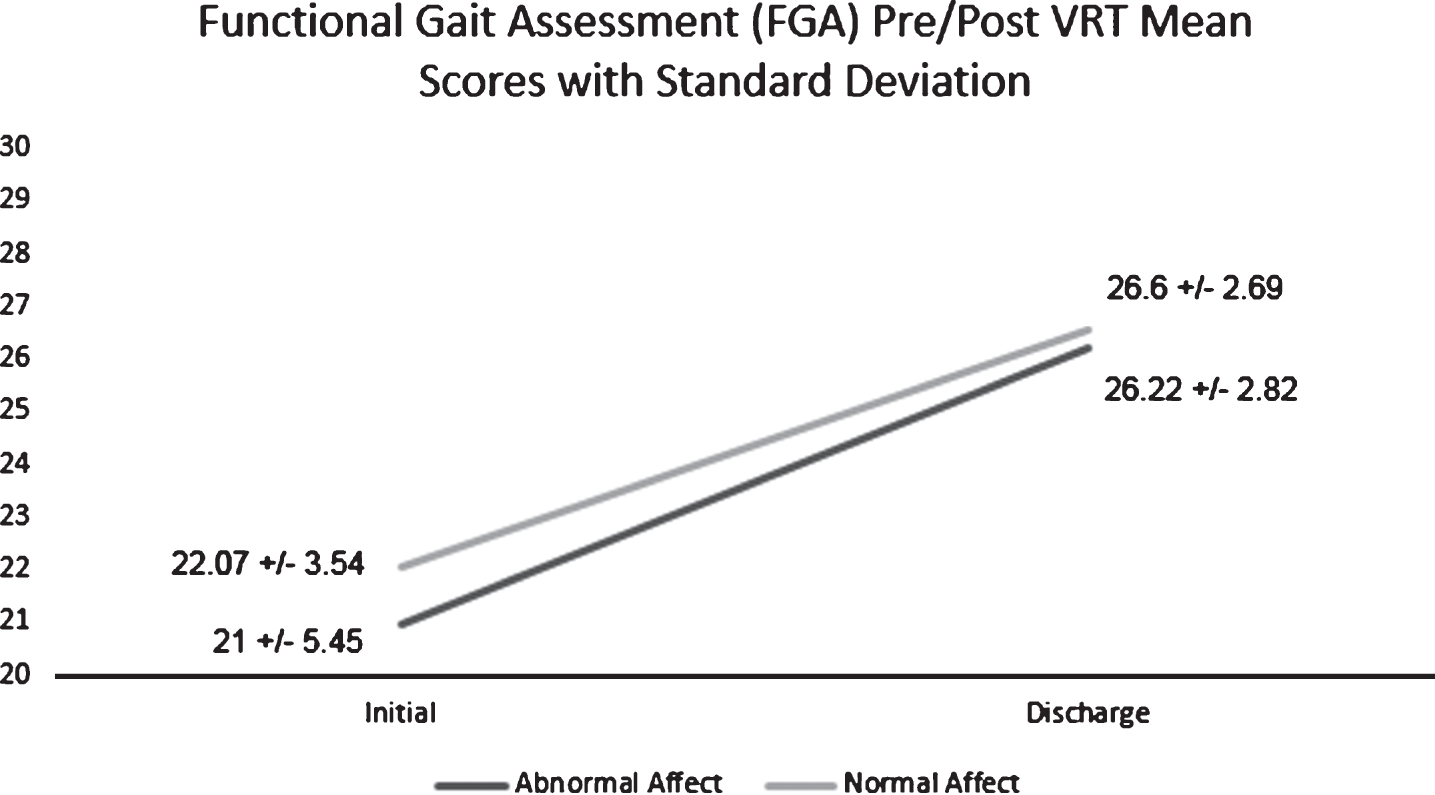
Functional Gait Assessment (FGA) pre and post scores. Values are mean±SD. Significant change from pre to post within-groups (p < 0.001). There was not a significant difference between-groups (p > 0.05).
In regards to GS, the SAA group had a lower initial and final speeds compared to the SNA group. See Fig. 3. The results showed that both the SAA and the SNA groups improved their mean scores significantly; however, only the SAA group improved their score higher than the geriatric minimal clinically important difference (MCID) of 0.1200 m/s. See Table 5 [20]. It is important to note that gait speed is an objective measurement that is not only affected by a medical disorder but is also greatly impacted by age, sex, height, and lower extremity muscular strength [2]. Also, as there are no norms for GS in the vestibular population, the MCID for the geriatric population was used.

Gait Speed pre and post scores. Values are mean±SD. Significant change from pre to post within-groups (p < 0.001). There was not a significant difference between-groups (p > 0.05).
Per the ABC, the SAA group had a lower initial rating of their balance confidence (44.4%) as compared to the SNA group (64.46%). The mean of both groups suggested that the subjects were at increased fall risk (<67%) prior to VRT [13]. At discharge, the SNA group had exceeded the fall risk cut off with a mean of 80.56% while the SAA group remained below that threshold with a mean of 63.16%. See Fig. 4.
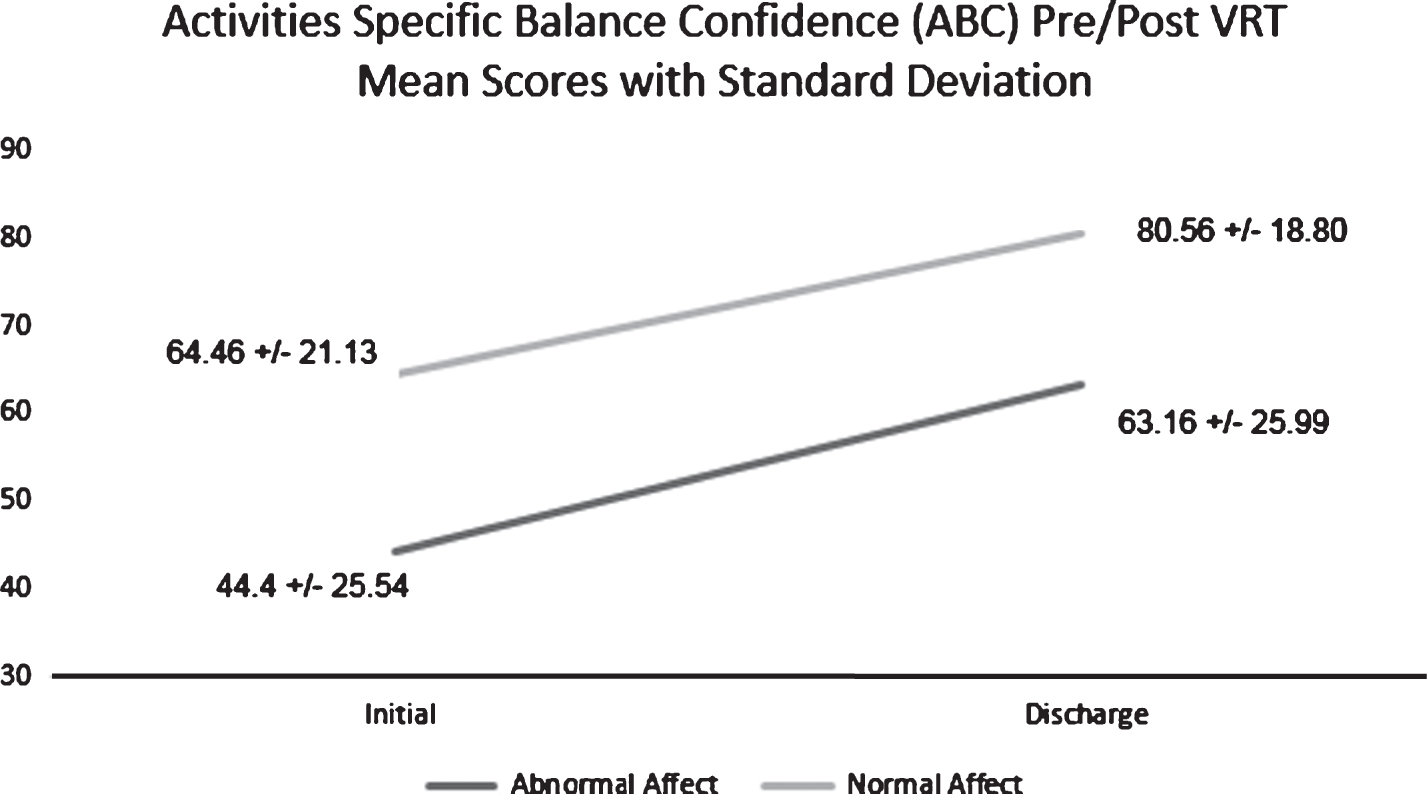
Activities Specific Balance Confidence Scale (ABC) pre and post scores. Values are mean±SD. Significant change from pre to post within-groups (p < 0.001). There was not a significant difference between-groups (p > 0.05).
For the DHI, there was a similar, but inverse trend, as a lower score from this outcome measure is indicative of less disability. The SAA group reported scores consistent with severe perception of handicap initially and a moderate perception of handicap at discharge. The SNA group reported scores consistent with a moderate perception of handicap initially and a mild perception of handicap at discharge [28]. The SAA group had an improvement of 16.11 points, while the SNA group improved by an average of 17.49 points. This difference was clinically significant for the SNA, surpassing the MDC of 17.18 [12]. See Fig. 5.

Dizziness Handicap Inventory (DHI) pre and post scores. Values are mean±SD. Significant change from pre to post within-groups (p < 0.001). There was not a significant difference between-groups (p > 0.05).
There was not a statistically significant difference between the SNA and SAA groups when comparing number of therapy sessions; however, there was a statistically significant difference between the groups when comparing length of therapy (p < 0.05). The SNA group had a mean number of 5.35 (SD±2.85) sessions of while the SAA group required an average of 5.81 sessions (SD±2.66). The SNA group had a mean length of therapy of 8.15 (SD±4.69) weeks while the SAA group required 10.52 weeks (SD±5.02).
Normality and independence were met for all outcome measures: pre and post (p > 0.05). Homogeneity of Variances was not met for the DGI and post DHI (p < 0.05) but was met for all other outcome measures (pre and post). Table 5 outlines the pre and post means and standard deviations of the outcome measures.
These results show that VRT improves both subjective and objective outcomes in individuals with vestibular disorders, even in subjects who report abnormal affect. The results from our study showed a statistically significant difference between pre and post assessments for each of the outcome measures analyzed within both groups. However, there was not a statistically significant difference between the SAA and SNA groups, as was hypothesized.
In this sample, the SAA group tended to score higher initially on the DHI and also tended to score lower on the ABC, DGI, FGA, and gait speed compared to the SNA group. This demonstrates a trend towards a higher perception of handicap, lower balance confidence, and poorer performance on objective outcome measures in subjects with report of abnormal affect at onset of VRT. While this finding was not significant, it is an interesting area for future research. It is unknown if this finding would be significant with a larger sample size and if patients with psychological distress would have improved outcomes in therapy with common treatments for anxiety/depression such as medication and/or counseling.
The results question the observation that patients with vestibular disorders who report abnormal affect improve more on objective outcome measures than on subjective measures. The researchers hypothesized that these individuals would not recognize their objective improvements due to their psychological distress, leading to limited subjective improvements. However, these results show that both the SAA and SNA groups improved significantly on their subjective scores and objective scores. The improvement on both objective and subjective measures in the SAA group could be due to the effectiveness of the individualized VRT program on helping the patient cope with their vestibular dysfunction. This individualization allowed the PT to customize the exercises and pace of VRT to successfully accommodate their reported psychological distress. These results are supported by published literature which indicates that personalized VRT is superior to a generic form of exercise for patients with vestibular disorders [16].
This study shows that the calculated internal consistencies of the PANAS, DHI and ABC are comparable to the internal consistencies of these outcome measures found in previously published studies [11, 24]. The test-retest reliabilities of the ABC and DHI were found to be lower than that of previously published studies [11, 12]. This discrepancy could be due to the fact that the researchers were not able to maintain standard time frames according to each outcome measure since VRT time frames vary for each specific subject case. The length of time between pre and post assessment depends on factors such as the severity of the case and the consistency of subject attendance.
An important clinical note from these findings is that the SAA group spent more time in VRT than the SNA group, but there was no statistically significant difference in number of sessions. If the patient is perceived as slower in mastery of their VRT exercises, the length between sessions is increased. Thus based on these results, symptoms of psychological distress may lead to a slower progression of VRT program. These results suggest that for subjects who report abnormal affect may require a longer duration of therapy, though this finding needs to be further examined.
Despite the trend for poorer initial and final scores in the SAA group, the lack of a significant difference between the two groups did not support the initial hypothesis. One possible explanation for this is that 154 individuals were excluded for not meeting the inclusion criteria, which limited the scope of our study. A majority of the excluded charts did not meet inclusion criteria because the patients self-discharged. It was undetermined in this study if subjects who reported psychological distress self-discharged from PT at a higher rate than their non-distressed peers. If patients who report abnormal affect are less likely to complete therapy, then perhaps interventions such as counseling or medication could increase their ability to participate in therapy, and thus their overall symptom improvement. This is an area that would need further investigation.
It is important to note that the PANAS scale is not a clinical diagnostic tool, and is not a direct measure of anxiety and depression, but rather a method to identify general mood states associated with low PA (sadness, lethargy) and high NA (distress, anger, contempt, disgust, guilt, fear, and nervousness) [26]. Future research could include a more formal diagnostic process by the appropriate clinicians (psychology/psychiatry) to identify those subjects with anxiety and/or depression. The PANAS was utilized because it is a quick general screen of PA and NA that is easily utilized within the confines of a physical therapy session and could be easily used in settings in which access to psychological services are limited [26].
In conclusion, the results of this study indicate that individuals with and without psychological distress can make statistically and clinically significant improvement in subjective and objective outcome measures with customized VRT. These gains lead to decreased dizziness, decreased fall risk, and improved quality of life. Further research is warranted to investigate if there are strategies to improve adherence and overall improvement for patients who report abnormal affect.