
Abstract
BACKGROUND/OBJECTIVE:
Few studies have suggested a relationship between vestibular system and sleep deprivation. The aim of the present study is to investigate the effects of acute sleep deprivation lasting 24 hours or more on the postural balance and the visual abilities related to the vestibular system in healthy young adults.
METHODS:
Thirty-one healthy young adults (8 males, 23 female; ages 18– 36 years) who had experienced at least 24 hours of sleep deprivation were included in the study. Subjects made two visits to the test laboratory. One visit was scheduled during a sleep deprivation (SD) condition, and the other was scheduled during a daily life (DL) condition. Five tests— the Sensory Organization Test (SOT), Static Visual Acuity Test (SVA), Minimum Perception Time Test (mPT), Dynamic Visual Acuity Test (DVA), and Gaze Stabilization Test (GST)— were performed using a Computerized Dynamic Posturography System.
RESULTS:
A statistically significant difference was found between SD and DL measurements in somatosensorial (p = 0.003), visual (p = 0.037), vestibular (p = 0.008) ratios, and composite scores (p = 0.001) in SOT. The mPT results showed a statistically significant difference between SD and DL conditions (p = 0.001). No significant difference was found between SD and DL conditions in the comparison of the mean SVA (p = 0.466), DVA (p = 0.192), and GST head velocity values (p = 0.160).
CONCLUSIONS:
Sleep deprivation has a considerable impact on the vestibular system and visual perception time in young adults. Increased risk of accidents and performance loss after SD were thought to be due to the postural control and visual processing parameters rather than dynamic visual parameters of the vestibular system.
Introduction
Sleep is a behavioral condition characterized by reduced motor activity and increased excitation threshold. It is repeated periodically in humans over a period of 24 hours [40]. Like nutrition, sleep serves a vital function in humans. The conservation of sleep across all animal species is an important indicator of this necessity [50]. Sleep functions include important tasks such as improvement of cellular and endocrine system levels, energy conservation, ecological adaptation, learning and synaptic plasticity [35]. It has been estimated that 20% of adults have inadequate sleep [12, 17].
Sleep deprivation negatively affects learning, cognitive performance, and reaction time, while it increases the risk of accidents related to human error [12, 50]. Sleep deprivation increases the tendency to sleep during the day, causes an imbalance in awake behavioral functions, and causes cognitive performance to deteriorate; therefore, it is associated with social, financial, and health-related costs [17]. In the literature, sleep reduction was defined as sleeping less than the normal length of time due to either sleeping late or getting up earlier than normal, whereas total sleep loss or sleep deprivation is defined as not sleeping at all during the night [5].
The balance system is the most important sensory system associated with bodily movement [4]. The visual image perceived during displacement or rapid head movements tends to shift continuously. Similarly, when a person is moving around an object or the whole image is moving when the person is stationary, the person encounters complex visual stimuli, which is combined to create safe mobilization [24]. The vestibular, visual, and somatosensory inputs combine with a person’s neuromuscular system to maintain balance in the human body[45]. Previous studies have reported that body sway increases after sleep deprivation and causes impaired postural balance [1, 44]. Another study concluded that 30% of the patients with vestibular vertigo also had abnormal sleep periods [2]. Sleep deprivation is thought to affect the mechanism of the vestibulo-ocular reflex (VOR) [31, 38]; this condition affects only the latency of saccade and the smooth pursuit gains, not the accuracy of the saccades [7]. Zils et al. also stated that saccadic velocity is impaired in all types of saccades after sleep deprivation [51].
Visual processing skills are also affected by sleep deprivation. The human vision system processes visual information quickly and allows us to recognize even a single flashing object that appears for 20 milliseconds [9]. After sleep deprivation, studies have reported that many important visual functions (e.g., processing of rapidly changing visual information, visual selectivity, suppression of distracting visual information, and visual short-term memory) are affected negatively [9, 29]. Visual acuity is the ability to visually distinguish small differences. Dynamic visual acuity is the ability to distinguish between the three following situations: (1) a moving image when the head is stationary, (2) an image that remains stationary while the head is moving, (3) the visual differences that occur when both the head and the image are moving. There is no change in static visual acuity values in vestibular system disorders; in contrast, dynamic visual acuity decreases during the head movement towards the pathology side due to the loss of VOR function [19–21].
Although there are many studies in the literature about changes in body systems after sleep deprivation, to best of our knowledge, there are few studies showing the effect of acute sleep deprivation on the vestibular system and the visual processing mechanism. The aim of the present study was to investigate the effects of acute sleep deprivation lasting 24 hours or more on the postural balance and the visual abilities related to the vestibular system in healthy young adults.
Methods
Subjects
Thirty-one healthy, young adults (8 males, 23 female; ages 18– 36 years) who had experienced at least 24 hours of sleep deprivation were included in the study. Demographics of the subjects are given in Table 1. The content and purpose of the study were explained to the subjects, and their written consent was obtained. Subjects with a body mass index (BMI) of less than 30 and who experienced a regular sleep cycle in their daily lives were included in the study. No subjects reported having any significant daytime sleepiness according to the Epworth Sleepiness Scale (ESS) [25]. Healthy young adults were defined from a sleep stand point by self-report. None of the subjects have had pre-existing sleep disorders. None of the participants screened for other sleep disorders.
Demograhics of the subjects
Demograhics of the subjects
X: mean value; SD: standart deviation; min: minimum value; max: maximum value; BMI: body mass index.
All subjects were instructed to not take any caffeinated drinks during the preceding night. Subjects with a history of long-term medications, cervical problems, hearing loss, various disorders (e.g., postural, vestibular, sleep, psychiatric, and neurological), and visual disorders that could not be corrected with visual aids were excluded from the study. Females who were experiencing their menstrual periods at the time of the tests were also excluded.
Subjects made two visits to the test laboratory. One visit was scheduled during a sleep deprivation (SD) condition (i.e., acute total sleep deprivation longer than 24 hours), and the other was scheduled during a daily life (DL) condition (i.e., a sleep cycle longer than 7 to 9 hours). The first visit was scheduled in the SD condition for 15 subjects and in the DL condition for 16 subjects. The second visit was set in the alternate condition from the first for each group of subjects. Subjects were randomly selected. The period between the two visits was planned to be at least 15 days in order to minimize the learning effect of the tests.
All subjects reported sleep information in three-day sleep diaries before both test days. Sleep diary included sleep duration items, such as bedtime, waking time, duration of night sleep and subjective sleep latency. On the day before sleep deprivation conditon, participants were asked to wake up between 7.00– 8.00 and to be in the clinic at 8.00 after 24 hours of sleep deprivation. In daily life conditon participants were asked to wake up at 7-00 and to be in the clinic at 8.00. In both conditions, the tests were completed between 8.00– 11.00 in order to prevent the effect of the circadian rhythm.
Five tests— the Sensory Organization Test (SOT), Static Visual Acuity Test (SVA), Minimum Perception Time Test (mPT), Dynamic Visual Acuity Test (DVA), and Gaze Stabilization Test (GST)— were performed using a Computerized Dynamic Posturography (CDP) System (NeuroCom International, Inc. Clackamas, OR, USA). Computerized Dynamic Posturography setup is given in Fig. 1.
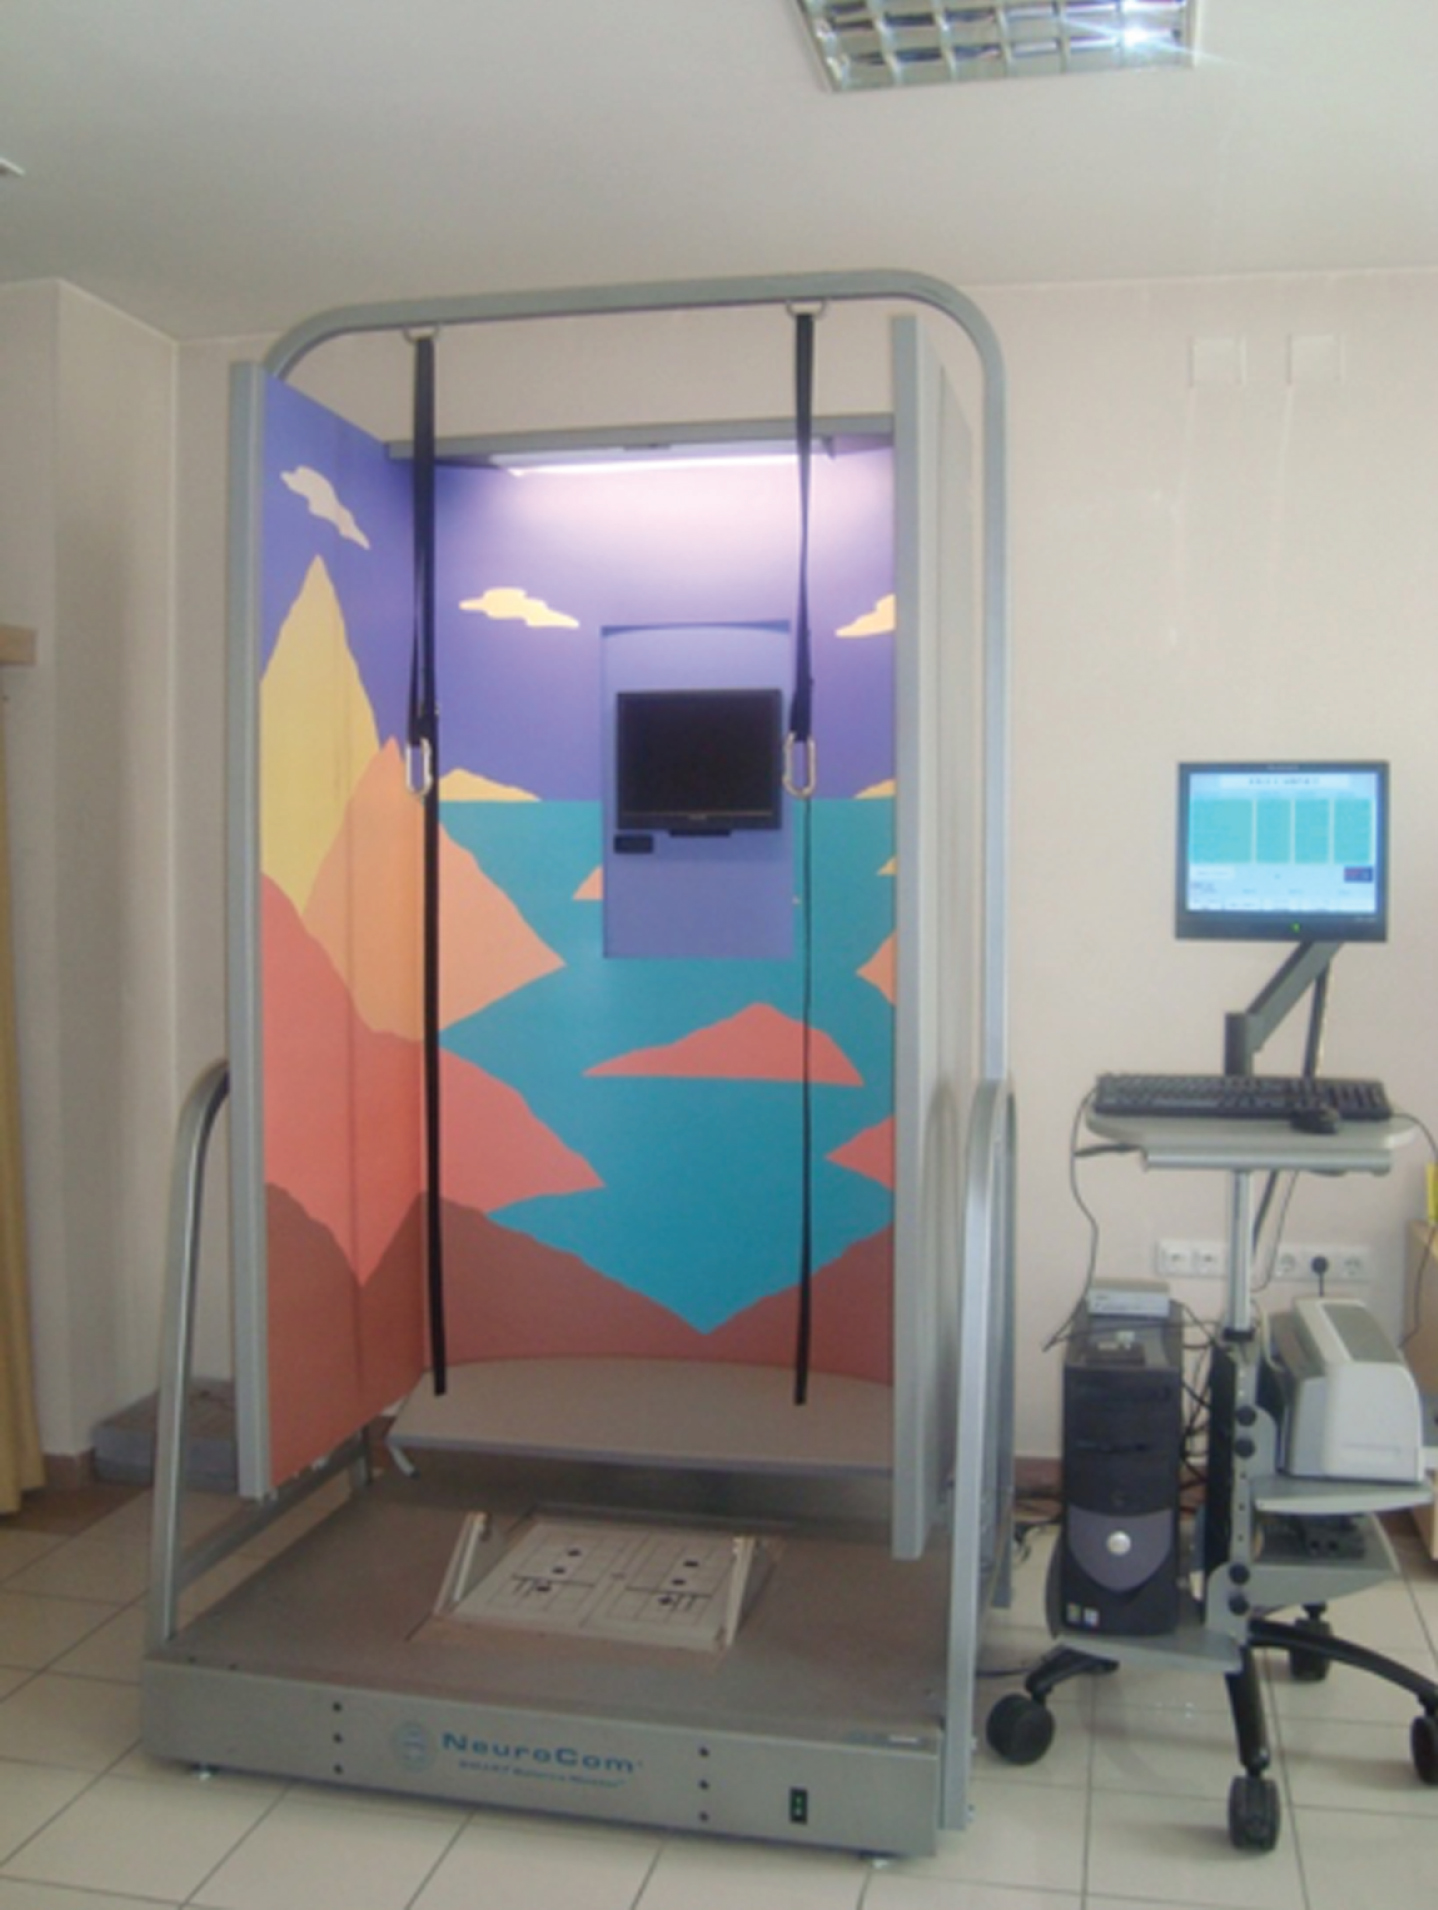
Computerized Dynamic Posturography: Setup.
The feet of the subject were placed on the platform of the CDP device during the SOT. Subjects completed three trials of six different conditions in all, which gradually became more difficult. Six different condition is given in Table 2. The duration of each trial was 20 seconds. The subject was instructed to stand as vertically as possible and to not move during each trial. The SOT scores were calculated by comparing the obtained data with the maximum numerical limits [8, 47]. Outcome measures of the SOT included the equilibrium score (i.e., average of three trials for each condition) for six different conditions, and the composite score (i.e., average of equilibrium scores). These sensory organization ratios are the somatosensorial ratio (SOM), visual ratio (VIS), vestibular ratio (VEST), and preference ratio (PREF). SOM, VIS and VEST ratio scores show how well the subject is able to use somatosensory, visual, and vestibular systems to maintain balance. The PREF ratio determines how well the subject can ignore incorrect visual cues in a situation of visual conflict.
Sensory Organization Test conditions
Sensory Organization Test conditions
An optotype (the letter E) is presented on the computer screen throughout each visual testing. The subject is asked to accurately indicate the direction of the E (i.e., the open end of the letter E is up, down, right, or left). The size of the E is determined in logMAR units. A logMAR is the logarithm of minimal angle of resolution. The logMAR is the standard unit for evaluating visual acuity universally. All trials started with a short practice to ensure that subjects understood the test protocol. The best Parameter Estimate by Sequential Testing (best PEST) adaptive algorithm was used to calculate all test scores.
Static visual acuity (SVA)
The SVA is the measurement of the smallest size of the optotype “letter E” that the subject can see while the head is stationary. The subject is placed on a chair that is adjustable in length and placed 2.5 meters away from the computer screen with the eye level at the same level as the screen. The size of optotype varies depending on subjects’ responses. The smallest size of optotype for which the subject indicated at least 3 of the 5 trials correctly is determined in logMAR [10, 49].
Minimum visual perception time test (mPT)
The mPT is used to determine the shortest time duration of optotype presentation that the subject can correctly detect. The optotype size was adjusted 0.2 logMAR above the SVA value. The subject is asked to indicate the direction of the optotype without any head movement. The shortest screen duration, for which the subject answered at least 3 out of 5 attempts, is determined in milliseconds [10, 48, 49].
Dynamic visual acuity test (DVA)
In the DVA, the head movement monitoring device with a sensor is placed on the head of the subject to measure the rotational speed of the head (Fig. 2A). At a predetermined speed (85– 120 degrees/second), the subject is asked to shake the head at a total angle of 40 degrees (20 degrees to the right and 20 degrees to the left) while indicating the direction of the optotype that can be detected on the screen. The size of the optotype changes during the test according to the response of the subject. Visual and auditory feedback are provided with the InVision system to ensure that the subject can maintain the appropriate head movement rate during the test (Fig. 2B). During dynamic head movement, the minimum value (i.e., that the subject is answered at least 3 of the 5 trials correctly) is determined as logMAR units in both directions (left and right) [10, 49].

Dynamic Visual Acuity Test. A. The head movement monitoring device with a sensor is placed on the head of the subject to measure the rotational speed of the head. B. Visual and auditory feedback are provided with the InVision system to ensure that the subject can maintain the appropriate head movement rate during the test. The section between the two red lines shows the angular head positions of the subject and the blue round ball indicates moving relative to the head movement of the subject. The green lines at the bottom indicate the head velocity of the subject. Before the test, visual feedback is provided to subjects and asked to adjust the head angles to red lines and head velocity to green lines.
The GST is used to measure the ability to accurately determine the direction of the optotype that appears on the screen at the highest head velocity that can be reached. The optotype size is adjusted 0.2 logMAR above the SVA value, while the head velocity changes. At the end of the test, an average of the highest three head velocities at which the subjects responded correctly is determined by the GST head velocity values in degrees/seconds [10, 49].
Statistical analysis
The results of the study were evaluated using SPSS 23.0 for Windows software. In descriptive statistics, frequency and percentage were used in qualitative data. Mean, standard deviation, value range (maximum and minimum), and median parameters were used in the quantitative data. The comparison of the difference between the two conditions in the SOT subtests was evaluated by mixed model analysis. SVA test findings were compared with paired sample t test. The Wilcoxon test was used to compare the findings obtained in the mPT, DVA, and GST. Statistical significance level was accepted as p < 0.05.
Results
Sensory organization test findings
A statistically significant difference was found between SD and DL measurements in five SOT conditions except for Condition 1 (p < 0.05). The composite scores of SD and DL conditions were statistically significant (p = 0.001). In SD condition, the balance scores were lower than DL condition. SOT findings are given in Table 3. 74.2% (23 out of 31) of the participants experienced a decrease in composite scores whereas 9.7% (3 out of 31) have no change and the remaining 16.1% (5 out of 31) have an increase not more than three percentile in composite scores.
Sensory Organization Test findings in daily life and sleep deprivation conditions
Sensory Organization Test findings in daily life and sleep deprivation conditions
(X: Mean score; SD: standart devation; min: minimum score; max: maximum score; *p < 0.05).
There was a statistically significant difference between SD and DL conditions in SOM (p = 0.003), VIS (p = 0.037), and VEST (p = 0.008) ratios. Somatosensorial, visual, and vestibular ratios were found lower in SD condition compared to DL condition (Fig. 3).
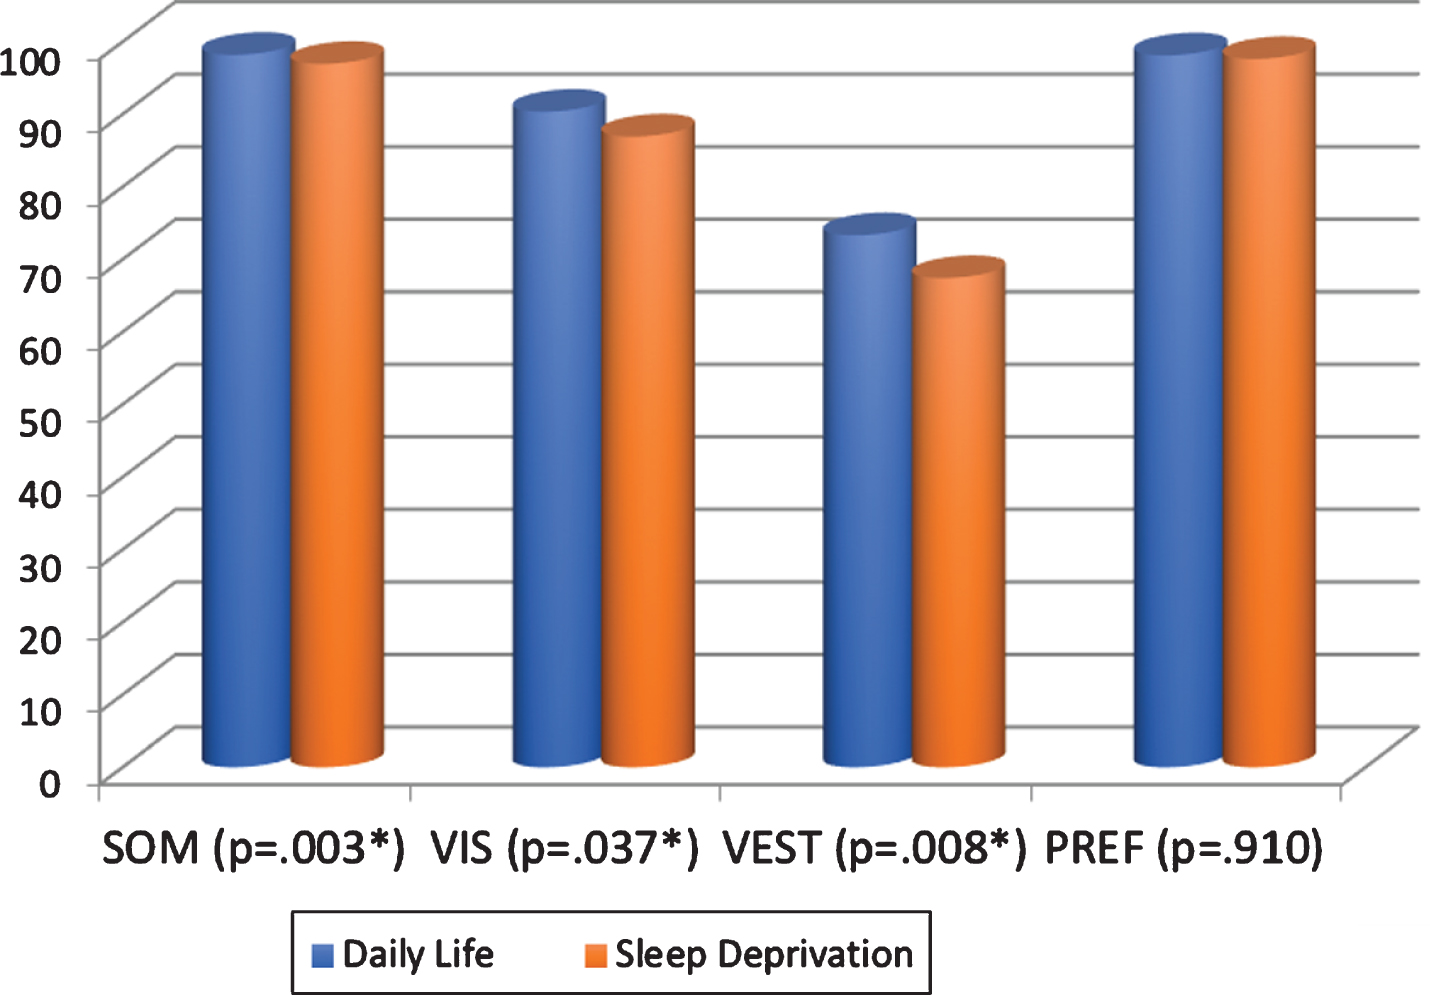
Sensory organization test results in daily life and sleep deprivation conditions. SOM: Somatosensorial Ratio; VIS: Visual ratio; VEST: Vestibular ratio; PREF: Preference ratio.
Static visual acuity test
Static visual acuity values, however, were better in DL condition than SD condition, there was no statistically significant difference between two conditions (p = 0.466).
Minimum visual perception time test
The mPT results showed a statistically significant difference between SD and DL conditions (p = 0.001). In the SD condition, the mPT was found to be longer than DL condition (Table 4).
Minimum Perception Time scores in daily life and sleep deprivation conditions
Minimum Perception Time scores in daily life and sleep deprivation conditions
(X: Mean score; SD: standart devation; min: minimum score; max: maximum score; *p < 0,05).
No significant difference was found between SD and DL conditions in the comparison of the mean dynamic visual acuity values (p = 0.192) and the mean GST head velocity values (p = 0.160) in both directions on the right and left sides.
Discussion
This study evaluated the postural balance and the visual acuity ability in sleep-deprived healthy young adults and showed the impact of SD on the vestibular system and dynamic visual parameters. Based on the findings of our study, SD has an important impact not only on postural control but also on visual processing abilities in young adults. Our results showed that SD has an important impact on the visual perception time which can be associated with the sleep-related vehicle accidents by sleep-deprived drivers, health professions, and students.
Postural balance after sleep deprivation
Vestibular system plays a central role in maintaining postural control when stimuli from visual, proprioceptive, and tactile senses give minimal useful information. When the balance of the body starts to deteriorate, the impulses originating from the sensory receptors become active and form muscle activity to regulate the balance. Continuous body sways, therefore, occurred in order to maintain the upright posture. Displacement in the center of gravity also changes the pressure center. The postural sway will decrease as the center of the gravity and center of the pressure get closer to the same line [32].
Many studies have reported the increase in body sways and deterioration in the postural balance in subjects with SD [1, 37]. Albathi et al. reported that 30% of the patients with vestibular vertigo complaints had abnormal sleep periods [2]. Sleep deprivation affects negatively postural balance in people with lower sleep quality [15]. The adverse effect on the postural control increases with the prolonged period of SD [13] and with age [41]. According to Aguiar et al., the effect of the SD on the postural control may be associated with the reduced adaptation of individuals against optical flow [1].
Nielson et al. evaluated standing balance in four healthy young adults in sleep-deprived and rested conditions. They reported that sleep deprivation increases the need for sensorimotor integrations of vestibular, somatosensory, and visual feedback mechanisms [37]. Similar to findings in previous works, SD negatively affected the interaction of the vestibular, visual, and somatosensory systems in the current study. Body sways were increased significantly in SOT measurements in SD condition. Despite the aversive effect on postural balance in young adults, SD did not cause the subjects to fall down during standing, and all subjects could maintain the upright position.
Acute SD had a more significant effect on SOT-Condition 5 and Condition 6 in our study. These findings revealed that the vestibular system is significantly affected in acute SD. Due to the deterioration of the integration of the visual, vestibular, and somatosensorial systems, it is hard to maintain postural control in SD.
Influence of visual processing in sleep deprivation
During SD, activation of the extrastriate cortex and lateral occipital sections of the interparietal sulcus were reduced. The number of functional cortical circuits in processing visual information, therefore, were decreased after SD. Many important visual functions (e.g., the processing of rapidly changing visual information, visual selectivity, suppression of distracting visual information, and visual short-term memory) were reduced due to the SD [9, 29].
Many papers focused on the impact of SD on cognitive function, attention, perception, emotion, decision-making skills, and visual processing mechanisms [5, 34]. While the effectiveness of visual working memory decreased after sleep deprivation, sleep reduction had no effect on the efficiency of visual working memory [11]. Visual perception processing capacity of people decreased after SD [28, 29]. Roge et al. reported that the percentage of peripheral signals decreased under the condition of sleep deprivation. Fatigue due to the sleep deprivation, therefore, may cause disruption of environmental visual perception (e.g., an aging effect) in the visual system [42].
Jackson et al. suggested that performance deficits on visual tasks during SD are due to higher cognitive processes rather than early visual processing [23]. Nevertheless, a statistically significant difference was obtained between minimum visual perception time values in DL and SD conditions in the present study. Even though the expected visual perception time was 20 milliseconds, it was prolonged after sleep deprivation in young healthy adults. This finding revealed that the visual perception time is perceived to be prolonged in the condition of SD like the other visual processing mechanisms. This impact may be an important effect on the risk of accidents due to human error and may provide evidence for increased traffic accidents, injuries, and loss of performance after SD.
Static and dynamic visual parameters
DVA and GST tests are fast, inexpensive, and easily applicable test methods that can evaluate the VOR function and dynamic visual acuity in subjects during head movement. Dynamic visual parameters such as DVA and GST are used as differential diagnostic tests in unilateral vestibular system pathologies. In spite of the fact that DVA is generally used in vestibular disorders in order to monitor the efficiency of the vestibular exercise and vestibular rehabilitation program, Scherer et al. evaluated the effect of the SD on DVA [16, 48]. Even though another evaluation method of DVA (i.e., head thrust dynamic visual acuity test) was applied, Scherer et al. reported that, similar to our study findings, sleep deprivation had no effect on DVA [43]. In the literature, there is no study about the effect of the SD on the gaze stabilization. Despite the decrease in head velocity in GST after SD, this decrease was not statistically significant in the present study. Our results show that SD does not affect the VOR function much or may cause a similar decrease in VOR function on both sides.
The DVA test and GST are used in the differential diagnosis of vestibular pathologies. They are based on the assessment of pathological losses in VOR function. Subjects in our study had not been diagnosed with vestibular disorder; therefore, the data obtained in the DVA and GST head velocity values were considered to be normal. Although sleep deprivation reduced dynamic visual parameters minimally, the difference was not statistically significant. On account of the SD’s similar effects on the right and left vestibular system, no significant difference occurs between the two sides in the current study.
Marquez et al. applied SVA, mPT, and DVA to 67 subjects to create normative values for young adult soccer players. They obtained SVA, mPT, and DVA values as – 0.23 ± 0.1 logMAR, 20.09 ± 3.36 milliseconds, and – 0.007 ± 0.141 respectively [33]. Likewise, as in the study of Marquez et al., we obtained similar SVA and DVA values in DL condition in a similar age range. In the literature, it was stated that SVA values were affected by factors such as screen brightness, image contrast, visual defect, and age [22, 39]. To eliminate the possible effect of the age and visual impairment factors, young healthy adults without any visual impairment (that could not be corrected via visual aid) were included in the present study.
Although SVA and DVA values were decreased minimally, mPT was prolonged significantly after sleep deprivation. The mPT have shown the visual perception time that can be associated with the reaction time. Reaction time is described as the time between the onset of the target stimulus and the beginning of the motor response of the subject to the target. Reaction time shows a perceptual process in which the sensory organ decides the motor response [3]. The risk for sleep-related car crashes may increase; hence, the reason of the prolonged reaction time in young adults with SD. There are many occupational groups that have to work without sleeping for more than 24 hours. Sleep deprivation is known as an important factor that increases the risk of possible accidents and making mistakes. It may be useful to arrange more suitable working hours for such occupational groups.
In summary, SD had an important effect on the vestibular system and visual perception. Nevertheless, dynamic visual parameters were not decreased after SD in young adults. In light of our findings, we posit that the effect of SD on postural balance and visual perception time is clinically significant. This clinically significant effect results with disruption of the integration between vestibular, visual, and somatosensorial systems. Despite this, it does not have a dramatic effect that would impair the upright postures. The visual perception time can be associated with possible sleep-related vehicle accidents in sleep-deprived drivers, health professions, and students.
There were some limitations of the present study. The main limitation was considered as the lack of a sleep laboratory in our clinical settings. Due to the lack of the sleep laboratory, it was not possible to monitor the exact time of SD in our subjects. Another minor limitation may be the limited number of subjects participated to the study and the limited time of the SD duration (nearly 24 hours). In further studies, effects of the sleep deprivation on the other parts of the vestibular system can also be evaluated with different test batteries (e.g., videonystagmography). The effect of prolonged sleep deprivation (such as 36 hours, 48 hours and more) on the postural control can also be evaluated to monitor any dose dependent effect in future researches.
Conclusion
Sleep deprivation has a considerable impact on the vestibular system and visual perception in young adults, but this impact does not have a dramatic effect that may cause subjects to lose their upright posture. Increased risk of accidents and decreased performance after SD were thought to be due to the postural control and visual processing parameters rather than dynamic visual parameters of the vestibular system. To best of our knowledge, the current study is the first study that evaluates postural balance, static, and dynamic visual parameters together in SD. It is thought to make a valuable contribution to the literature by determining the influence of the SD on the vestibular system and visual perception together.
Financial disclosure
None
Non-financial disclosure
None