



Abstract
In order to overcome the problems existing in traditional financial risk evaluation methods, such as high generalization error and fitting degree with actual value, this paper designs a financial risk evaluation method of blockchain digital currency based on CART algorithm. After screening and ranking the financial risk indicators of blockchain digital currency, the financial risk level of blockchain digital currency is determined by combining CART algorithm. Finally, by calculating the covariance matrix of the financial risk decision matrix, the positive ideal solution and the negative ideal solution of the financial risk are found, and then the final evaluation result is obtained by combining the progress of the financial risk. Experimental results show that the minimum generalization error of this method is only 0.021, the fitting degree of the obtained results and the actual risk can reach 98.0%, and the maximum risk accuracy can reach 0.978.
Introduction
As a new kind of special investment target, digital currency has the function of hedging, so it is increasingly recognized by investors, making its total market value in circulation continue to rise [13]. Digital currencies use information encryption algorithms to maintain their security and privacy. In the development process of digital currency, its application scope and influence are also expanding with the help of blockchain technology [5]. However, the existing financial supervision system does not match the development trend of digital currency, and it is difficult to avoid the uncertain impact and derivative risks caused by it on the financial system [4]. While the trust and tamper-proof advantages of blockchain technology support the creation of a secure digital currency network environment, it also has its own security risks. Designing an effective financial risk evaluation method for blockchain digital currency is the cornerstone of promoting the healthy development of digital currency.
Therefore, a financial risk evaluation method based on Bayesian model and machine learning algorithm is proposed in reference [8]. In this method, the digital currency placement model is firstly established by using Bayesian classification process, and then the Gibbs sampler that can be used for random sampling is established by using machine learning algorithm. Then, according to the default probability of the banking system, the sensitivity of digital currency prior information is analyzed, so as to complete the evaluation of monetary and financial risks. However, it can be found that the generalization error of this method is too high according to the practical application.Reference [2] proposed a risk evaluation method for digital currency based on asymmetric cryptography technology. Based on the analysis of the definition of digital currency, this method designed information encryption process based on blockchain technology, and then rated the risk of digital currency according to Moody’s credit rating model. However, according to the actual application, it can be found that the method has a low fitting degree with the actual financial risk.In reference [9] proposed a digital currency is based on the analysis of the motivation of block chain abnormal risk identification and evaluation method, this method takes the “candy drop” and “greed injection” two kinds of abnormal currency trading behavior, for example, through the analysis and design behavior motive discriminant rules, then using graph matching technology to identify abnormal digital currency risk, The risk level is evaluated according to the truth value set of abnormal currency transaction behavior. However, according to the actual application, it can be found that the method has the problem of low risk accuracy.
Aiming at the problems of high generalization error, low fitting degree and risk accuracy rate of traditional financial risk evaluation methods, this paper designs a financial risk evaluation method of blockchain digital currency based on CART algorithm. The design idea of this method is as follows:
Take TXC-Lib digital currency – open source financial database as the object, select specific risk indicators on the basis of defining the financial risk probability of blockchain digital currency; Considering the probability of the possible occurrence of each financial risk and the severity of the risk consequence, the probability of the possible occurrence of financial risk is multiplied with the real-time financial risk, and the calculation result is used as the ranking index to complete the screening and ranking of the financial risk of blockchain digital currency; Analyze the correlation between the deviation degree of blockchain digital currency and the financial risk level, and judge the financial risk level of blockchain digital currency with CART algorithm. In this step: First will block chain of digital currency history data as a template, discrete partition model of training CART growth process is actually the process of grouping the training sample, which could be divided into two groups of data samples, again through the gradually increase the gain, until there is a tall tree can be cut, the resulting decision divided good block chain digital currency trading data subset; Use the data subset obtained above to establish discrete partition of financial risks, and divide financial risks into three grades: A (low risk), AA (general risk) and AAA (high risk) according to the discrete partition of the deviation degree of blockchain digital currency. By calculating the covariance matrix of the blockchain digital currency financial risk decision matrix, find out the positive ideal solution and the negative ideal solution of the blockchain digital currency in the financial risk, and then combine the progress of the financial risk to obtain the final risk evaluation results.
Evaluate the financial risk of blockchain digital currency based on CART algorithm
Screening and ranking financial risks of blockchain digital currency
In this study, financial risks of blockchain digital currency are firstly screened and ranked according to probabilistic indicators. The financial risk probability of blockchain digital currency is defined as follows:
In Formula (1),
In a digital currency to block chain financial risk filtering and sorting, considering each thought possible financial risk probability and risk consequences, the severity of the possible financial risk probability will do product operation and real-time financial risk, and the calculated results as indicators of filtering and sorting X, it can be represented as:
In order to reduce the solving scale of joint assessment of financial risk of blockchain digital currency, the possibility of financial risk of blockchain digital currency is analyzed and ranked, as shown in Table 1.
Financial risk index analysis of blockchain digital currency
Financial risk index analysis of blockchain digital currency
Because the influence degree of different indicators is different, the ranking of indicators should be completed according to the weight of indicators. The screening and sorting process of financial risks of blockchain digital currency is shown in Fig. 1.
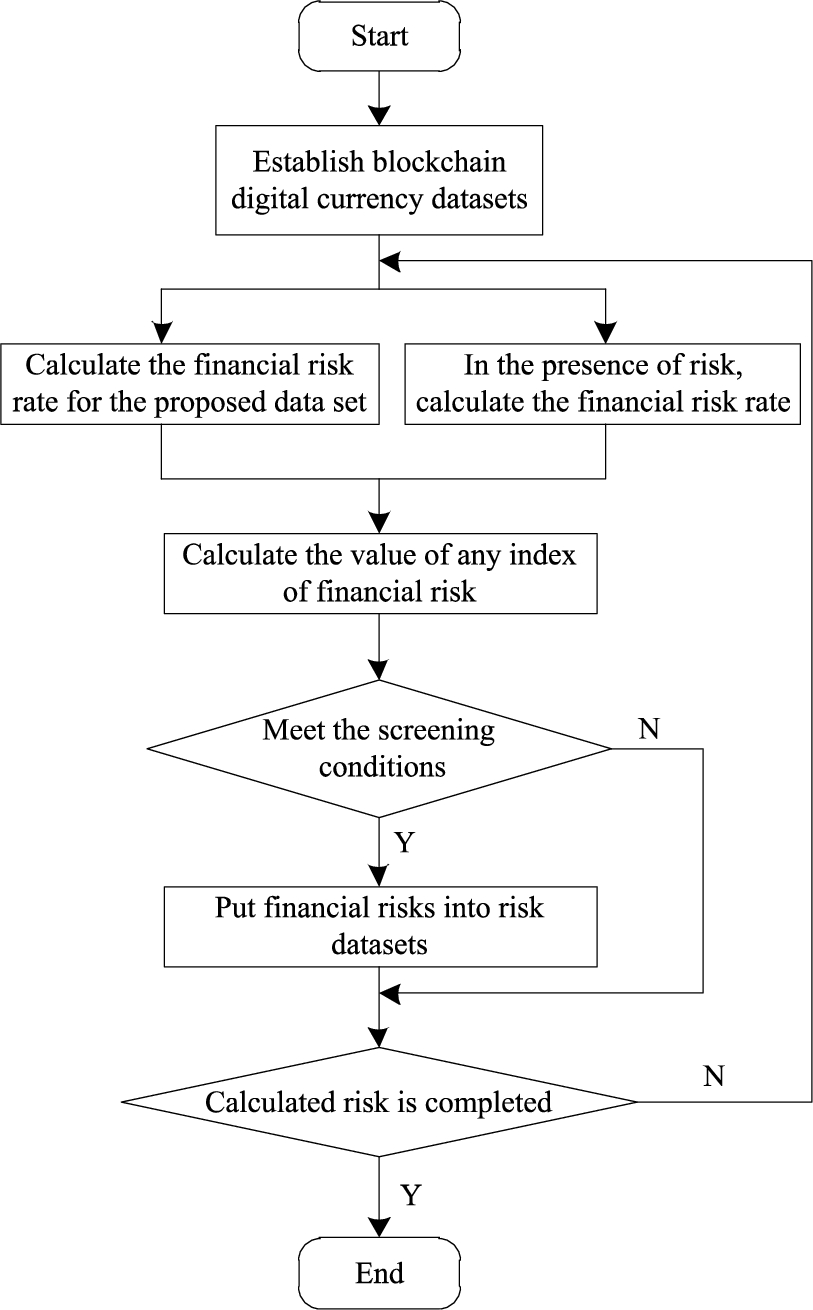
Block chain digital currency financial risk screening and sorting flow chart.
Classification And Regression Tree (CART) algorithm is a derivative algorithm of Classification decision Tree. It divides the current data set by binary recursive segmentation to ensure that there are two branches at the leaf nodes of the data subset [1]. Therefore, the decision tree generated by CART algorithm has a simple binary tree structure.
The central work of CART algorithm includes the following two aspects: one is to perform recursive processing on data samples and complete tree construction by dividing their independent variable space; the other is to complete pruning with verification data [11]. Therefore, the financial risk level of blockchain digital currency is determined by combining the financial risk indicators of blockchain digital currency screened in Table 1 and CART algorithm. The steps are as follows:
Step 1:Before judging the financial risk level of blockchain digital currency, the deviation degree of blockchain digital currency should be determined first. Assuming that the distance between blockchain digital currency and the current currency pattern library is
Step 2: Based on the historical overdue information, the correlation between the deviation degree of blockchain digital currency and financial risk level is analyzed.
Step 3: The optimal segmentation point of decision tree is obtained by gini coefficient.
First will block chain of digital currency history data as a template, discrete partition model of training based on results of calculating the deviation degree of forecast for the next financial cycle block, chain of digital currency deviation again to pilot sample of historical data, generate a binary group} {deviation, real expectations or not to complete the training of discrete partitions.
The essence of CART growth process is continuous grouping training of training samples [14]. Firstly, the numerical input variables are arranged in ascending order, and then the intermediate value of each group is taken as the group limit. The data samples are divided into two groups, and then the differences between the output values of each group of samples are calculated [3]. In this process, this study uses the reduction of Gini coefficient to predict the change of this difference, so as to obtain the optimal segmentation point. Gini coefficient is a form of sample purity, the smaller the Gini coefficient. It indicates that the purer the data sample is, the calculation method is as follows:
In Formula (4),
Step 4: CART algorithm is used to generate data set subtree sequences.
For the largest tree in the CART algorithm, make its gain
If the blockchain digital currency transaction dataset T takes a certain attribute as its split attribute, the original dataset T is divided into two subsets
In Formula (5),
Step 5: According to the two subsets
Suppose sample subset of exceed the time limit for the “+” sample sets
Blockchain digital currency financial risk rating
Blockchain digital currency financial risk rating
According to the financial risk level of blockchain digital currency, specific risk quantitative evaluation is carried out. In view of the statistical problem of distance between different evaluation index attributes, analytic hierarchy process (AHP) is adopted in this study to avoid the dimensionalization problem between different evaluation index attributes, so as to weaken the mutual interference between different evaluation indexes.
Suppose there is an evaluation index multi-attribute vector
In Formula (6),
It is assumed that
Assume that the Posting progress of the financial risk of the i-th blockchain digital currency is
Based on the above analysis, the steps for financial risk evaluation of blockchain digital currency are as follows:
Step 1: The financial risk evaluation language of blockchain digital currency is transformed into trapezoidal fuzzy data [6], and a fuzzy decision matrix is formed.
Step 2: The risk matrix of each financial risk index is calculated to form a group decision evaluation matrix.
Step 3: Standardization of financial risk evaluation of group decision making matrix
Step 4: By calculating the covariance matrix of blockchain digital currency financial risk decision matrix, the positive ideal solution
Step 5: Calculate the distance between the financial risk element of each blockchain digital currency and
Step 6: Formula (9) is used to sort the progress of financial risk Posting, and then according to the correlation coefficient κ between indicators, the final comprehensive risk evaluation value Z is:
Experiment and analysis
In order to verify the practical application performance of the above designed financial risk evaluation method of blockchain digital currency based on CART algorithm, the following experimental process is designed.
Experimental environment design
The experimental environment was established in the simulation platform, and the SR258 1U rack server was used to set the data acquisition module, risk assessment module and control module.
The experimental data came from TXC-Lib digital currency – open source financial database. Before the experiment, normalized processing was performed on the data.
In order to improve the demonstrability of experimental results, the financial risk evaluation method based on Bayesian model and machine learning (method of Reference [8]) and the digital currency risk evaluation method based on asymmetric encryption (method of reference [2]) were taken as the comparison group, and the method of this paper was taken as the experimental group, and the comparison test was carried out with generalization error, fit degree and risk precision rate as indicators.
Description of experimental indicators
Generalization error is mainly used to test whether the evaluation method can handle the sample data to be evaluated in a balanced way, so as to analyze whether the evaluation method can guarantee the accuracy of evaluation results when positive and negative samples are unbalanced. In this study, the pass rate of positive samples and the provision coverage of digital currency are used as experimental indicators to measure the level of generalization error. The calculation process of the two is as follows:
In the formula, F denotes the pass rate of the evaluation sample, The degree of fitting with actual financial risks. This index is used to test the direct coincidence between the results obtained by different evaluation methods and the actual results, and it can reflect the evaluation accuracy of different evaluation methods. Risk accuracy rate. This index is the ratio of risk information that can be accurately retrieved to the total amount of digital currency information, according to which the analysis performance of the evaluation method on digital currency financial risk can be judged, and the effectiveness of the evaluation method can also be reflected from the side.
Numerical analysis
First, the accuracy of different evaluation methods is verified by generalization error. Statistical results of generalization errors of different methods are shown in Table 3.
Comparison of generalization errors of different evaluation methods
Comparison of generalization errors of different evaluation methods
According to the results shown in Table 3, under different positive and negative sample ratios, the sample pass rate and provision coverage rate of different evaluation methods are different. The larger the proportion, the lower the pass rate of the evaluation sample, the higher the provision coverage.
Among the three groups of experimental results, only the method in this paper maintains the pass rate of evaluation samples above 0.90 and the provision coverage rate below 0.10 when the proportion of positive and negative samples changes, indicating that the generalization error of this evaluation method is very small. This result is also reflected by the specific value of the generalization error. The minimum generalization error of the proposed method is only 0.021, indicating that the proposed method can effectively guarantee the accuracy of evaluation results and its generalization ability can better meet the needs of practical evaluation.
Then, the fitting degree between the evaluation results of different methods and the actual financial risks is used as an indicator for comparison and verification, and the results are shown in Fig. 2.
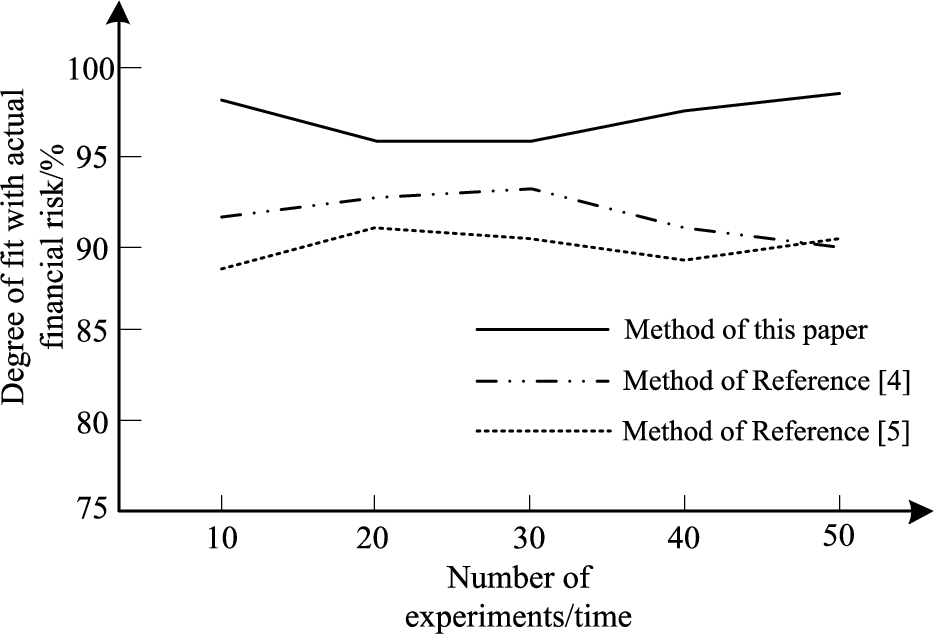
Comparison of fitting degree between evaluation results of different methods and actual financial risks.
According to the results shown in Fig. 2, in the 10th experiment, the fitting degree between the evaluation results of this method and the actual financial risk is 96.8%, the fitting degree between the evaluation results of method of reference [8] and the actual financial risk is 92.3%, and the fitting degree between the evaluation results of method of reference [2] and the actual financial risk is 87.2%. In the 30th experiment, the fitting degree between the evaluation results of this method and the actual financial risk is 95.5%, the fitting degree between the evaluation results of the method of reference [8] and the actual financial risk is 93.9%, and the fitting degree between the evaluation results of the method of reference [2] and the actual financial risk is 91.5%. In the 50th experiment, the fitting degree between the evaluation results of this method and the actual financial risk is 98.0%, the fitting degree between the evaluation results of the method of reference [8] and the actual financial risk is 91.4%, and the fitting degree between the evaluation results of the method of reference [2] and the actual financial risk is 92.2%.
In the whole experiment process, the fitting degree between the evaluation results of the proposed method and the actual financial risk can reach 98.0%, indicating that the proposed method has high evaluation accuracy.
Finally, the effectiveness of different evaluation methods is verified by risk accuracy. Statistical results of risk precision rate of different methods are shown in Table 4.
Comparison of risk accuracy of different methods
According to the results shown in Table 4, in the 10th experiment, the risk precision rate of Method of this paper was 0.955, and that of method of reference [8] was 0.873. The risk precision of method of reference [2] is 0.844. In the 30th experiment, the risk precision ratio of Method of this paper, method of reference [8] and method of reference [2] was 0.932, 0.867 and 0.857 respectively. In the 50th experiment, the risk precision ratio of method of this paper, method of reference [8] and method of reference [2] was 0.946, 0.854 and 0.853 respectively.
In the experimental process, the maximum risk accuracy rate of method of this paper can reach 0.978, and the minimum can reach 0.932, indicating that method of this paper is more effective than the two traditional methods.
To sum up, method of this paper has the advantages of low generalization error, high fitting degree with actual financial risks and high risk accuracy, which is suitable for practical application.
As the most typical and successful application mode of blockchain technology, digital currency has exerted a huge influence on the organizational form of digital society. Therefore, in order to improve the security of blockchain digital currency, this study designed a financial risk evaluation method of blockchain digital currency based on CART algorithm.
Based on the definition of the financial risk probability of blockchain digital currency, this method selects specific risk indicators and conducts screening and ranking of the financial risks of blockchain digital currency. Then the financial risk level of blockchain digital currency is judged with CART algorithm. Finally, by calculating the covariance matrix of the blockchain digital currency financial risk decision matrix, the positive ideal solution and the negative ideal solution of the blockchain digital currency in the financial risk are found, and then combined with the progress of the financial risk to obtain the final risk evaluation results.
According to the experimental results, it can be seen that the minimum generalization error of this method is only 0.021, and the fitting degree between the evaluation result and the actual financial risk can reach 98.0%, and the maximum risk accuracy can reach 0.978, indicating that the application of this method can effectively evaluate the financial risk of blockchain digital currency.
Footnotes
Acknowledgements
This work was supported by 2015 Youth Funds of Wuhan Donghu University under grant no. 2015dhsk007.