
Abstract
BACKGROUND:
The importance of experienced work stress and individual traits as well as their interplay is analyzed with regard to dysfunctional coping behavior in case of sickness.
OBJECTIVE:
The aim of this study was to examine the predictive capability of effort-reward imbalance (ERI) including overcommitment, meaning the intrinsic propensity in terms of excessive work-related expenditure (OC), in consideration of dispositional optimism/pessimism on presenteeism.
METHODS:
A total of 353 men and women aged 38 from the 25th panel wave of The Saxony Longitudinal Study in 2011 were included in the analysis. Effort-reward imbalance (ERI) including overcommitment was assessed with the Effort-Reward Imbalance Questionnaire. Dispositional optimism and pessimism were quantified using the German version of the Life-Orientation-Test (LOT-R). Presenteeism was measured by single item two years later.
RESULTS:
Multiple regression analysis showed that the amount of the effort-reward imbalance experienced in 2011 had no statistically significant predictive potential with regard to presenteeism in 2013. After splitting the sample according to a validated effort-reward imbalance threshold, remarkable prediction of presenteeism for participants experiencing an ERI was accomplished by the moderating effect of dispositional pessimism on overcommitment (ß= 0.32; p < 0.001).
CONCLUSIONS:
Although ERI did not have the expected predictive capability relating to the entire sample, the detailed analysis of the moderating effect of pessimism on overcommitment and the resulting amount of explained variance for those participants experiencing an ERI is a noteworthy finding.
Keywords
Introduction
The acceleration of economic globalization has led to the increase of health-adverse work environments. Since threatened job stability is no longer restricted to low skilled blue collar workers, belonging to well qualified professions is no protective factor in avoiding stress-induced health risks [1]. In addition, the demographic change entails a growing burden of preserving the workforce’s health, which is aggravated by the fact that study results are linking work related stress to bad health especially in middle-aged individuals [2, 3]. Beyond these observations, further evidence for “[…] the relative importance of midlife psychosocial working conditions not only for health in mid-life but also for health functioning after labor market exit” was found by Wahrendorf et al. [4, p.478]. Effort-reward imbalance (ERI) has been found to be very important relating to worker’s physical health functioning. Furthermore, the effort-reward imbalance model’s intrinsic motivational component of high effort (overcommitment, OC) has been found to be an autonomous factor regarding statistically as well as clinically meaningful impact on several health indicators implying a heightened health risk in the long term for those being highly overcommitted [2]. Based on the ERI model’s assumption with regard to increased probability of adverse health effects during the combination of high effort and low reward (ERI+) and supplementary overcommitment (OC+) circumstances, significant interaction effects were uncovered for this high stress scenario [2, 5]. Wahrendorf et al. [4] found the aforementioned combination (ERI+, OC+) leading to adverse health effects above and beyond those accounted for by the single components (ERI+ or OC+). Since the majority of studies have focused on the extrinsic components (ERI+) and their impact on employee health, there is backlog demand in terms of the importance of individual’s overcommitment, and the potentially resulting interaction respectively [2].
Although the empirical support is only growing at a low pace, the idea of an interaction’s (ERI+, OC+) explanatory potential that exceeds the single component’s (ERI+, OC–), (ERI–, OC+) has gained increasing popularity [2]. Rödel et al. [6] pointed out that an effort-reward imbalance (ERI+) can be seen as a predictor for reduced health in the future. The same perspective is highly probable for people who can be described as “overcommitted” (OC+) [2].
Effort-Reward Imbalance (ERI)
Concerning the concept of effort-reward imbalance at work, Siegrist [3, 5] sheds light on the importance of social reciprocity. This norm of cooperative exchange heralds the significance of fair exchange of efforts spent by the employee and rewards spent by the employer. An employment contract fulfills the requirements of social reciprocity if the proportion between efforts and rewards follows the standards of return expectancy [3]. Several studies and meta-analyses substantiate the assumption that the enduring effort-reward imbalance at work will increase the risk of impaired health and can therefore be seen as a damaging effect, particularly in matters of mental disorders as well as coronary heart disease [7–9]. Furthermore, according to Siegrist [3], prospective investigations found links between effort-reward imbalance and poor self-rated health and sickness absence. The beneficial contractual reciprocity is frequently lacking, resulting in an asymmetrical exchange of effort and reward. There are three scenarios in which the effort-reward imbalance is preserved [3, 5]:
(i) due to limited workplace alternatives, especially unqualified and/or older employees who lack a certain set of skills and/or mobility, have no other option than to accept the enduring effort-reward imbalance. (ii) The time spent under circumstances of effort-reward imbalance is sometimes seen as an anticipatory investment by the employee to enhance future work chances. (iii) Employees who can be described as work-related “overcommitted” show an excessive investment of effort caused either by the need of recognition or by false awareness of the recent cost-gain interrelation that they experience which can lead to exhaustion if maintained. Overcommitment is labeled as a dysfunctional pattern of coping with a strong ambition of remaining in control and is appraised as a self-contained risk factor with the potential to raise the individual’s vulnerability to stress [2].
Dispositional optimism and pessimism
Concerning dispositional optimism, Scheier and Carver [10] see it as a personality trait which is frequently separated into a branch of positive outcome expectancy (optimism) or a branch of negative outcome expectancy (pessimism). To this day, the controversially discussed question whether dispositional optimism represents one bipolar dimension or can be separated into two dimensions is not settled [11]. Some studies recommend the two-dimensional solution [12, 13], whereas others share the unidimensional notion [14, 15]. As a cognitive construct it is linked to motivation, namely optimists being more likely to apply effort, whereas pessimists are dissociating themselves from it [11]. With optimism being negatively related with symptom reporting, there is room for speculation whether it is due to a lower level of experienced symptoms or because optimists may put a good face on the matter [16]. Dispositional optimism is associated with continued positive striving as a means of coping as well as making the most of challenges. In contrast, dispositional pessimism is accompanied by denial regarding the stressor, partiality concerning emotional distress and disengagement from goals that are interacting with the stressor [16]. Therefore, dispositional optimism is known to be associated with less distress and higher amounts of positive emotions. Additionally, due to this lower physiological strain, optimism is able to predict physical health [11, 18]. Notable consistency exists in matters of the exhibition of higher subjective well-being by optimists during stressful times, whereas pessimism is believed to influence the self-rating of health [19, 20]. Chronic stress is linked to lower levels of optimism and higher levels of pessimism. Furthermore, there is reasonable suspicion in view of a possible influence of optimism and pessimism by environmental conditions and life events [20].
Presenteeism
The tendency to go to work while ill, meaning “[…] the phenomenon of people, despite complaints and ill health that should prompt rest and absence from work, still turning up at their jobs” [21, p.503] and the direct and indirect consequences have recently gained popularity. The phenomenon on which this behavior is based is called presenteeism and can usually be measured with a single-item question [22]. Regarding the scientific literature, there are two perspectives that can be separated. The first deals with the employee’s aforementioned behavior of going to work while sick. The second is dealing with the economic consequences, namely “The measurable extent to which health symptoms, conditions and diseases adversely affect the work productivity of individuals who choose to remain at work” [23, p.2]. Several studies [22, 25] have already been able to identify possible predictors of presenteeism. As underlying work-related factors, time pressure, the amount of job control, and job security were of importance. Considering personal circumstances, overcommitment was found to be the most important predictor. With regard to individual attitudes, the stance in relation to sickness absence was decisive [24]. Especially individual factors, more accurately, the reported levels of stress, have one of the strongest relationships with going to work while sick [25]. As another individual factor, Miraglia and Johns [26] discovered optimism to be a decreasing element regarding the amount of presenteeism.
The aims of this study were: to estimate the amount of employees from The Saxony Longitudinal Study experiencing an effort-reward imbalance (ERI+), the amount of those diagnosed as “overcommitted” (OC+), and above that those employees for whom both criteria held true to estimate the degree of presenteeism to identify the prognostic potential of ERI including overcommitment and of dispositional optimism or pessimism in the first time of measurement in 2011 in matters of the rate of presenteeism in the second time of measurement in 2013 to analyze whether those participants experiencing an ERI would show an increased probability of presenteeism two years later in relation to those employees who did not meet the effort-reward imbalance respectively overcommitment criteria to examine the existence of interaction effects between dispositional optimism or pessimism, effort-reward imbalance including overcommitment, and other socioeconomic factors (e.g. sex, level of income, educational level) and the additional predictive value for the above mentioned presenteeism.
Hypothesis 1: Participants experiencing an effort-reward imbalance in 2011 will show higher levels of presenteeism in 2013 than participants not experiencing an effort-reward imbalance.
Hypothesis 2: The effort-reward ratio and overcommitment score in 2011 will be valid predictors of presenteeism in 2013.
Hypothesis 3: As a stable trait, dispositional pessimism in 2011 will predict higher levels of presenteeism in 2013.
Methods
Setting and participants
The reported results of this study are derived from The Saxony Longitudinal Study, which is a prospective cohort study that was created in 1987 in the former German Democratic Republic (GDR). After the German reunification, The Saxony Longitudinal Study could be pursued until today with those 587 participants (48% males, 52% females) who had given their informed consent in 1989 to further participate in future investigations (see Fig. 1) [27]. The results reported in this study stem from the 25th panel wave in 2011 and from the 27th panel wave in 2013 (participants aged 38 and 40 respectively).
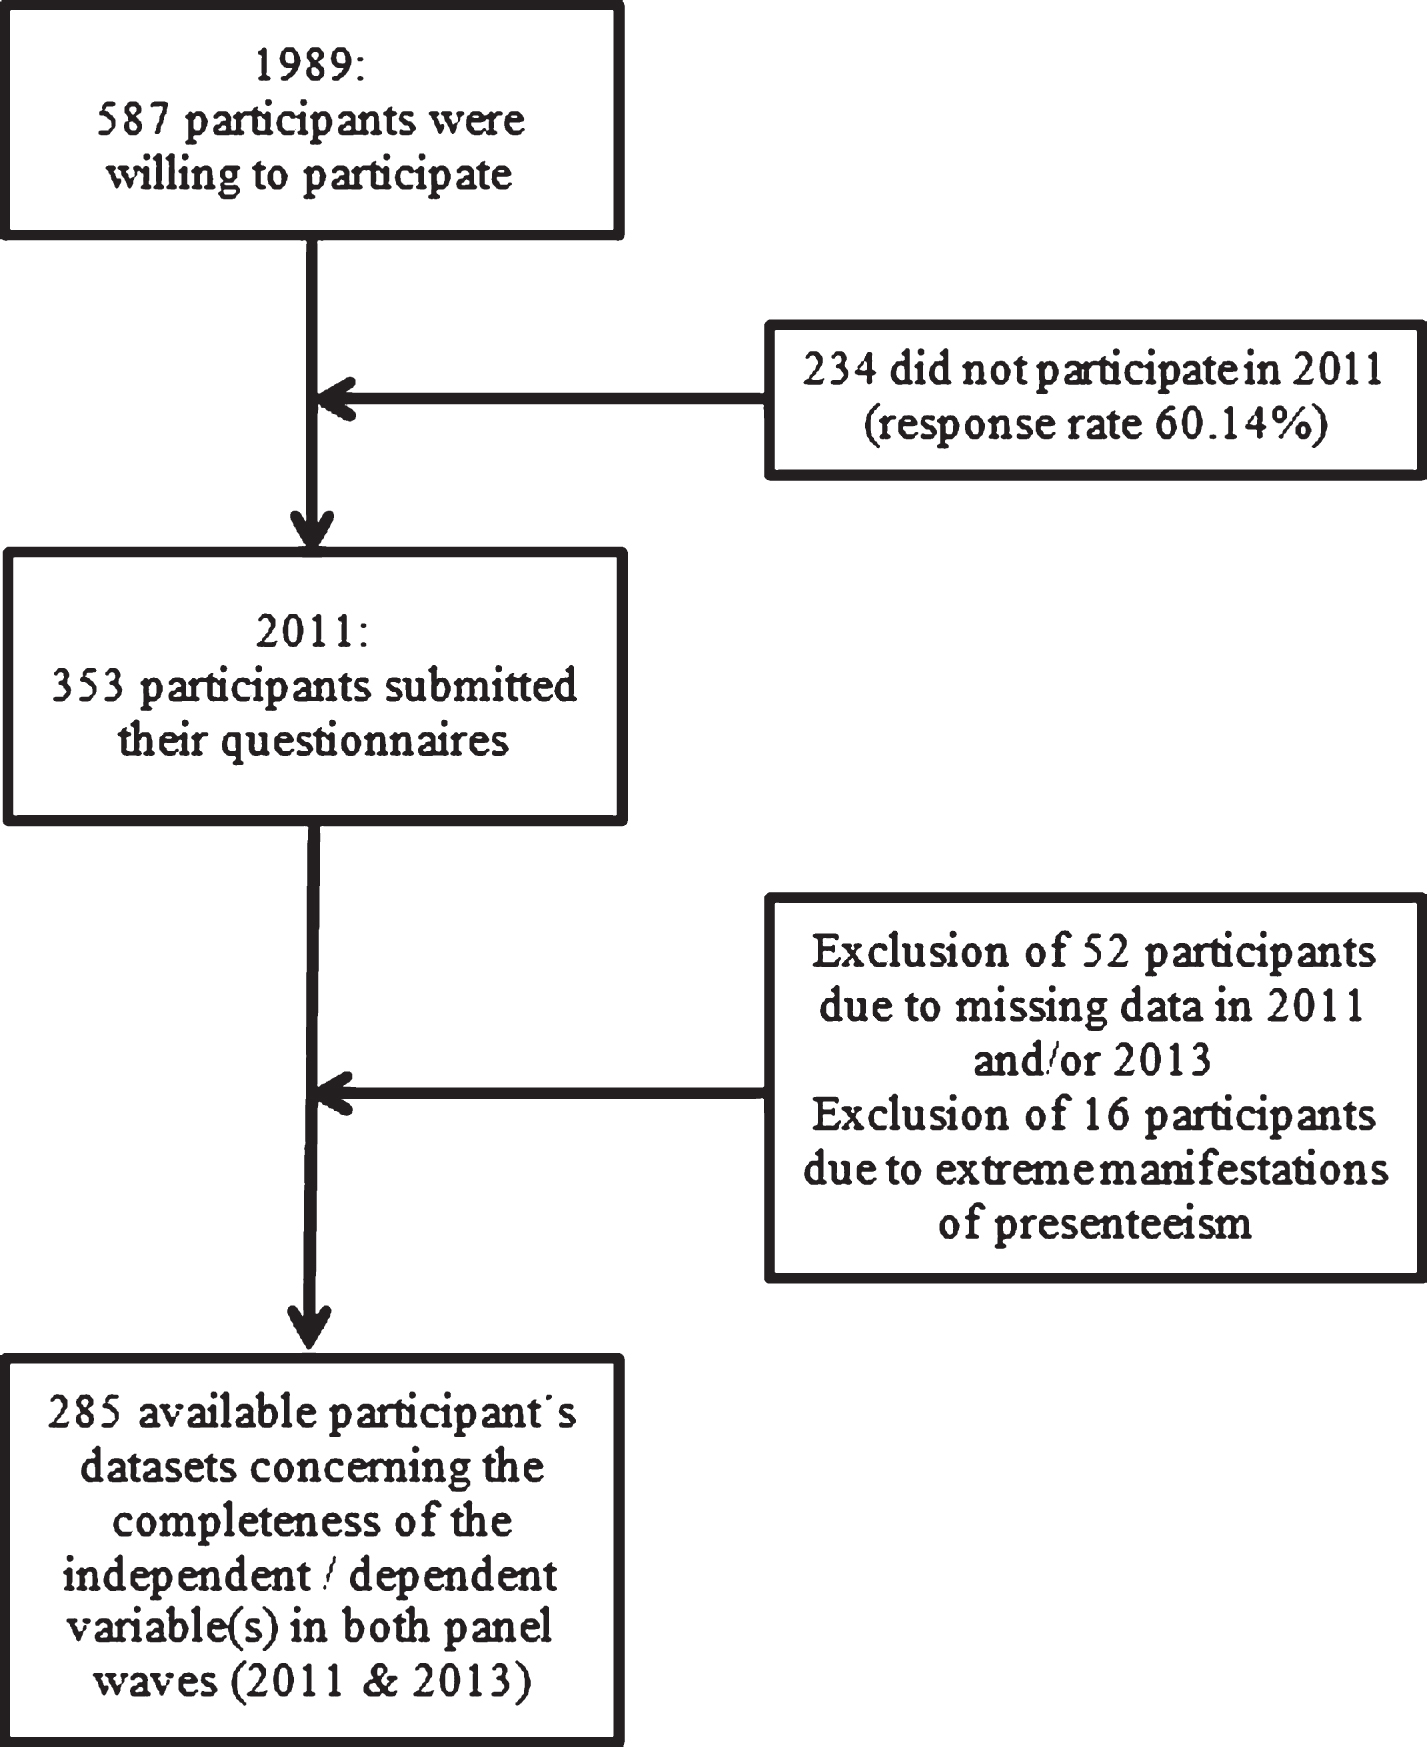
Study flow diagram.
Socio-demographic data and socio-economic situation
Socio-demographic parameters (e.g. gender, level of education, level of income) were assessed annually (see Table 1 Appendix). Additionally, the following questionnaires were addressed at the participants in 2011: Effort-Reward Imbalance Questionnaire [6], the German version of the Life-Orientation-Test (LOT-R) [28]. In the 27th panel in 2013, information on the relevant construct of presenteeism (single-item) was sampled.
Questionnaires
The Effort-Reward Imbalance Questionnaire
According to Siegrist et al. [29], two sum scores derive from the two one-dimensional scales “effort” (six items) and “reward” (eleven items), which are necessary to calculate the effort-reward ratio. All items are Likert-scaled and range from 1 (negation) to 5 (strongly suffering). The rating takes place in a two-step procedure with participants answering in the first step whether or not the items applied and in the second step the level of distress experienced when they apply [4]. The reward scale itself can be further separated into three component subscales. “Esteem” (five items), “Job Promotion” (four items), and “Job Security” (two items). An effort-reward ratio = 1 can be interpreted as an equality between efforts invested and rewards achieved. A favorable ratio <1 indicates a negative imbalance, and a disadvantageous ratio >1 a positive imbalance. Lehr et al. [30] point out that this mathematical perspective cannot be interpreted as a ratified boundary value. Additionally, six “overcommittment” items, which range from 1 (don’t agree at all) to 4 (strongly agree) have to be answered. Overcommitment is seen as the intrinsic motivational origin of high effort [3, 4]. Measuring effort and reward as well as overcommitment combines organizational characteristics and individual coping nature, according to Siegrist [3].
Life-Orientation-Test (LOT-R)
The German version of the Life-Orientation-Test (LOT-R) [28] separates the construct into a two-dimensional questionnaire dividing positive general life expectations and negative general life expectations as two independent factors, as recommended by Herzberg et al. [31]. The standardized self-report questionnaire consists of ten Likert-scaled items which range from 0 (strongly disagree) to 4 (strongly agree). With four of the ten items being used as filler items, there are three items each for assessing optimism and pessimism, resulting in a range between 0 and 12, with higher scores reflecting higher levels of optimism and pessimism. Instead of one total sum score, this study uses two separate scores for dispositional optimism and pessimism and therefore the two-dimensional solution of the dispositional optimism and pessimism construct [12, 13].
Socio-demographic and socioeconomic characteristics of the Saxony Longitudinal Study in 2011
Socio-demographic and socioeconomic characteristics of the Saxony Longitudinal Study in 2011
Mean scores & t-test results of the comparison between LOT-R scores of participants from the Saxony Longitudinal Study (N = 350) and the German norm sample (N = 410)
Note: *p < 0.05, **p < 0.01, ***p < 0.001; ER-R = Effort-Reward Ratio; Means and standard deviations are listed as M / SD; N(<0.715) = 251; N(>0.715) = 97.
According to Aronsson and Gustafsson [22], presenteeism was measured with a single item pursuant to: How many days during the past 12 months did you go to work, despite feeling sick?
Data analyses
Multivariable linear regressions were performed regarding the longitudinal effects of ERI including overcommitment, dispositional optimism and pessimism on presenteeism two years later. The significance test’s α level was set to 0.05 if not declared differently. IBM SPSS Statistics 21 was used for all calculations.
According to Baron and Kenny [33], possible moderating effects were examined in case of unforeseen weak relations or inconsistences between predictors and outcome [34]. Interaction effects are a common incident in psychological research and are therefore considered to be “[…] perhaps even the rule rather than the exception” [34, p.116] and consequentially “[…] at the heart of theory in social science” [34, p.116]. In case of significant interactions, simple regression line’s slopes were tested with regard to their statistical significance (spotlight analysis) [36]. Since “[…] testing the simple slopes provides information regarding the significance of the relations between the predictor and outcome at different levels of the moderator” [34, p.122]. Furthermore, using Johnson-Neyman Technique [35], we aimed at identifying the exact values of the moderator that indicate points of transition (Johnson-Neyman Points) between statistical significance and non-significance (floodlight analysis). These points along the moderator’s continuum define the existing region or regions of significance within which the predictor is significantly related to the outcome [36]. To analyze potential significant interaction effects, the SPSS macro “PROCESS” was utilized. According to Hayes [36], this computational procedure facilitates moderation and/or mediation analysis.
Results
Comparison of ERI scores, LOT-R scores, and amount of presenteeism of participants experiencing/ not experiencing an effort-reward imbalance
Those participants experiencing an effort-reward imbalance (27.5%) could additionally be identified as being “overcommitted”. The described rating was performed according to the thresholds discovered by Lehr et al. [30], who found that “The best achievable trade off between sensitivity and specificity was reached at ERI > 0.715 and OC > 16, respectively” [p. 257]. The results listed below are depicted in Table 3.
Mean scores & t-test results of participants experiencing/ not experiencing an effort-reward imbalance
Mean scores & t-test results of participants experiencing/ not experiencing an effort-reward imbalance
Note. *p < 0.05, **p < 0.01, ***p < 0.001; Means and standard deviations are listed as M / SD.
Participants experiencing an effort-reward imbalance reported significantly higher effort scores than those who did not. The same prevailed for the effort-reward-ratio and for the overcommitment score, whereas the opposite was true for the reward score.
LOT-R
Participants experiencing an effort-reward imbalance reported significantly higher pessimism scores than those who did not. The opposite was true for the optimism score.
Presenteeism
Participants experiencing an effort-reward imbalance reported no significant differences in presenteeism scores than those who did not.
Prediction of presenteeism
In the first model based on the entire sample the level of education (ß= –0.17; p < 0.01) and dispositional pessimism (ß= 0.12; p = 0.05) were found to be statistically relevant predictors of presenteeism (P) (ΔF(I) = 4.21: p < 0.001; R2 = 0.10). Higher levels of education had a reducing effect on presenteeism, whereas higher scores of dispositional pessimism increased the amount of presenteeism. In the second model, which was extended with the potential interaction term pessimism×overcommitment, the level of education continued to be a significant predictor of presenteeism in participants not experiencing an effort-reward imbalance (ß= –0.17; p < 0.01). The same was valid for dispositional pessimism (ß= 0.13; p < 0.05). As depicted in Table 4, the other predictors, which included the non-significant interaction term, showed no statistical relevance, which, as in model 1, limited the amount of prediction (P) (ΔF(II) = 4.02: p < 0.001; R2 = 0.10).
Summary of Multiple Linear Regression Analysis for Variables Predicting Presenteeism (N = 285)
Summary of Multiple Linear Regression Analysis for Variables Predicting Presenteeism (N = 285)
Note. *p < 0.05, **p < 0.01, ***p < 0.001; B: Unstandardized regression coefficient; SE: Standard error; ß: Standardized regression coefficient. ΔF(I) = 4.21: p < 0.001; R2 = 0.10, Adjusted R2 = 0.07; ΔF(II) = 4.02: p < 0.001; R2 = 0.10, Adjusted R2 = 0.08.
Whereas in those participants experiencing an effort-reward imbalance, as defined by the threshold of Lehr et al. [30] (effort-reward ratio >0.715), different results emerged with respect of the first model (P) (ΔF(I) = 2.99: p < 0.01; R2 = 0.22). As indicated in Table 5, only dispositional pessimism (ß= 0.27; p < 0.05) was found to be a significant predictor increasing the amount of presenteeism. With respect to the second model (P) (ΔF(II) = 4.10: p < 0.001; R2 = 0.31), dispositional pessimism (ß= 0.29; p < 0.01) was once more found to be a significant predictor. Additionally, remarkable supplementary prediction was possible due to the impact of the interaction of the two predictors dispositional pessimism and overcommitment (ß= 0.32; p < 0.001) which was also found to be elevating presenteesm.
Summary of Multiple Linear Regression Analysis for Variables Predicting Presenteeism in Participants experiencing an ERI (N = 81)
Note. *p < 0.05, **p < 0.01, ***p < 0.001; B: Unstandardized regression coefficient; SE: Standard error; ß: Standardized regression coefficient. ΔF(I) = 2.99: p < 0.01; R2 = 0.22, Adjusted R2 = 0.15; ΔF(II) = 4.10: p < 0.001; R2 = 0.31, Adjusted R2 = 0.24.
In line with the recommended approach described by Frazier, Tix, & Barron [34] with regard to significant interactions, the empirical structure of the moderation was further investigated using “PROCESS” (Model no. 1). The results are listed in Table 6. The in-depth moderator analysis revealed a significant regression model (ΔF(1, 74) = 5.07: p < 0.001; R2 = 0.28), in which pessimism appeared to be a significant predictor of presenteeism (B = 1.19; p < 0.001) within the meaning of every 1 unit increase in pessimism (score-points), which led to an additional 1.19 units increase in presenteeism (days), as well as part of the significant interaction term overcommitment×pessimism (B = 0.38; p < 0.001).
Summary of Multiple Linear Regression Analysis for Variables Predicting Presenteeism in Participants experiencing an ERI – PROCESS Procedure (N = 81)
Note. *p < 0.05, **p < 0.01, ***p < 0.001; B: Unstandardized regression coefficient; SE: Standard error; ΔF = 5.07, p < 0.001; R2 = 0.28.
The conditional effect of overcommitment on presenteeism was analyzed by interpreting the interaction’s simple slopes (Fig. 2). For participants scoring low (–1 SD of the mean) on the pessimism scale, there was no statistically relevant relationship between overcommitment and presenteeism (b = –.46, t(74) = –1.10; p = 0.27, n.s.). For participants scoring average on the pessimism scale, there also was no statistically relevant relationship (b = 0.51, t(74) = 1.96; p = 0.054, n.s.). There was a statistically significant relationship for participants scoring high (+1 SD of the mean) on the pessimism scale. For them, every additional score-point on the overcommitment scale led to additional 1.49 days of presenteeism (b = 1.49, t(74) = 3.85; p < 0.001). Due to the interaction a R2 increase of 0.12 was documented (F = 10.17: p < 0.01).

Visualization of the spotlight analysis.
Simple slopes plot pessimism (score-points) for the relationship between the level of overcommitment (score-points) and the amount of presenteeism (days) plotted at one standard deviation above and below the mean level of the moderator. The effect of overcommitment on presenteeism depends on pessimism, which is illustrated by the slopes for each line that differ depending on the different values of pessimism. The growing gaps between the three lines indicate that increasing levels of pessimism seem to be responsible for a growing effect of overcommitment on presenteeism [36, 37].
Note: * = p < 0.05.
Floodlight analysis
Using the Johnson-Neyman Technique offered by “PROCESS” for further identifying the significance regions, it became obvious that the first region, where overcommitment had an effect on presenteeism, was at pessimism levels minus 4.68 points of the mean and below (b = –1.27, t(74) = 1.99; p = 0.05). At this minimal level of pessimism, overcommitment had a reducing effect on presenteeism within the meaning; if scoring 0 on the pessimism scale, every additional point on the overcommitment scale led to a decrease of –1.43 days of presenteeism (b = –1.43, t(74) = –2.09; p = 0.04). The second significant region started at pessimism levels of the mean plus 0.02 (b = 0.52, t(74) = 1.99; p = 0.05) and ended at the pessimism scale’s maximum of 12 with continuously increasing effects of overcommitment on presenteeism (b = 3.15, t(74) = 3.72; p < 0.001). For a participant scoring 12 points on the pessimism scale, each additional point on the overcommitment scale resulted in additional 3.15 days of presenteeism. And 43.21% of the participants experiencing an effort-reward imbalance were above the threshold defining the second significance region. This means that for this group the moderating effect of pessimism on overcommitment was of importance because these participants had scored the crucial amount of pessimism (mean+ 0.02), so that overcommitment started to have an increasing effect on presenteeism. For the group below the second threshold but above the first threshold (pessimism scores >0, <5), overcommitment did not matter as a predictor of presenteeism, simply because the participant’s pessimism scores were too high to have a decreasing effect on presenteeism and too low to have an increasing effect on presenteeism (see Fig. 3).
In summary, using Cohen et al.’s [38] classification of interactions, for participants in the high-stress group (ERI+, OC+) showing minimal scores of pessimism, we found a buffering interaction within the meaning of the moderator variable (pessimism) weakening the predictor variable’s (overcommitment) effect on the outcome. For participants in the high-stress group (ERI+, OC+) showing a pessimism score of at least 5, we found an enhancing interaction in which the predictor (overcommitment) as well as the moderator (pessimism) were affecting the outcome in the same direction and together were exceeding the single component’s effects [34].
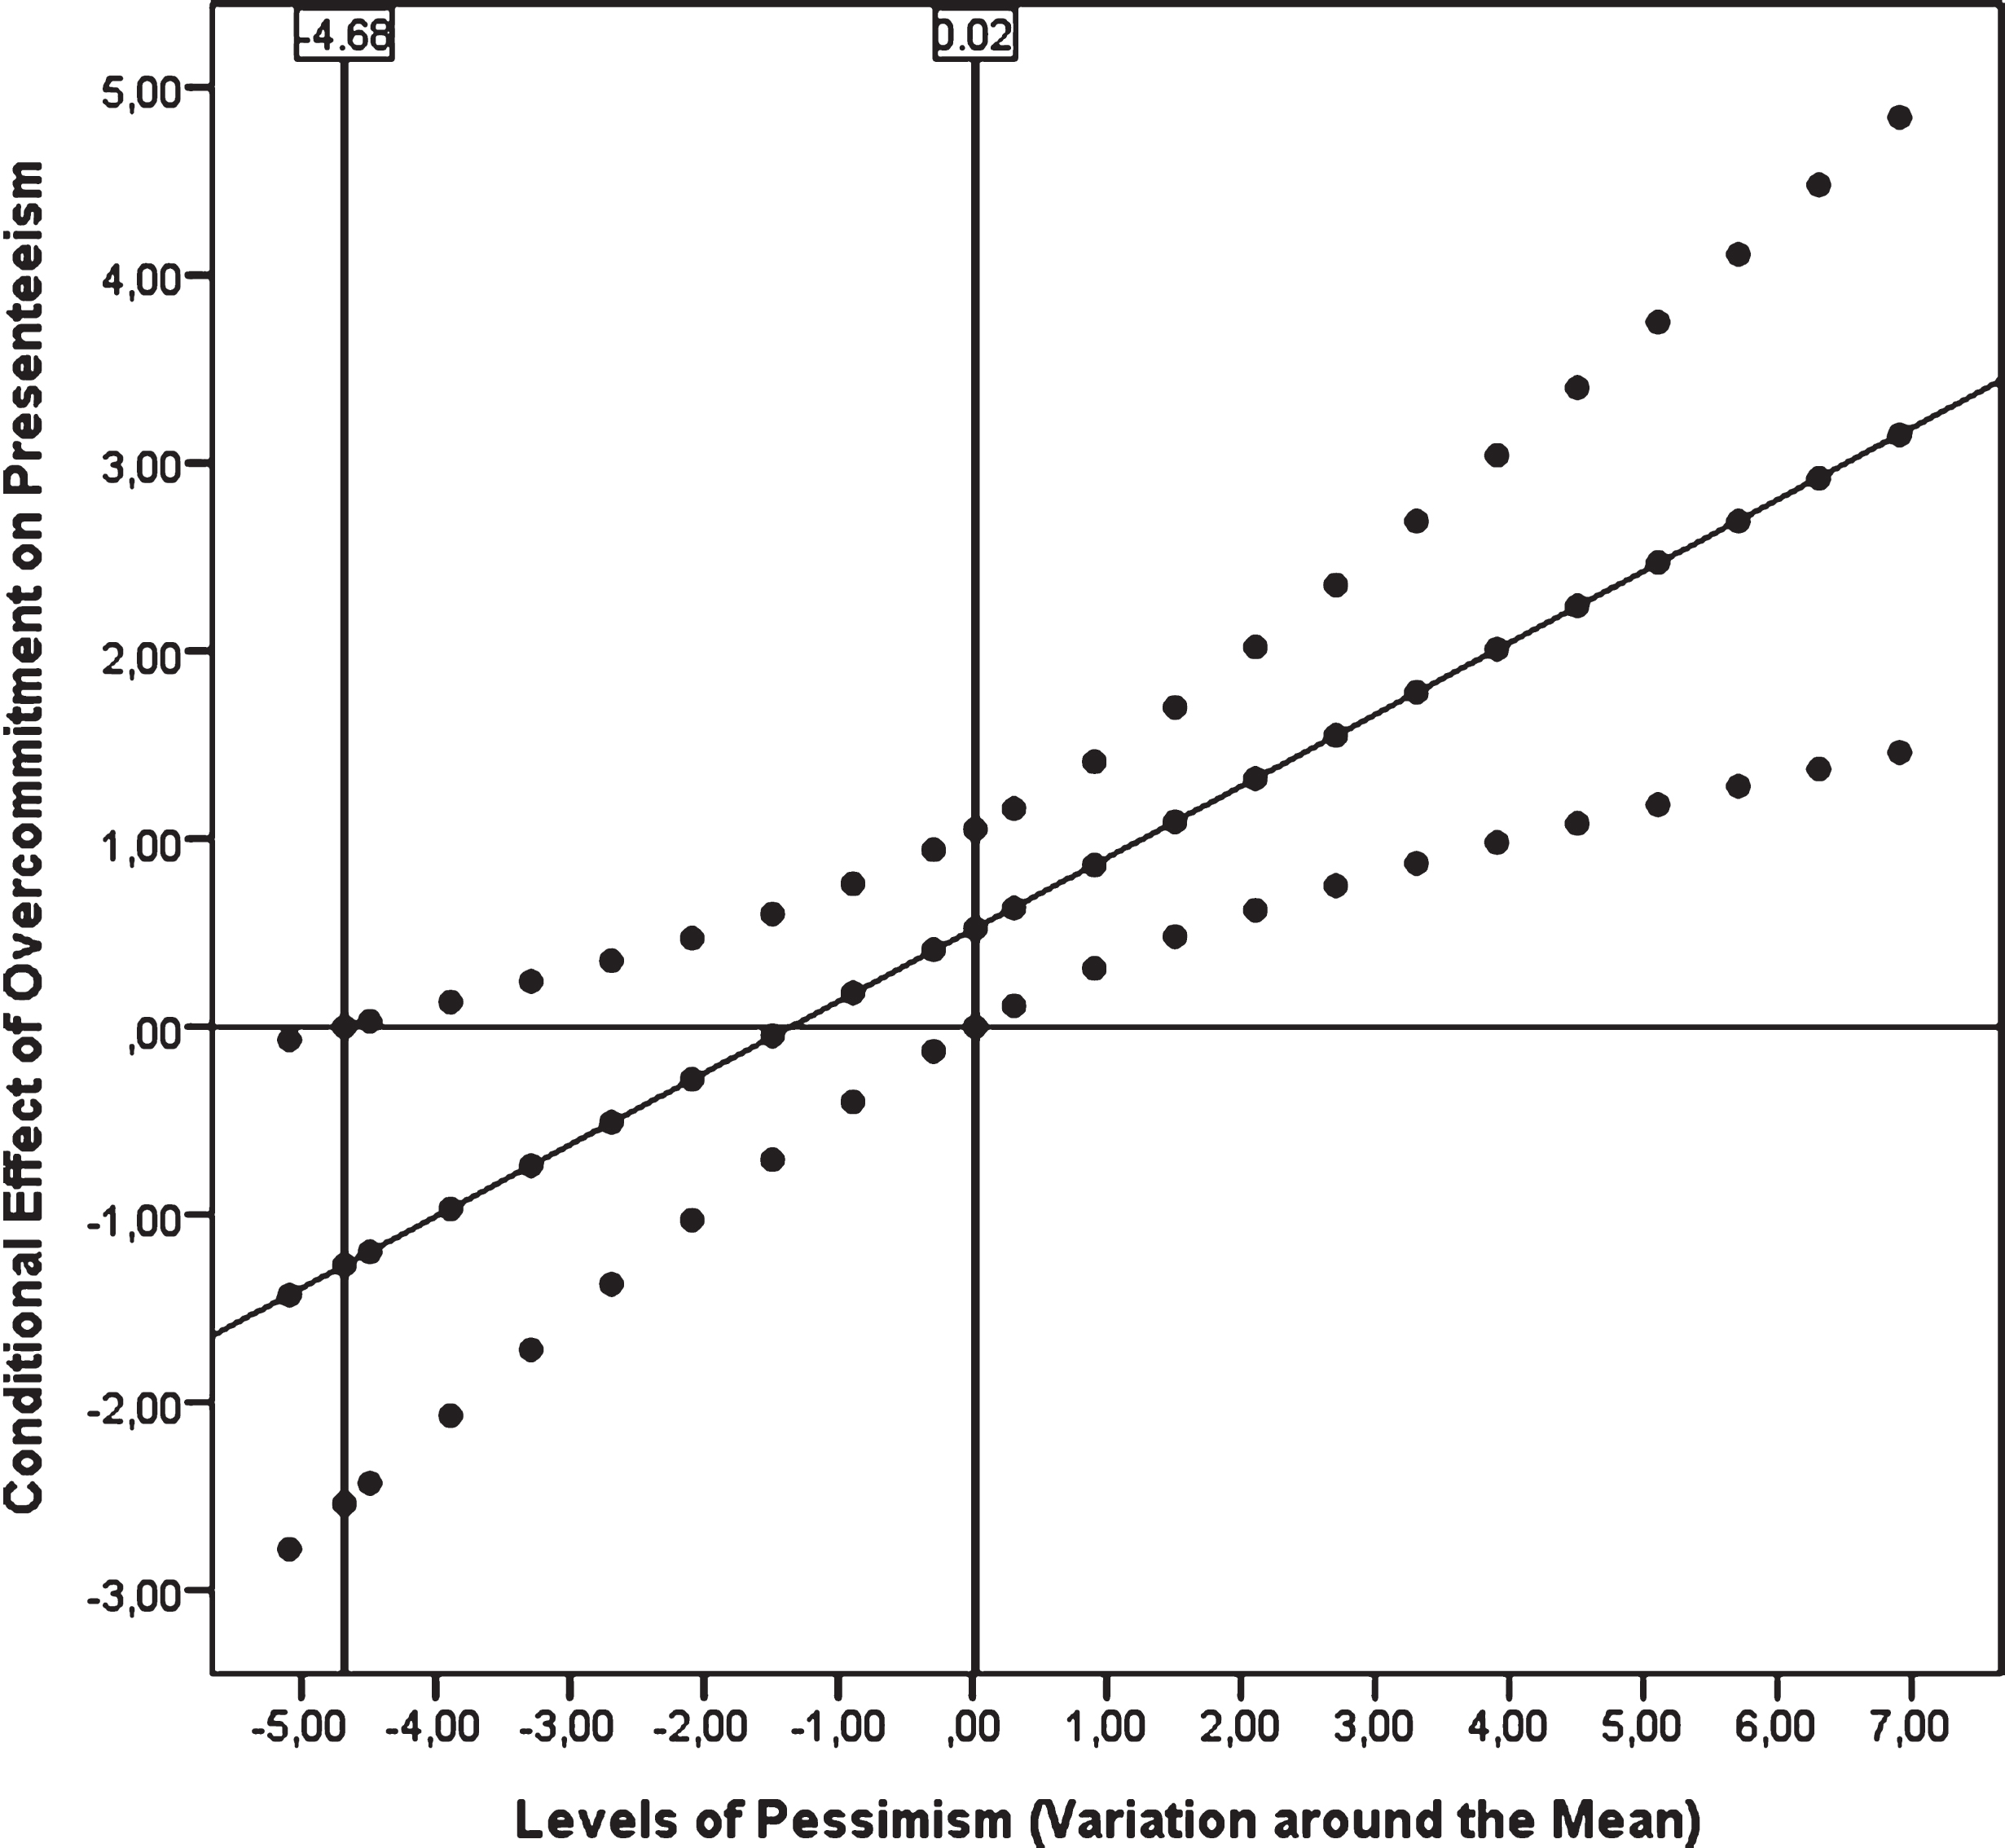
Visualization of the floodlight analysis.
Estimated conditional effect of the relationship between overcommitment and presenteeism were plotted against all possible values of pessimism. The hyperbolic dots represent the upper and lower limit of the 95% confidence intervals (confidence bands) surrounding the dotted point estimate line at each level of the moderator, pessimism. The first vertical black line limits the first region of significance. This threshold is the first Johnson-Neyman point, the level of pessimism at which the decreasing relationship between overcommitment and presenteeism stops being significant and the upper confidence band crosses the zero point. The second vertical black line represents the beginning of the second region of significance. The second Johnson-Neyman point defines the level of pessimism at which the increasing relationship between overcommitment and presenteeism starts being significant and the lower confidence band crosses the zero point. Evidently, at M≤–4.68 below the mean and M≥0.02 above the mean, the confidence bands are completely below or completely above zero. Confidence bands are the closest at the mean level of pessimism [36, 39].
Discussion
The present study used self-reported data from The Saxony Longitudinal Study in order to discover the prognostic potential of effort-reward imbalance including overcommitment in due consideration of dispositional pessimism in predicting presenteeism. The results could neither support the hypothesis linking the experience of an effort-reward imbalance to increased presenteeism (Hypothesis 1) nor the hypothesis that expected predictive potential of effort-reward imbalance concerning presenteeism (Hypothesis 2). On the other hand, with reference to Hypothesis 3, dispositional pessimism was found to be a significant predictor of presenteeism, albeit limited to those participants experiencing an effort-reward imbalance. Mentionable profit was realized by discovering the strong predictive potential of the interaction effect between overcommitment and pessimism for participants in the high-stress group (ERI+, OC+). A potential explanation lies in the two predictors’ nature within the meaning of both being classified as traits and, furthermore, sharing a link towards a critical style of coping behavior. Especially the latter implicates a substantive explanatory approach according to Siegrist and Li [2], who argue that one has to consider the prominence of individual coping strategies regarding work stress when aiming at the grueling work environment’s implication on health. In the framework of a multiple linear regression model, we did not find proof for the notion that extrinsic components (ER ratio) of work stress interact with the intrinsic component (overcommitment) in a way which exceeds the single effects on health [2]. However, by splitting the sample in participants experiencing an effort-reward imbalance and those who did not, a different approach was used to highlight the importance of the extrinsic components of effort-reward imbalance regarding adverse health effects. As a matter of fact, those participants experiencing an effort-reward imbalance could without exception be labeled as overcommitted, which corresponded with the notion of high-stress combination (ERI+, OC+). Although this high-stress group did not differ from the low-stress group (ERI–, OC±) in terms of the amount of presenteeism, we found significant predictive potential concerning dispositional pessimism and notably the interaction effect between dispositional pessimism and overcommitment for the high-stress group. Consequently, in the high-stress group defined by the extrinsic components, successfully predicting presenteeism was the intrinsic component’s merit. On the one hand, this finding adds little to the already existing knowledge of overcommitment working as a moderator regarding the adverse effects of effort-reward imbalance on health. On the other hand, the recentness of dispositional pessimism’s importance as a single significant predictor of presenteeism, and furthermore as part of an interaction with overcommitment, which has a strong predictive potential, has extensive consequences.
Overcommitment itself showed no statistical significance as a predictor of presenteeism. Obviously, the sheer incapacity regarding the pullback from work obligations overcommitted participants are confronted with is not satisfactory while trying to explain presenteeism [40]. One possible explanation might be that the importance of pessimism results from the pessimist’s tendency to have a greater awareness of physical symptoms indicating sickness, an idea similar to Glaesmer et al. [32] who associated higher levels of perception regarding potential detrimental health effects with higher manifestations of pessimism. Under the premise of presenteeism being considered a noxious behavior, there is another link to pessimism for the simple reason that the latter is in immediate proximity to health-damaging behaviors [17]. With chronic stress (ERI+, OC+) linked to higher levels of pessimism, and pessimism being believed to influence the self-rating of health, pessimists finding themselves in this vicious circle probably cannot put a good face on the matter, resulting in the valuation of being sick at work. As the in-depth moderator analysis revealed, the absence of self-rated pessimism is even associated with decreasing levels of presenteeism. A participant from the high-stress group may be at work despite feeling unwell, but as long as minimal levels of pessimism go along with this scenario, the probability of reporting presenteeism is reduced. This idea is in line with the findings of Mroczek et al. [41], who found pessimism to be correlated with illness severity as well as more tightly associated to health than optimism [42]. The relevance of dispositional pessimism in predicting presenteeism in participants experiencing an effort-reward imbalance might have further consequences. There are already existing suggestions dealing with the expansion of the span of further intrinsic factors potentially modifying the relation between effort-reward imbalance and adverse health effects [2]. In conclusion, this study found indicators that substantiate Rasmussen et al.’s [18] notion “[…] that it is the presence or absence of pessimism that is important in determining physical health outcomes rather than the presence or absence of optimism” [p. 11].
Limitations
One limiting factor is the potentially poor ability and/or motivation of the participants to correctly remember the questioned events and their frequency retrospectively for a recall period of one whole year, partly explainable by mnemonic bias [43, 25]. Beyond that, the amenability to memory, the content’s social desirability as well as the criterion of verifiability are limiting weak points in the design of self-report measures [43, 44]. There is reasonable suspicion in matters of self-report metes of illness being affected by circumstantial factors as well as by cognitive or affective states [45]. We encountered this uncertainty by offering free response format as advised by Schwarz [46] when measuring presenteeism to avoid biasing the participants by rigid numerical scale formats [43]. Nevertheless, we are well aware of the perils that go along with the sole utilization of self-reports, namely, as reported by Podsakoff et al. [47], common method variance and thereby potentially superelevated relationships among major variables [43]. Especially the potential augmentation of self-reported physical illness through psychological states, variables that are strongly affiliated with each other, is a well-known problematic issue [45, 48]. Interpretative caution is needed regarding the first region of significance and its decreasing effect on presenteeism. Hayes’ [39] warning, that sometimes “There simply is not enough data in this end of the distribution to be confident in the claim that […]” [p. 244] overcommitment has a decreasing impact on presenteeism in participants showing zero levels of pessimism is legitimate for our data.
Implications for future research
Given the fact that this study completely relied on self-reported levels of presenteeism as our dependent variable, its “softer” nature as a disease endpoint has to be kept in mind [18]. Using “harder” disease endpoints, as for example biomarkers, could constitute a possible improvement, since this approach would not only allow a statement regarding presenteeism’s individual long-term health adverse consequences but also regarding its potential in serving “[…] as a vector of disease transmission” [49, p.1244]. In connection with the aforementioned considering applicable ways and means in terms of fostering employee’s health as well as implementing occupational stress management has to be perceived as an important imperative [50, 51]. Finally, using a more sophisticated questionnaire to measure presenteeism as for example the Work Role Functioning Questionnaire could allow to depict the employee’s tendency to go to work while sick more precisely [52].
Conflict of interest
None to report.
Footnotes
Appendix
Independent sample t-test was performed to discover whether or not the participants from the Saxony Longitudinal Study differed significantly regarding optimism and pessimism scores from the norm sample of the German version of the Life-Orientation-Test (LOT-R) for dispositional optimism and pessimism [32]. Correspondent to the age structure of our sample, the norm sample’s age group 31–40 years (N = 410) was applied. To determine possible differences in the levels of the independent variables as well as of the dependent variable between the group being unaffected by ERI and the one being affected, independent sample t-tests were conducted.