
Abstract
BACKGROUND:
Grip strength is an objective measure of a person’s hand functionality and upper limb strength. In Asia, there is a lack of normative data for grip strength among the population, especially in South Korea.
OBJECTIVE:
The objective of this study was to evaluate the grip strength in various body postures and gender in the adult South Korean population.
METHODS:
A total of 100 male and 64 female subjects participated in this study. Their grip strengths were measured using a standard adjustable Jamar handle dynamometer.
RESULTS:
The results showed that their grip strength differed statistically by gender, handedness, and posture. Their gender and right-hand length were the most significant predictors of their grip strength. The Asian population, including South Korea, showed a lower grip strength than the European and American populations in previous studies.
CONCLUSIONS:
The present study showed that the maximal isometric grip strength is affected by gender, handedness, posture, and population. Thus, gender-, population-, and posture-specific grip strength data are essential for clinical and industrial applications.
Introduction
Grip strength provides an objective measurement of hand function integrity [1]. Accurate measurement of grip strength is very important in evaluating the effectiveness of surgical procedures or rehabilitation and designing hand tools or devices. In particular, relevant and current grip strength data are essential when designers are developing products for humans [2]. In addition, grip strength typically is measured by occupational or physical therapists who perform hand therapy in rehabilitation settings. This measurement has proven to be a reliable, valid, and objective parameter to evaluate the use of the hands [3, 4].
The Jamar Handle Dynamometer is used commonly to measure grip strength because of its convenience and reliability in testing various handle shapes [5]. Grip strength typically is measured when users squeeze the handle with the four fingers to the palm [6]. This dynamometer was introduced more than 50 years ago [7] and remains a simple and quick method to measure a person’s grip strength. Over the years, many researchers have studied the measurement of grip strength under various conditions, including body posture, age, gender, and patient type [8–14].
Several factors affect grip strength, including dominant hand, gender, shoulder, forearm, and whole-body postures, and anthropometrics. Previous studies have shown that the dominant hand is approximately 10% stronger than is the nondominant [15–18], and grip strength is greater among males than females in comparable age groups [19]. When flexed at 180° with the elbow in full extension, the shoulder demonstrates the greatest grip strength, while the elbow flexed at 90° with the shoulder in 0° demonstrates the lowest [20, 21]. In addition, pronation shows lower grip strength than do neutral and supination for both males and females [22].
Previous studies have developed normative data for specific populations. Anjum et al. (2012) conducted a comparative evaluation of grip strength in Asian and European populations [23]. The mean grip strength for Asians was 412.6N (right hand) and 392.9N (left hand) among males and 235.2N (right hand) and 228.3N (left hand) among females, and Europeans showed greater grip strength than Asians. This was consistent with another study that demonstrated that Caucasians’ grip strength typically is greater than that of Asians [24]. Thus, the grip strength values of American or European populations might not be comparable to those of the Asian population, as the former two groups generally have greater grip strengths. However, normative data for grip strength under various conditions are lacking in the Asian population, particularly in South Korea.
The goal of this study was to evaluate grip strength according to various body postures and by gender in the South Korean population. Specifically, we targeted the grip strength of males and females under various conditions, including handedness, lower body posture (standing or sitting), and shoulder (0, 90, and 180°), and forearm posture (pronation, supination, and neutral), and compared the various grip strength values in this study with those in previous studies of different populations.
Methods
Participants
A total of 100 male and 64 female graduate and undergraduate students participated in this study. All of the participants were right-handed and had no history of illnesses or injuries in their upper extremities in the past three years. The average standard deviations (SDs) for age, height, weight, hand width, and hand length of the participants were 22.8 (SD 2.1) years, 170.5 (SD 7.2) cm, 67.8 (SD 10.0) kg, 7.8 (SD 0.7) cm, and 17.6 (SD 0.9) cm, respectively. Detailed anthropometric information about each gender is in Table 1.
Mean±SD of anthropometric variables of participants
Mean±SD of anthropometric variables of participants
Hand width and length were measured using Martin’s Anthropometer (GPM Model 113, Switzerland). This device was used to control the shoulder postures for all participants. An adjustable chair was used for a sitting posture, and the height was adjusted to the comfort of the participants. The grip strengths were measured using a standard adjustable Jamar Handle Dynamometer (Model J 00105, Lafayette Instrument Company, USA) in all experimental conditions. For standardization, the dynamometer was set at the second or third handle position depending on which the participant claimed to be more suitable [25]. For most of the participants, the second position was considered to be the best level for grip evaluation, and it was adopted by the American Society of Hand Therapists for routine testing [26].
Each participant was provided with an informed consent form and a brief description of the experimental procedures. The participants were instructed to exert maximal isometric gripping strength for three seconds by squeezing the handle of the Jamar Dynamometer, with two-minute breaks between experimental conditions. This was repeated three times to obtain an average maximal isometric gripping strength value. The participants performed 36 random trials according to the experimental conditions.
Experimental design
The independent variables of a 2×2×2×3×3 mixed design were used with two levels of gender (male and female), two levels of handedness (right and left), two levels of lower body posture (standing and sitting), three levels of shoulder posture (0°, 90°, and 180°), and three levels of forearm posture (pronation, supination, and neutral). The dependent variable was the maximal isometric grip strength (Unit: N). The SPSS 24.0 (SPSS Institute Inc.) was used to perform the analyses of variance (ANOVA), followed by Tukey’s Studentized Range (HSD) Test at a significance level of 0.05. A stepwise multiple linear regression was performed to find significant predictors for the grip strength. After the selection of these predictors, a multiple linear regression model was conducted to predict the grip strength as a function of anthropometric measures.
Results
Main effects
Grip strength by gender
The grip strength differed significantly by gender (P < 0.0001) (Table 2). Male subjects showed a higher grip strength than female subjects. The mean grip strengths of the male and female subjects were 457.58N and 223.58N, respectively. The mean grip strength of the female subjects showed a 48.9% decrease from that of the male subjects (Table 3).
Summary of statistically significant main effects and two-way interactions (P-values)
Summary of statistically significant main effects and two-way interactions (P-values)
*Indicated P-values <0.05.
Mean±standard deviation of grip strength as a function of independent variables
Note: A and B represent statistically significant Tukey HSD groupings.
The grip strength differed significantly by handedness (P < 0.0001) (Table 2). Right hand grips (369.61N) showed a higher grip strength than left hand grips (362.92N). Overall, the mean difference among values of handedness was about 7N (Table 3).
Grip strength by posture
The grip strength differed significantly by lower body (P < 0.0001), shoulder (P < 0.0001), and forearm posture (P < 0.0001) (Table 2).
Standing (368.98N) showed a higher grip strength than sitting (363.55N). Shoulder posture with 0° (372.62N) showed the greatest grip strength, followed by 90° (364.32N) and 180° (361.86N). Shoulder postures of 90° and 180° were not significantly different. Neutral forearm posture (371.90N) showed the highest grip strength compared to neutral (363.60N) and supination forearm postures (363.30N) (Table 3). Grip strengths of pronation and supination postures were not significantly different.
Two-way interaction effects on grip strength
The interaction between gender and lower body posture had significant effects on the grip strength (P = 0.006) (Table 2). The male subjects who were standing showed the greatest grip strength (458.56N), while the female subjects who were sitting showed the lowest grip strength (218.16N) (Fig. 1a). The interaction between the forearm postures and lower body postures showed significant effects on the grip strength (P < 0.0001) (Table 2). A neutral forearm posture while standing showed the highest grip strength (380.19N), whereas a supination posture while standing showed the lowest grip strength (363.04N) (Fig. 1b).
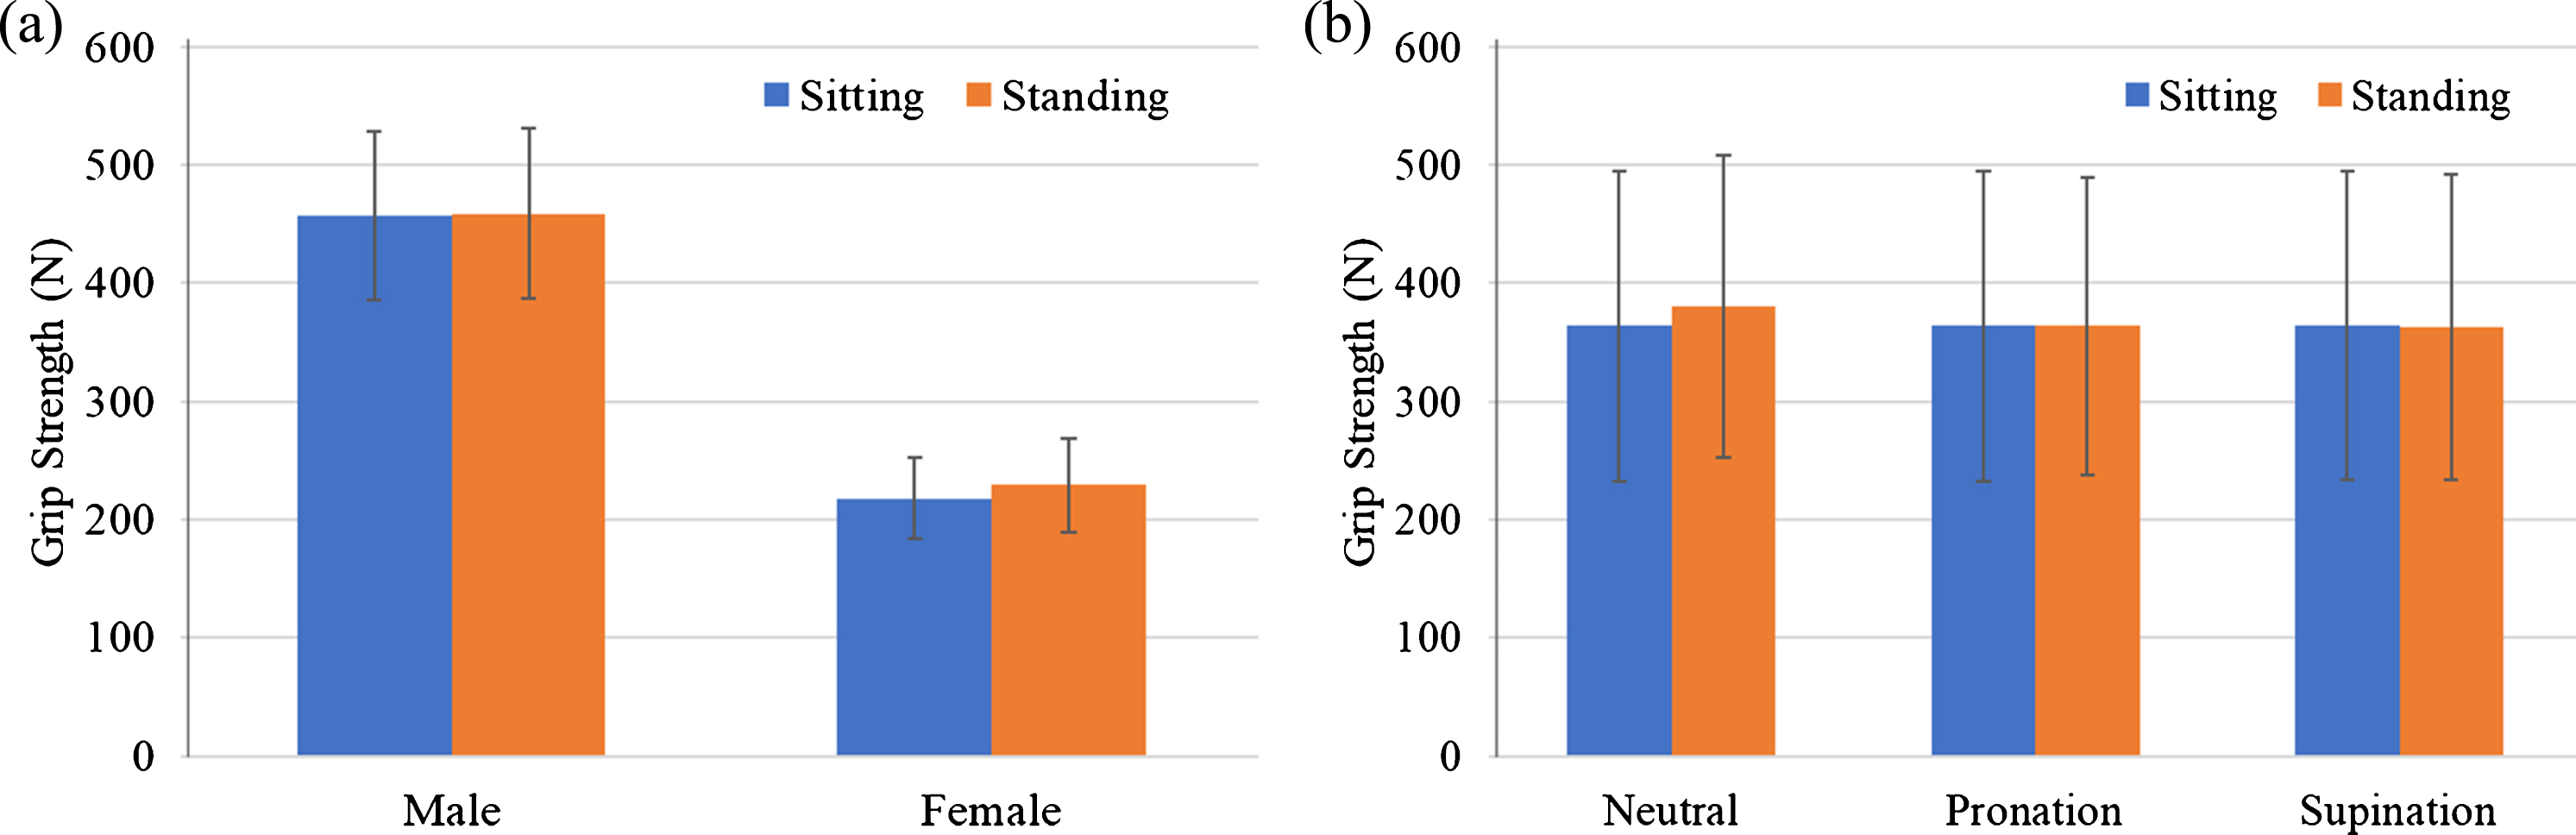
Mean±standard deviation of grip strength of two-way interaction by (a) gender and lower body posture, and (b) lower body posture and forearm posture.
The linear regression model was statistically significant (P < 0.0001), and Table 4 shows the linear regression coefficients and performance for predicting the grip strength as a function of anthropometric variables. The coefficient of determination (R2) of the grip strength was 0.798, and the root-mean-square-error (RMSE) of the grip strength was 58.17N. Gender was the most significant predictor of the grip strength (an average 206N decrease for females), followed by the right-hand length (an average 25N increase per 1 cm).
Linear regression coefficients, R2, P-values, and RMSE (N) for prediction of grip strength (N) as a function of anthropometric measures
Linear regression coefficients, R2, P-values, and RMSE (N) for prediction of grip strength (N) as a function of anthropometric measures
*Indicated P-values <0.05. Male = 0; Female = 1; RMSE = root-mean-square-error of grip strength (N).
The grip strength of the present study group was compared with data from previous studies as a function of the population, gender, and handedness (Table 5). Within the Asian population, which includes South Korea, China, Taiwan, Malaysia, Turkey, and Singapore, the grip strength of the participants in Turkey was the highest among the males (515.63N), followed by South Korea (457.58N). As for the females, Turkey had the highest grip strength, followed by South Korea (251.54N). The right-handed results indicated that Turkey had the highest grip strength (434.09N), and South Korea ranked third (369.61N). For the left-hand grip strength, Turkey had the highest value (405.11N), and South Korea again ranked third (362.92N).
Comparison of grip strength (N) with previous studies
Comparison of grip strength (N) with previous studies
Note: A = only data of 20 s age was included.
Within European population, including Australia, Germany, Switzerland, Turkey, UK, and Spain, Germany had the highest grip strength among both males (531.16N) and females (332.22N). In terms of the handedness, the UK demonstrated the highest grip strength of the right hand (392.00N), and Germany had the highest value for the left hand (362.85N).
Within the U.S. population, the highest grip strengths were 608.55N and 321.83N for males and females, respectively. As for handedness, the highest grip strengths of the right hand and left hand were 433.85N and 496.57N, respectively.
For the comparisons across different populations, the average grip strength of Asian males and females (397.94N and 243.82N) was much lower than the values for Europe (463.28N and 282.99N) and the United States (483.02N and 271.54N). European and U.S. populations showed similar grip strengths for both males and females.
The present study showed that both male and female grip strengths were significantly affected by gender, handedness, and postures. In addition, there were statistically significant interaction effects between gender and lower body posture and between forearm postures and lower body postures on the participants’ grip strength.
Male subjects had a grip strength 2.05 times higher than that of female subjects. Previous studies also showed that larger males produced a higher grip strength than females [9, 28]. The differences in the grip strength between the right and left hands were statistically significant, as the right-hand grip had a grip strength 1.8% higher than that for the left hand.
The difference in the grip strength between standing and sitting was statistically significant as the standing grip strength was 1.5% higher than when sitting. This finding was similar to a previous study that showed a significant difference between the grip strength while sitting with the elbow at 90° flexion and standing with the elbow in full extension [28].
A shoulder posture with 0° resulted in a 3% higher grip strength than at 180°. A neutral forearm posture produced a 2.4% greater grip strength than that of supination postures. This finding was similar to a previous study, which reported that shoulder and elbow angles both had significant effects on the grip strength [29].
In terms of the interaction results, the standing male subjects’ grip strength was 2.09 times greater than females who were sitting. A neutral forearm posture while standing generated a 4.7% higher grip strength than the supination forearm posture while standing.
Based on the regression analysis, gender was the most significant predictor of the results, followed by the right-hand length of the grip strength. Males with a longer right-hand length tended to have a greater grip strength among the South Korean adults. This finding was similar to a previous study that reported the grip strength was associated with the hand anthropometry [30]. In addition, another study reported that gender, age, and palm length were the primary predictors of grip strength [31].
The average grip strength among the Asian population, including the present study, produced lower values than the grip strength in Europe and the United States (Table 5). A previous study also had similar findings in that the grip strength of western populations was as much as 1.5 times higher than among the Malaysian population [19]. This indicated that the grip strength of western populations cannot be directly applied to the Asian population, as a specific data set for the Asian population is needed.
This study has several limitations. First, only young adults were considered. Thus, the effect of age on grip strength was not investigated in the present study. The regression model could not be applied. A future study can collect the grip strengths of different age groups from young to elderly subjects, and the association between age and grip strength can be further investigated. Second, the effect of hand dominance was not considered. Our study reported on the grip strength of the left and right hands of the right-handed subjects only. A future study can consider the effect of hand dominance by recruiting equal numbers of left-handed and right-handed subject groups.
Conclusions
This study evaluated the maximal isometric grip strength in various body postures, including the lower body, shoulders and forearms, handedness, and gender among South Korean adults. Results showed that that the maximal isometric grip strength was affected by gender, handedness, and the postures. Male subjects’ grips were 2.05 times stronger than female subjects. Grip strength while standing was 1.5% higher than while sitting. Neutral shoulder and forearm postures showed a 2% to 3% higher grip strength than for non-neutral postures. For the interactions, male subjects while standing generated 2.09 times more grip strength than female subjects did while sitting. Based on the multiple linear regression analysis, gender was the most significant predictor, followed by the right-hand length of the grip strength. Males with a longer right-hand length tended to have the greatest grip strength.
For the comparisons of grip strength among different populations, the grip strength in Western populations was 1.2 times higher than among the Asian population, including South Korea. These findings indicated that gender-, population-, and posture-specific grip strength data provide essential information for clinical and industrial applications.
Conflict of interest
The authors have no potential conflicts of interest to report.
Footnotes
Acknowledgments
This work was supported by a grant from the National Research Foundation of Korea (NRF-2015R1C1A1A01055231), which is funded by the Korean government (MEST).