
Abstract
BACKGROUND:
Outdoor workers are exposed to heat caused by atmospheric conditions and solar radiation. More specifically, those working in palm groves are more in danger of heat stresses since they harvest their crops in hot seasons.
OBJECTIVE:
This study was aimed at investigating heat stresses and strains in date harvesting workers in groves around Jiroft, Southeastern Iran.
METHODS:
This study was a descriptive-analytical one of cross-sectional type. In this study, three environmental indices including Wet Bulb Globe Temperature index (WBGT), Environmental Stress Index (ESI) and Discomfort Index (DI), the physiological strain index (PSI) as well as perceptual strain index (PeSI) were analyzed to investigate stresses and strains in workers. For this purpose, 59 date harvesting workers (36 men and 23 women) in palm groves in Jiroft were analyzed. With accordance to date harvesting season, data collection was carried out from August to September, 2017.
RESULTS:
In this research, the means of environmental indices including WBGT, ESI and DI were 32.77°C, 30.39°C and 33.22°C, respectively and they all revealed direct and significant correlation. Moreover, Time-Weighted Average for Wet Bulb Globe Temperature index (WBGT.TWA) was significantly different from Threshold Limit Values for Wet Bulb Globe Temperature index (WBGT.TLV). The scores of the PSI and PeSI were 2.28 and 6.61, respectively.
CONCLUSION:
The results of this study indicated that date picking workers were exposed to heat stress more than the reference value of WBGT recommended by American Conference of Governmental Industrial Hygienists (ACGIH). In addition, workers suffered a low degree of physiological strain and a moderate degree of perceptual strain caused by heat stress in palm groves in Jiroft.
Introduction
Heat stress is recognized as one of the factors affecting the health of workers in workplaces, especially in developing countries. This harmful physical factor can cause occupational diseases in workers and might even result in their death. In this regard, identifying these factors can play an important role in preventing work-related accidents and diseases, reducing costs, reducing lost hours in the workplace and ultimately increasing the efficiency of the personnel [1]. Consequences of exposure to heat at work are firstly indicated by heat strain, which occurs as a rise in heart rate and body temperature [2]. Prolonged exposure to heat strains may lead to a wide range of complications and disorders such as muscle cramps, heat fatigue, skin rash, heat syncope, heat stroke, decreased physical and mental performance, neuropsychiatric symptoms and decrease in consciousness and perception. Consequently, it leads to decreased productivity, increased accident rates and reduced safety levels in the workplace [1, 4]. In mild and moderate disorders including muscle cramp and heat fatigue, the body temperature adjustment mechanism in hypothalamus is not damaged, but in heat shock, the body temperature adjustment mechanism is disturbed and life of the individual is endangered [4]. Heat stroke is caused when the internal temperature of body reaches 39.5 C°(103 F°), in this state, the function of several body parts is disturbed simultaneously and it may lead to death within several hours [5, 6]. Even the overheated persons who escape death may be at risk of premature death in the future [7]. Heat is a risk factor for cardiovascular diseases, in addition, it can also cause death of people with underlying diseases such as cardiovascular ones [3, 8]. The number of deaths caused by heat stress in the workplace in the United States and Canada has been reported 220 people annually [5]. Based on what has been said so far, the workplace heat can pose serious problems to business owners who work in indoor or outdoor environments, with heat problems in outdoor environments more likely to arise [9]. A research study in Thailand showed a 10 to 60 percent reduction in productivity in construction and pottery workers (outdoor industries) [10].
Many efforts have been made to estimate the heat stress imposed on individuals in the workplace in order to express the conditions in the workplace with a number [11]. In general, the indices developed in this field determine environmental heat stress or physiological strain. These environmental indices include Wet Bulb Globe Temperature (WBGT), Environmental Stress Index (ESI), and Discomfort Index (DI). WBGT is one of the main indices to assess warm environments, which was introduced in 1957 by Yaglou and Minard [3, 13]. ESI and DI indices are used to estimate environmental stress and discomfort, respectively [14, 15]. DI is also recommended for assessing warm environments as a supplement index of WBGT. Based on their research results, Epstein et al. suggested that DI could be applied as a global heat stress index [11]. In addition, heat fatigue and heat strain are the physiological responses of the body to heat stress. Moran et al. developed the physiological strain index (PSI) for the evaluation of heat strain [16]. Heart rate and core body temperature (including oral, tympanic and rectal temperatures) are heat strains aimed to determine PSI [17, 18]. The American Conference of Governmental Industrial Hygienists (ACGIH) also introduced heart rate as a primary physiological index sensitive to heat [19]. Accordingly, Logan et al. investigated heat stress and heat strain by measuring heart rate and core body temperature [20]. Minnard also reported that if the average heart rate exceeds 115 beats per minute during an eight-hour work shift, the physical performance of workers would be reduced [21]. Perceptual strain index (PeSI) was proposed by Tikuisis et al. measuring the heat strain in individuals via thermal sensation and the intensity of perceived exertion [22]. This index is in fact a method of assessing the heat risk of heat strain through perception. The process of assessing the risk of heat strain is indeed a management decision tool, and its results can be used to prioritize different workstations based on heat strain and conduct the interventions.
Outdoor workers are exposed to heat caused by atmospheric conditions and solar radiation and this has become more acute due to global warming [12]. In other words, the increase in global warming leads to facing more heat. Among all, since outdoor workers are more encountered with process heat and heat conditions, they are more exposed to risk, they have inadequate physiological adaptation capacity and are not well aware of the possible risks and control measures [12]. Nearly two billion outdoor workers (predominately in Africa and Asia) are exposed to damage under the influences of climate change [23]. In this regard, the rate of heat-related deaths in agricultural production workers (active outdoors) is approximately 20 times more than that of workers of other industries [24]. The city of Jiroft is considered the agricultural pole of southeastern Iran. The agricultural prosperity along with the warm and wet climate made damage and work-related illnesses in the farmers of this region more prominent and worthy of attention. Among them, date palm farmers are more at risk of heat stress damages since harvesting takes place during the warm season (July, August, and September). Investigating heat stress and heat strain was much more important in date harvesting due to the participation of children and women (harvesting was often done by families). Therefore, this study was aimed to investigate heat stress and heat strain in date harvesting workers in palm groves in Jiroft.
Materials and methods
Profiling participants
This cross-sectional study was a descriptive-analytical study. The sample size was determined to be 62 using mean estimation formula. On this basis, the data were gathered from 74 subjects working in palm groves in Jiroft. Some parts of the collected data were not used for various reasons; some subjects left the work in the middle of work shifts and some were diagnosed with hypertension during the test. Finally, the data, which were collected from 59 date harvesting workers, were analyzed. The studied palm groves were selected via a simple random sampling method from palm groves in Jiroft. For the investigation of the environmental parameters, data on physiological and perceptual parameters were collected via a convenience sampling method from date harvesting workers in these palm groves. With accordance to the date harvesting season, data collection was carried out from August to September.
Before starting to measure physiological parameters, according to inclusion and exclusion criteria, those subjects who suffered from infectious and febrile illnesses, diabetes, hypertension, hypothyroidism, hyperthyroidism and cardiovascular diseases and those who were taking antibiotics or drugs effective in heart rate were excluded from the study. Subjects were also asked to refrain from eating, drinking and smoking for at least 30 minutes before the test, and they were asked not to drink alcohol at least 12 hours before the test. Concerning acclimatization to heat, due to the inclusion of local subjects with long work experience (date harvesting begins from childhood), all workers were considered acclimatized to heat. Prior to conducting the research, all stages of the study were reviewed for ethical considerations and the present contribution adhered to the guidelines and ethic codes set out by the Ethics Committee of Vice Chancellor for Research at Jiroft University of Medical Sciences. Moreover, the objective of the research and research methodology were fully explained to workers, and they were assured that their personal information would remain confidential.
In one day, the environmental and physiological parameters (also measured while resting) were measured in five-time intervals including the beginning of the work shifts from 6 to 7, 7 to 9, 9 to 11, and 11 to 13, as well as the end of the work shift from 13 to 14. In order to increase the accuracy of measuring environmental parameters, measurements were performed three times in each time interval and their mean was recorded. Perceptual strain index data were also collected at the end of the work shift.
Measurement of environmental parameters and heat indices
Wet Bulb Globe Temperature (WBGT): Parameters effective in calculating WBGT index based on ISO7243 standard (25) included natural wet bulb temperature (tnw), globe temperature (tg) and dry-bulb temperature (ta). With accordance to ISO 7243 standard, outdoor WBGT index is calculated as follows:
Since the environment of palm groves was congruent in terms of temperature, measurements were conducted in the waist of the workers (110 centimeters). Moreover, the WBGT measurement tool was placed in palm groves for at least 20 minutes so as to reach the same temperature as the environment and measurements were then carried out. Since outdoor environment conditions vary throughout the day, in this study, based on ISO 7243 standard, Time-Weighted Average for WBGT index was calculated as follows:
WBGTn: Wet Bulb Globe Temperature index at different times of work shift (°C)
Tn: Exposure time (hour)
The metabolic rate of individuals during a work shift was determined according to ISO 8996 and with accordance to workload [26]. Date harvesting involves three tasks: a. the task of picking dates (a person climbs the tree to pick dates), b. the task of helping the date picking (workers hold a cloth at the bottom of the tree so that dates fall over it to be collected) and c. the task of packing (putting dates in boxes), which is usually done by women in the shade of the trees (Fig. 1). After careful examination of these tasks and based on ISO 8996 standard, the workload of each one was defined as heavy, moderate, and light as compared with WBGT.TLV.

Three tasks of date harvesting: a. picking dates, b. helping the date picking, c. packing.
The clothes of the subjects of this study varied according to gender. Men wore light local clothes (Balochi) and women chose their clothes according to the customs of the local culture (with hijab). Accordingly, based on ISO 9920 standard [27], the estimated clo for men and women was 0.72 and 0.8, respectively. Finally, considering the workload of each individual (heavy, moderate, and light), the duration of exposure to heat in work environment (work-rest rhythm) and the metabolic rate, the measured values were compared with ISO7243 standard heat index.
Environmental Stress Index (ESI): In order to calculate the ESI, three parameters including relative humidity (RH), dry bulb temperature (ta) and solar radiation (SR) were needed. ESI was calculated as follows [14]:
Discomfort Index (DI): Based on the formula for calculating DI, two parameters including wet bulb temperature (tnw) and dry bulb temperature (ta) were needed to measure; accordingly, a wet thermometer and a normal thermometer were utilized. The following formula was then used to calculate DI [28]:
To calculate PSI, the physiological index, four parameters including (rectal) core body temperature during exercise (Tret), heart rate during exercise (HRt), (rectal) core body temperature at rest (Tre0) and heart rate at rest (HR0) were required [16]. Rest here means the time before starting work.
In this study, the temperature of the ear was used instead of core body temperature in the following formula [29]. In order to determine PSI, the following formula was utilized:
The final score for the physiological strain index is between zero and ten. The scores zero to two indicate the absence of heat strain (no/little), scores three to four indicate low heat strain, scores five to six indicate moderate heat strain, scores seven to eight indicate high heat strain and scores nine to ten indicate very high heat strain [16].
Measuring perceptual parameters
Perceptual strain index (PeSI) was used to measure heat strain by thermal sensation (TS) and perceived exertion (PE) [22]. For recording the results, the workers were asked to express their thermal sensation and perceived exertion via a visual scale. The score of PeSI was then calculated for each person using the formula below.
The final score for the perceptual strain index is between zero and ten: with scores zero to two indicating the absence of heat strain; scores three to four indicating low heat strain; scores five to six indicating moderate heat strain; scores seven to eight indicating high heat strain; and scores nine to ten indicating very high heat strain.
The required tools and equipment
In this study, demographic information such as age, gender, marital status, interest in exercise and workload (heavy, moderate and light) were collected using a checklist. Height and weight were also measured using a stadiometer and scale, respectively. In data analysis, BMI was also calculated. In this study, environmental parameters including dry bulb temperature (ta), natural wet bulb temperature (tw), globe temperature (tg), relative humidity (RH), Dew Point as well as WBGT index were measured using calibrated Heat Stress WBGT Meter (TENMARS TM-188D). Air velocity (Va) was measured using Hotwire Thermo-Anemometer (KIMO VT 50). Moreover, Solar Power Meter (LUTRON SPM-1116SD) was utilized to measure sunlight.
Physiological parameters including heart rate, systolic blood pressure and diastolic blood pressure were measured via a digital blood pressure monitor (Omron M2 Intellisense). The temperature of the ear was also measured by a digital ear thermometer (Omron Gentle Temp 521). All tools were calibrated according to the manufacturer’s proposed standards.
Methods of statistical data analysis
In order to analyze data, first, the information on demographic, environmental, physiological and perceptual factors was reported using descriptive statistics such as central tendency and dispersion. Thereafter, the relationships between each of these factors with respect to the parametriccity of data were analyzed using appropriate statistical tests with a significant level of 0.05. Accordingly, the Pearson correlation test was run to analyze the relationship between quantitative variables. In order to investigate the difference between quantitative variables among qualitative variables with more than two groups (e.g. BMI and workload) one-way ANOVA test and Tukey’s post hoc test were utilized. Furthermore, one-sample t-test was run to compare WBGT index with Wet Bulb Global Temperature Threshold Limit Value (WBGT.TLV). Moreover, independent t-test was adopted to investigate the difference between quantitative variables among qualitative variables with two groups (e.g. gender). Since in some cases, gender could be considered as a confounding variable, some tests were split by gender and were then analyzed to prevent the bias. In this study, all data were analyzed using SPSS v. 20.
Results
In this study, a cross-sectional method was adopted to describe the environmental conditions of palm groves during date harvesting. Furthermore, the effects of environmental factors on 59 date harvesting workers were measured using physiological and perceptual strain indices. Table 1 represents the demographic information of date harvesting workers. The descriptive results of environmental indices (WBGT, ESI and DI along with environmental factors), physiological indices (PSI along with physiological parameters) and perceptual indices (PeSI along with perceptual parameters TS and PE) are shown in Tables 2, 3 and 4, respectively.
Demographic information of date harvesting workers in palm groves in Jiroft
Demographic information of date harvesting workers in palm groves in Jiroft
*for qualitative variables. **for quantity variables.
Mean and standard deviation of WBGT, ESI and DI indices and environmental parameters measured in palm groves at different times of work shift
*Solar radiation.
Mean and standard deviation of PSI and physiological parameters measured in date harvesting workers at different times of work shift
*Blood pressure.
Mean and standard deviation of PeSI, TS and PE in date harvesting workers according to gender
*This value represents moderate perceptual heat strain.
The results of this study demonstrated that there was a significant difference between Time-Weighted Average for WBGT index (WBGT.TWA) and Threshold Limit Values for WBGT index (WBGT.TLV) (Table 5). Table 6 depicts the correlation coefficient between the indices under investigation. Chart 3 also shows the correlation between the studied indices (except for PeSI). According to the findings of this study, the physiological strain index score was 2.28 which indicated a low physiological strain for date harvesting workers (Table 3). Moreover, based on the results of this study, date harvesting workers were found to tolerate a moderate degree of perceptual strain (Table 4). The results of the analysis are reported in the following sections.
Difference between WBGT.TWA and WBGT.TLV according to workload of date harvesting workers
*All women were in this class; **ISO 8996; ***ISO 7243.
Correlation coefficient between environmental, physiological and perceptual indices
*P-value <0.0001.
The results revealed that there was a direct and significant correlation between environmental indices including WBGT, ESI and DI and the physiological strain index (PSI) (Table 6). Environmental indices including WBGT and DI and wet bulb temperature (Tnw) revealed a direct and significant correlation with workers’ ear temperature (correlation coefficients were 0.26, 0.31 and 0.26, respectively). Moreover, Ta had a direct and significant correlation with the heart rate (r = 0.41; P = 0.001). The results of this study also indicated that the heart rate of male workers increased with an increase in ESI, WBGT, Ta and Tnw (correlation coefficients were 0.52, 0.49 and 0.37, respectively). In investigating the relationship between environmental factors and the heart rate of female subjects, a positive and significant correlation was revealed, albeit with ESI (r = 0.52). Diastolic blood pressure in men had a direct and significant correlation with ESI, WBGT and Tnw factors (correlation coefficients were 0.34, 0.33 and 0.33, respectively). However, there was an inverse correlation between this physiological factor and RH, the environmental parameter (r = –0.32; P = 0.048). Moreover, among female subjects, an increase in SR led to an increase in their systolic pressure (r = –0.37; P = 0.046). There was no significant relationship between other environmental and physiological parameters.
The relationship between environmental parameters and perceptual parameters
The research results revealed that there was no significant relationship between environmental indices and perceptual strain index (PeSI) (Table 6). The analysis of the relationship between PeSI and environmental parameters including Ta, Tg and SR, proved a direct and significant correlation (correlation coefficients were 0.45, 0.44 and 0.46, respectively). Furthermore, the results of analyzing the relationship between environmental and perceptual parameters in terms of gender suggested that there was a direct and significant correlation between thermal sensation (TS) in female subjects and environmental parameters including Ta, Tg and SR so that the correlation coefficients were 0.69, 0.71 and 0.68, respectively (P < 0.0001). Based on the results, perceived exertion (PE) reported by date picking women also had a direct and significant correlation with Ta, Tg and SR parameters (correlation coefficients were 0.64, 0.71 and 0.63, respectively P < 0.0001). Nevertheless, there was a direct and significant correlation (r = 0.40; P = 0.015) in male workers only with regard to perceived exertion (PE) and SR. The analysis of the relationship between other environmental and perceptual parameters showed no significant relationship.
The relationship between physiological parameters and perceptual parameters
Contrary to expectations, there was no significant relationship between the physiological strain index (PSI) and the perceptual strain index (PeSI) (Table 6). In analyzing the relationship between physiological and perceptual parameters according to gender, an inverse and significant correlation was found only between women’s systolic pressure and thermal sensation factor (TS) (r = –0.49; P = 0.018) as well as perceived exertion (PE) (r = –0.54; P = 0.008). There was no significant relationship between other physiological and perceptual parameters.
The relationship between physiological parameters and demographic factors
The analysis of the relationship between physiological variables and demographic information of the studied population showed that with the increase in height, the temperature of the ear was reduced. (r = –0.26; P = 0.047). Furthermore, the results of Pearson correlation analysis between systolic blood pressure in workers and demographic factors including weight and BMI revealed a direct and significant correlation; accordingly, the correlation coefficients were 0.37 and 0.38, respectively, with significance levels of P = 0.004 and P = 0.003. Moreover, in investigating the difference in heart rate among groups with different workloads, it was demonstrated that an increase in workload led to an increase in heart rate of workers. Tukey’s post hoc test revealed this difference between workers with a heavy workload and other people as significant (P < 0.0001). There was no significant relationship between other physiological and demographic parameters.
The relationship between perceptual parameters and demographic factors
The results of this study showed that perceived exertion (PE) in men was significantly higher than in women (P = 0.019). Moreover, men with normal BMI reported higher PE than underweight ones (P = 0.014). However, underweight women revealed a significant increase in thermal sensation factor (TS) compared to those with normal body mass. Based on the results, there was a significant relationship between workload and perceptual strain index. The results of the Tukey’s post hoc test showed that subjects with a heavy workload experienced higher perceptual strain compared to those with moderate workload (P = 0.005) and those with light workload (P = 0.013). Furthermore, a direct and significant correlation was found between the height of subjects and PE factor and PeSI (correlation coefficients were 0.44 and 0.29, respectively). There was no significant relationship between other perceptual and demographic parameters.
Discussion
The average WBGT in the palm groves investigated in this study was 32.77 while the rate of this heat index was 28.5 in Seoul’s green spaces and 31.9 in Chinese construction workers (in summer)(30, 31). WBGT index in the working environment of farmers in northeast Ghana was recorded as 14.0–38.1 (variations between cold and warm months, from March to October) [32]. Nevertheless, this index was significantly higher in date harvesting workers. Its rate during the coldest time of work shift (at 6–7) was 20.50 and during the warmest time of the work shift [13, 14] was 44.00 (Table 2). Moreover, the results of this study demonstrated that Time-Weighted Average for WBGT index (WBGT-TWA) in the harvesting season exceeded the threshold limit value recommended by ACGIH; the rate of this index was 34.05 for women (light workload) and 33.5 for men (moderate and heavy workload) (Table 5). A review of the previous studies revealed that WBGT-TWA index in farmers and road construction workers also exceeded the threshold limit value (WBGT-TLV) and were reported as 27.65 and 27, respectively [33, 34]. As is evident, the WBGT-TWA rate in the present study was significantly than these two studies suggesting a high probability of being afflicted with diseases caused by heat stress among date harvesting workers. In the present study, two environmental strain indices including ESI and DI were also calculated and their relationship with other parameters was measured. The research results revealed that ESI had a direct and significant correlation with WBGT and DI (Table). In a research consistent with the present study, there was a strong and significant correlation between ESI and WBGT in assessing heat stress in urban outdoor workers (r = 0.96) [30]. This means that with an increase in the Environmental Stress Index, the Discomfort Index will also increase.
In order to evaluate the effects of heat stress on workers, in the present study, physiological and perceptual strains of date harvesting workers were calculated and analyzed with regard to standard indices including PSI and PeSI. The research results showed that date harvesting workers had a low degree of physiological strain at their workplace since the average score of PSI in total work shift of date harvesting was 2.28, which had a significant increase over the last hours of the shift (PSI Score = 2.98) (Table 3). According to the results, date harvesting workers had a moderate degree of perceptual heat strain (PeSI) and the average score of this index in date harvesting workers was 6.61 (Table 4). In an experimental study, the score of perceptual strain index was similar to that of the present study (PeSI score = 6.52) [35]. However, construction workers had a high perceptual strain (PeSI score = 7 to 8) in another study [36]. With accordance to the complexity of perceptual phenomena and the role of psychological and physiological factors, besides environmental heat, the physical activity, which adds the body’s metabolic heat to people’s perception of environmental stress, can be regarded as the probable cause of higher strain in construction workers.
Investigating the relationship between environmental parameters and physiological parameters revealed a direct and significant correlation between environmental indices (WBGT, ESI and DI) and physiological strain index (PSI) (correlation coefficients were 0.43, 0.59 and 0.60, respectively) (Fig. 3). Habibi et al. also showed a direct and significant correlation between WBGT and PSI in an experimental environment (r = 0.99) [37]. Nevertheless, in investigating the relationship between these two indices in 145 workers in warm workplaces, Dehghan et al. reported a lower correlation coefficient than that of the present study. (r = 0.39) [35]. Moran et al. also reported a high correlation between ESI, PSI and core temperature (Tre) (r≥0.84)(38); which was similar to the results of this study (Table 6). In the present study, with an increase in body (tympanic) temperature, environmental indices including WBGT, DI and wet bulb temperature (Tnw) also increased significantly. This was consistent with the results of the study by Monazzam et al. In their study, environmental indices including WBGT and DI had a direct and significant relationship with body temperature (correlation coefficients were 0.72 and 0.71, respectively) [39]. On the contrary, Zamanian et al. found no significant relationship between WBGT and physiological parameters including body temperature, heart rate and systolic blood pressure [33]. With an increase in the temperature of palm groves (Ta), the heart rate of date harvesting workers also increased (r = 0.41). This was also confirmed by the findings of the study by Golbabaei et al. [34]. These findings emphasize the significance of heart rate, as a physiological index effective in the occurrence of environmental stress.
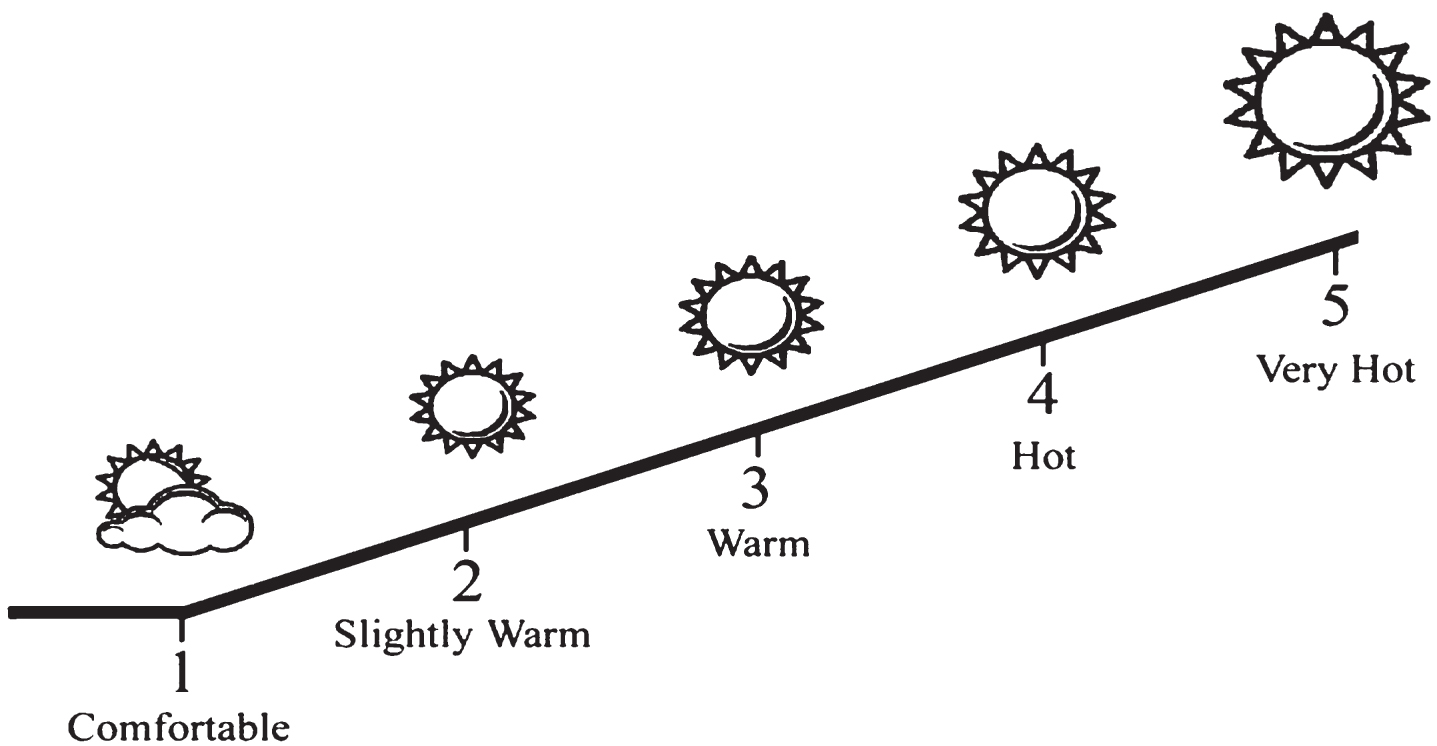
Visual scale of thermal sensation index (TS).
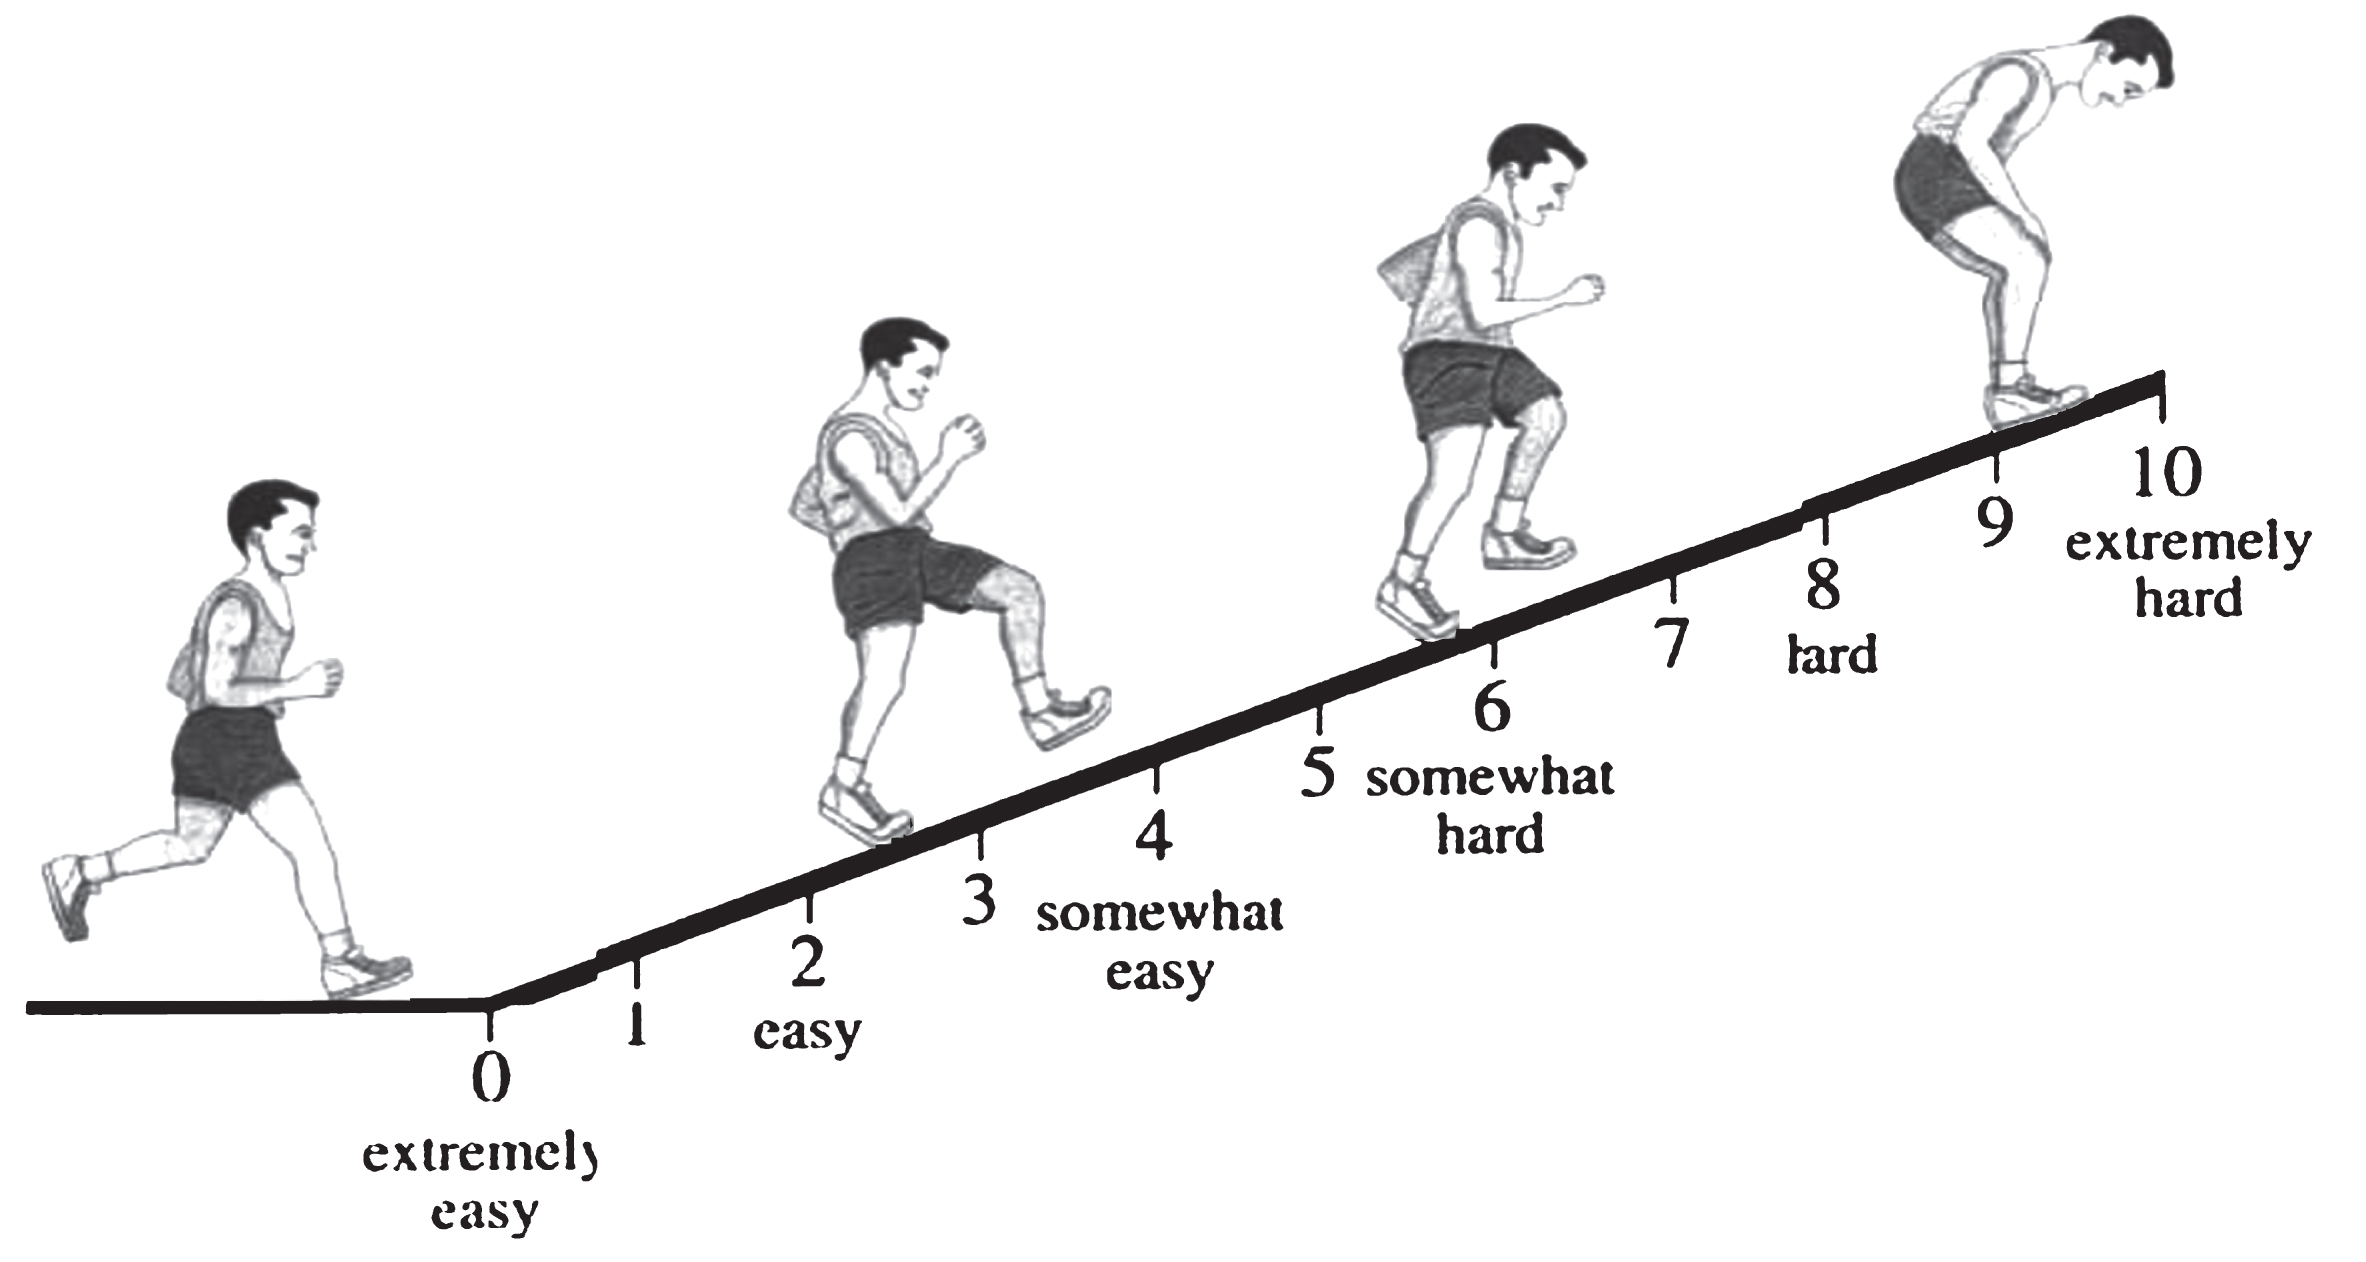
Visual scale of perceived exertion (PE).
The results of investigating the relationship between environmental parameters and perceptual strain index (PeSI) suggested that there was no significant relationship between perceptual parameters and environmental indices (WBGT, ESI and DI) (Table 6). Nonetheless, in an experimental study, Dehghan and Ghanbary demonstrated a direct and significant correlation between heat stress index (WBGT) and perceptual strain index (PeSI) (r = 0.71) [35]. There was no significant relationship between physiological strain index (PSI) and perceptual strain index (PeSI) in date harvesting workers (Table 6). Contrary to the findings of this study, in two experimental studies, a direct and significant correlation was detected between PSI and PeSI (r = 0.94 and 0.74) [35, 40]. The results of the study by Hostler et al. were also inconsistent with the findings of the present study. They investigated the effect of hyper hydration on perceptual and physiological strain indices and observed a strong correlation between these two indices [41]. Cheong et al. also found a significant relationship between physiological and perceptual strains and stated that perceptual strain could be detected through perception [42]. The reason why the relationship between physiological and perceptual indices in the present research was not significant can probably be traced back to other factors (like social and psychological ones). In fact, most people considered working in difficult environmental conditions as a value and did not express their suffering so as not to lose this value.
In analyzing perceptual and physiological parameters, gender can play a decisive role. Therefore, in this study, gender was considered as an independent variable. Accordingly, the results indicated that with an increase in ESI, WBGT, Ta and Tnw, heart rate of male workers also increased. However, the heart rate of female workers during the date harvesting showed a positive and significant correlation only with ESI. In investigating the heat stress in male workers of the petrochemical industry, Monazzam et al. also came to similar results with those of the present research (but with a higher significance level). They reported the correlation coefficients of workers’ heart rate with WBGT and DI indices as 0.73 and 0.72, respectively [39]. In another study, the highest correlation was obtained between heart rate and WBGT index in men (r = 0.97) [37]. However, an inverse correlation was also reported between heart rate and WBGT index [33]. Based on the research results, diastolic blood pressure of male workers increased with an increase in ESI, WBGT and Tnw parameters (correlation coefficients were 0.34, 0.33 and 0.33 respectively); moreover, with an increase in RH, the environmental parameter, this physiological factor also decreased (r = –0.32). However, diastolic blood pressure in women did not reveal any changes with the change in any of the environmental parameters and women only had an increased systolic blood pressure with the increase in SR (r = 0.37). Among previous studies, the results of a research article were consistent with those of the present research in which the correlation coefficient between WBGT and diastolic blood pressure was 0.37 [39]. However, some studies, unlike the present study, did not report any significant relationship between these two parameters [33]. This can be attributed to the subjects’ physiological acclimatization to heat; in the same regard, the results of the study by Khalaf et al. also revealed that there was heat acclimatization in workers within five days [43].
The results of the analysis of the relationship between environmental and perceptual parameters in terms of gender suggested that women suffered from heat stress more than men did since thermal sensation (TS) and perceived exertion (PE) reported by them had a direct and significant correlation with environmental parameters including Ta, Tg and SR. However, in male workers, only an increase in their exposure to sun or solar radiation (SR) made them suffer from a perceptual strain caused by perceived exertion (PE) (r = 0.40). All these results indicated that perceptual responses of date harvesting workers were under the influence of heat stress and gender. Regarding the investigation of the relationship between physiological and perceptual responses of individuals to heat, the results of the research by Wong et al. were consistent with the findings of the present study [44].
Investigating the relationship between physiological and perceptual parameters and demographic factors showed a direct and significant correlation between systolic blood pressure of workers and their demographic factors including weight and BMI. Nonetheless, in women with a low body mass, the value of thermal sensation factor (TS) was higher than that in women with normal body mass. This was inconsistent with the results of the previous studies [35, 45]. Based on these results, it can be concluded that although date harvesting women had a light workload (packaging dates while sitting), due to physiological differences and perhaps having a covering (hijab), they suffered from heat stress more than men did. Furthermore, the results of this study showed that an increase in the workload of date harvesting workers would lead to an increase in their heart rate. In addition, date picking workers (with a heavy workload) were reported to have a higher perceptual heat strain than those who helped date picking (with moderate workload) and date packing workers (with light workload). Based on these findings, it might be argued that date picking workers were more exposed to the consequences of heat stress, which influenced their performance. In fact, the results of the study by Li et al. on performance of pilots revealed that high heat stress would lead to a decrease in grip strength as well as an increase in somatic perception [46]. One of the limitations of this study was sample loss since some workers stopped working in the midst of work shift. Of course, lack of paying due consideration by some workers as well as their negligence to accurately state the level of perceptual strain could also be regarded as another limitation of this study. The results of this study showed that date harvesting workers in palm groves were exposed to a considerably high degree of heat stress, much more than the threshold limit value. Hence, it is necessary to take preventive measures and conduct further studies.
In this study, five indices including WBGT, ESI, DI, PSI and PeSI were utilized to investigate the stress as well as the strain of date harvesting workers. The results demonstrated a direct and significant correlation between all indices except PeSI. Moreover, the results of this study revealed that date harvesting workers were exposed to heat stress more than the threshold limit value recommended by ACGIH (WBGT-TLV). In addition, workers suffered from a low degree of physiological strain and a moderate degree of perceptual strain caused by heat stress in palm groves in Jiroft.
Conflict of interest
None to report.
Footnotes
Acknowledgments
Hereby, the researchers sincerely thank all workers, owners of palm trees and officials of Agricultural Jihad Organization of Jiroft for their collaboration. This paper is part of a research project No. 94-28 approved by the Research Council of Jiroft University of Medical Sciences.