
Abstract
BACKGROUND:
Health and safety performance measurements aimed to provide information on the progress and current situation of organizational strategies and activities.
OBJECTIVES:
We developed a model to determine and select safety key performance indicators in order to assess safety management systems.
METHODS:
This study has been designed in six steps aiming at defining a model of leading performance indicators (LPIs) and selecting key performance indicators (KPIs) using the AHP method.
RESULTS:
According to the results analysis, 116 structural and operational indicators were defined based on the components of the OHSAS 18001 management system. For this purpose, 19 structural, 27 operational and 33 active KPIs were selected by AHP and BN techniques.
CONCLUSION:
Development of LPIs is influenced by various organizational, managerial, and operational factors. LPIs extracted from the components of the OHS-MS deployed in an organization are often passive and cannot show the changes in the safety status of a workplace in a short period. The model presented in this study was designed with an emphasis on extraction of active and operational indicators, as they were capable of detecting performance changes in construction industries.
Introduction
Performance evaluation indicators and criteria are important in all aspects of life [1]. These indicators create a proper reaction to incidents, so that we can take action to change and improve [2]. In the past, industrial safety performance was measured by indicators defined by the Occupational Health and Safety Administration (OSHA), including the Recordable Injury Rate (RIR), Lost Work Day (LWD) rate, Worker Compensation Rate (WCR) and so forth [3]. The LWD, RIR indicators, and disease rates measure the safety performance rate after loss and damage occurrence, which is defined as a lagging indicator [4]. Lagging indicators do not provide information necessary to prevent further accidents. In general, performance indicators are metrics showing the performance of one or more dimensions of an organization [5]. The main purpose of measuring the performance of occupational safety and health is to provide necessary information regarding the progress made and the current situation of the strategies and activities adopted by an organization to control health and safety risks [6]. Safety performance indicators fall into two main categories of leading and lagging indicators. Leading indicators show the activities of an organization regarding the prediction and prevention of accidents before they occur; while lagging indicators show the performance of the organization after an accident occurs to reduce impacts and consequences [7]. Safety research in the field of health and safety performance measurement indicators was started around 1998 [8]. Recent studies focus on the difference between leading and lagging indicators, with the research based on the need for safety or risk measurement. The term “index” is relatively new in the field of safety, but the measurement of safety was performed in 1980 and with expressions such as rate, index, and measurement [9]. Today, the terms “indicator” and “Key Performance Indicators (KPIs) ” are usually used [10]. The nuclear industry is known as a pioneer in the development of risk indicators, followed by the chemical process and petroleum industries [7, 11]. A few studies have been conducted on the development of leading safety performance indicators in the field of oil and gas. The Association of Oil and Gas Producers (OGP), the Center for Chemical Process Safety (CCSP), and the American Petroleum Institute (API) are active organizations in the development of leading safety performance indicators in the oil and gas industry [12–15]. The reports on the safety performance of these centers are mainly at the managerial level, and focus on managerial elements such as change management, training, and management of risk rising from fatigue and maintenance procedures [16].
Cambon et al. divided the leading indicators into structural and operational ones [17]. Daniel, relying on the components of the ILO-OHS-2001 management system, defined the LPIs [18]. Jimmie Hinze et al. divided safety LPIs into two groups: active and passive [3]. Passive indicators are those that take a long time to measure, while the active ones can be measured within a shorter period [3]. The fatality rate in construction accidents can be 10–20 times more than the average fatality rate in other industries [19]. According to the reports of the safety performance indicators of the International Association of Oil and Gas Producers (OGP), 12.9% of total work days lost are related to construction phases in oil and gas industries [20]. Many studies indicate that the prevalence and incidence of occupational accidents and illnesses in construction activities are higher than those in other industries [21, 22]. Furthermore, it is difficult to use occupational health and safety costs as an indicator, since these costs cannot be easily calculated in the construction industry [23]. The main root causes of construction accidents include the failure to identify the unsafe conditions, work in unsafe conditions and the ignorance of workplace conditions, perhaps due to managerial mistakes, unsafe actions and the nature of construction activities [24]. Haslam et al. showed that the key factors responsible for accidents in the construction industry included human error, unsafe workplace, defective equipment and materials, lack of personal protective equipment and deficiencies in risk management [25]. The results show that construction operations and activities are of a high-risk nature. Therefore, it is essential that LPIs are detected timely along with safety warning characteristics [3, 26]. Hence, in the present study, we tried to develop a model to evaluate performance indicators and safety management systems, so that the determined LPIs could help to decide safety conditions at all levels of management during the construction phase in oil and gas refineries.
Methodology
This is a descriptive-analytical study conducted during the construction phase of oil and gas refineries. The methodology involves six steps as follows:
Step 1: Classification of safety performance indicators
In the first step, the LPIs are classified based on former studies [3, 18] as shown in Fig. 1.
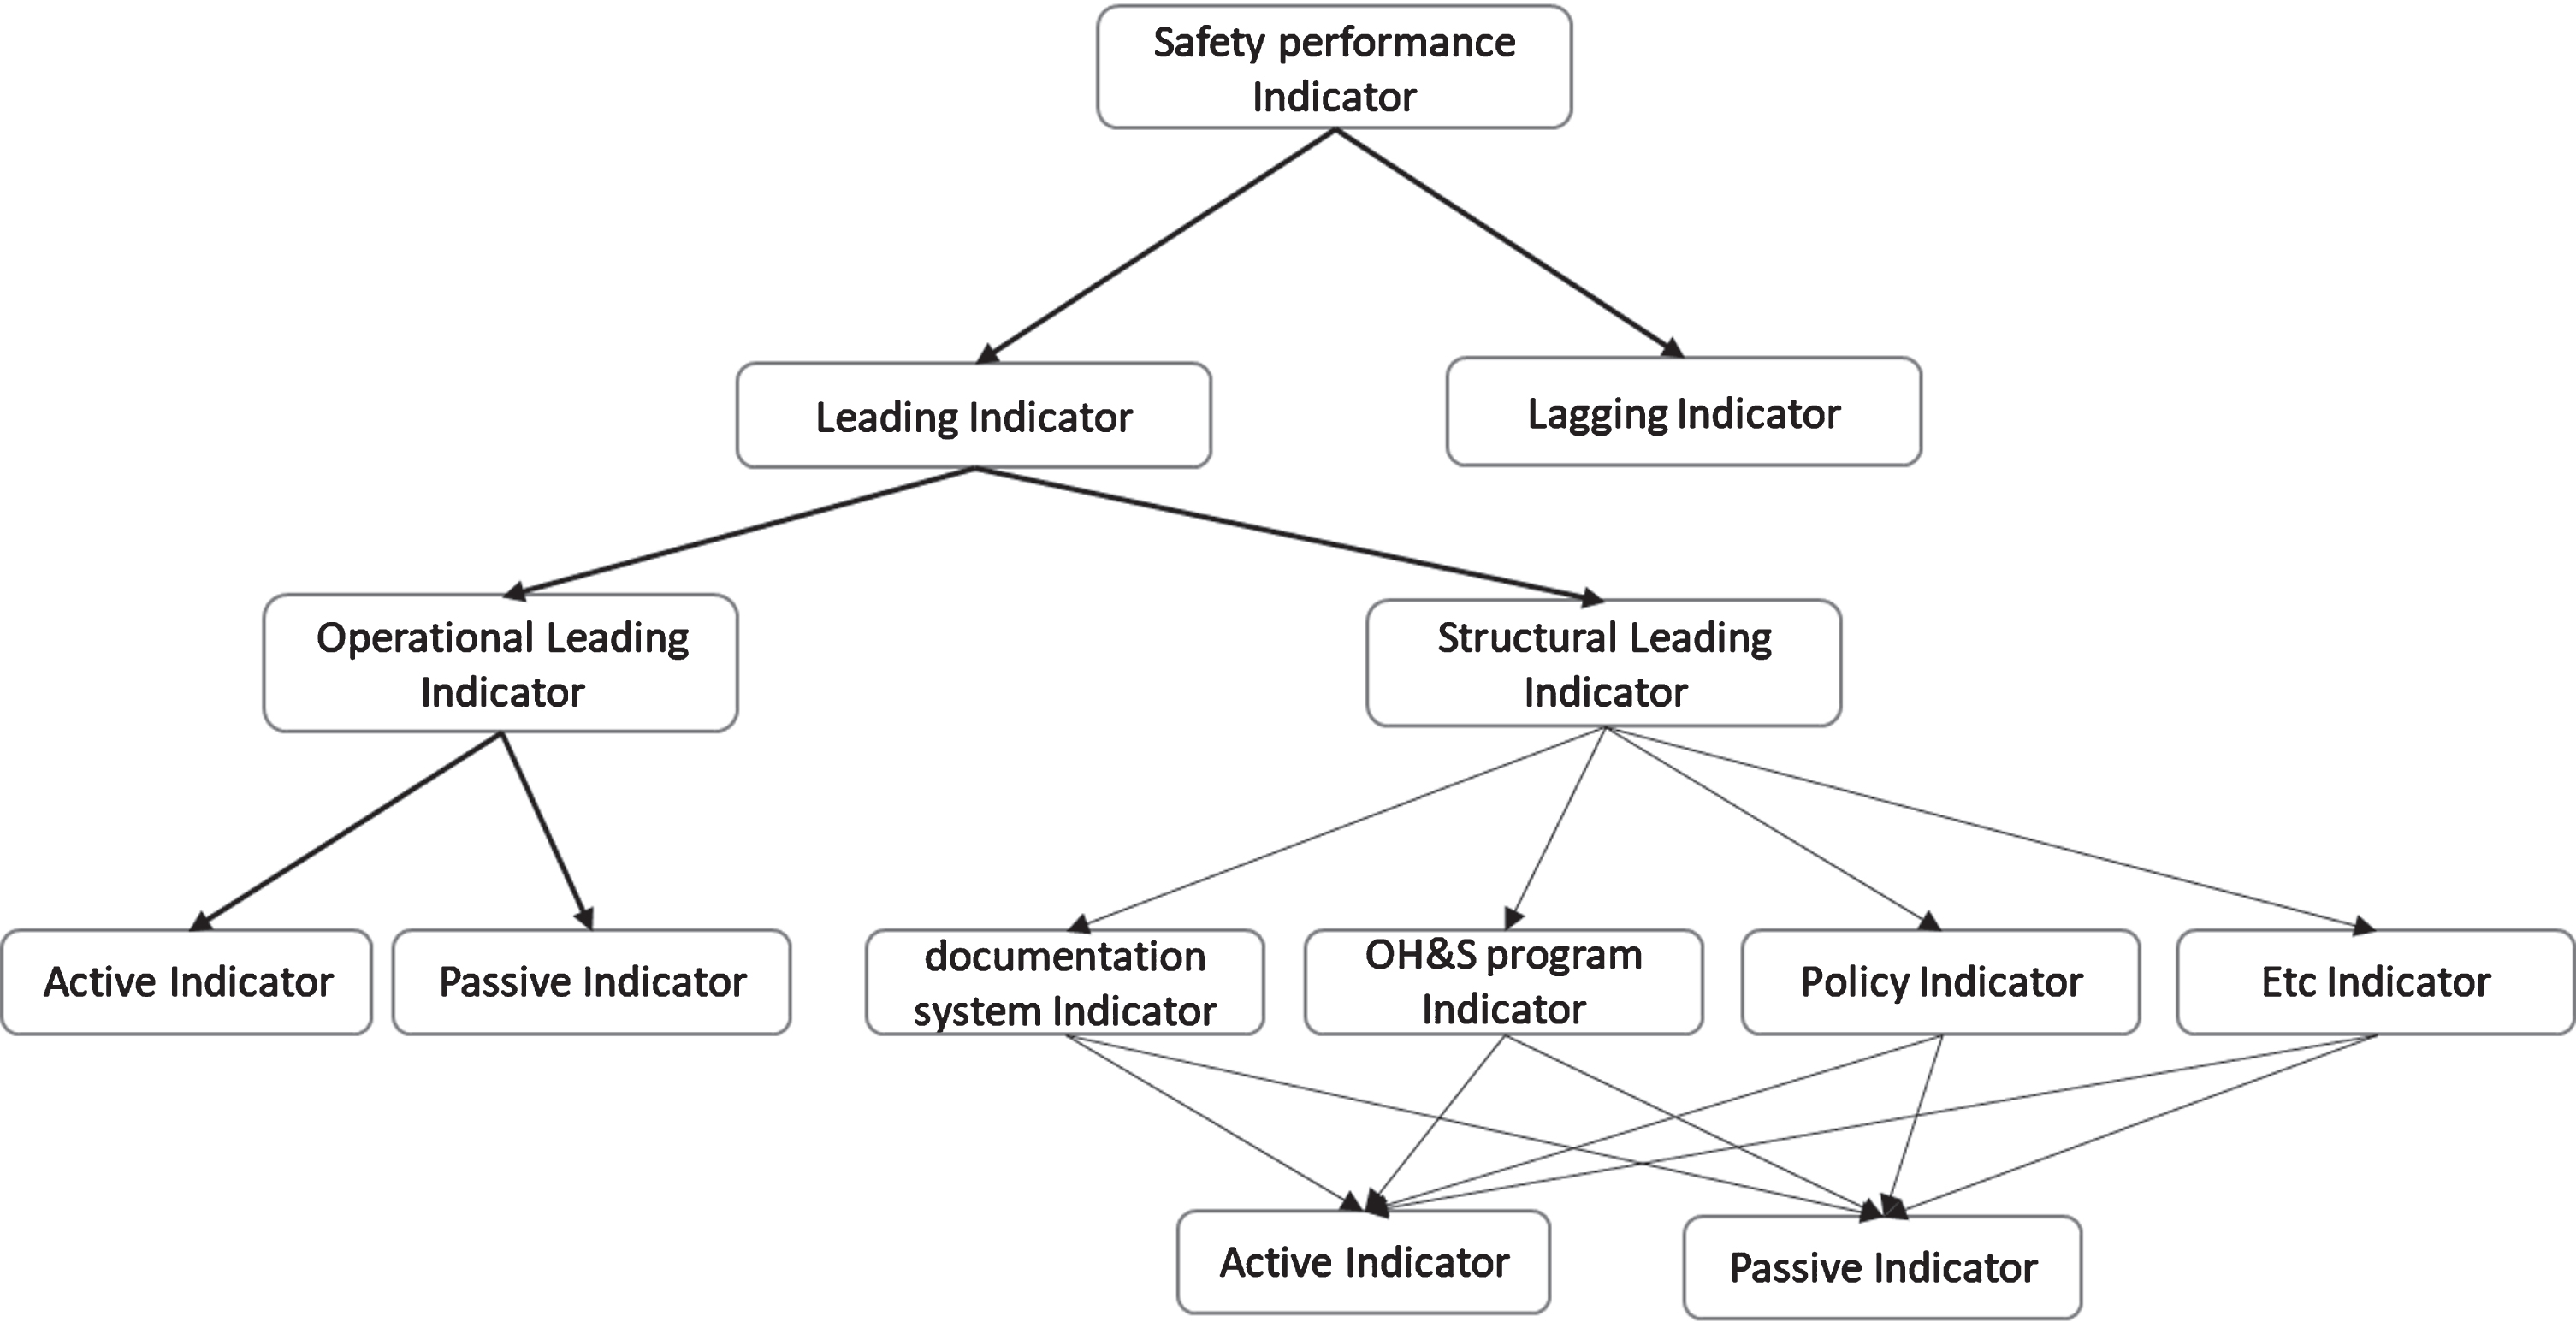
The model of classification of LPIs.
According to Fig. 1, there are two LPIs: structural and operational. In fact, structural indicators show the status of safety management systems, including policies, objectives and plans, procedures, and guidelines [17]. In addition, operational performance indicators evaluate the effectiveness of the internal processes of safety and health management systems [18].
As Fig. 2 depicts, the model to define safety LPIs was developed to determine and select KPIs. The model was based on structural and operational performance indicators [3, 18]. Two types divided both indicators: active and passive. The operational indicators are determined based on a project’s Work Breakdown Structure (WBS), hazard identification and an analysis of the construction phase accidents. In this model, the Bayesian network (BN) and an expert panel were used to analyze accidents.
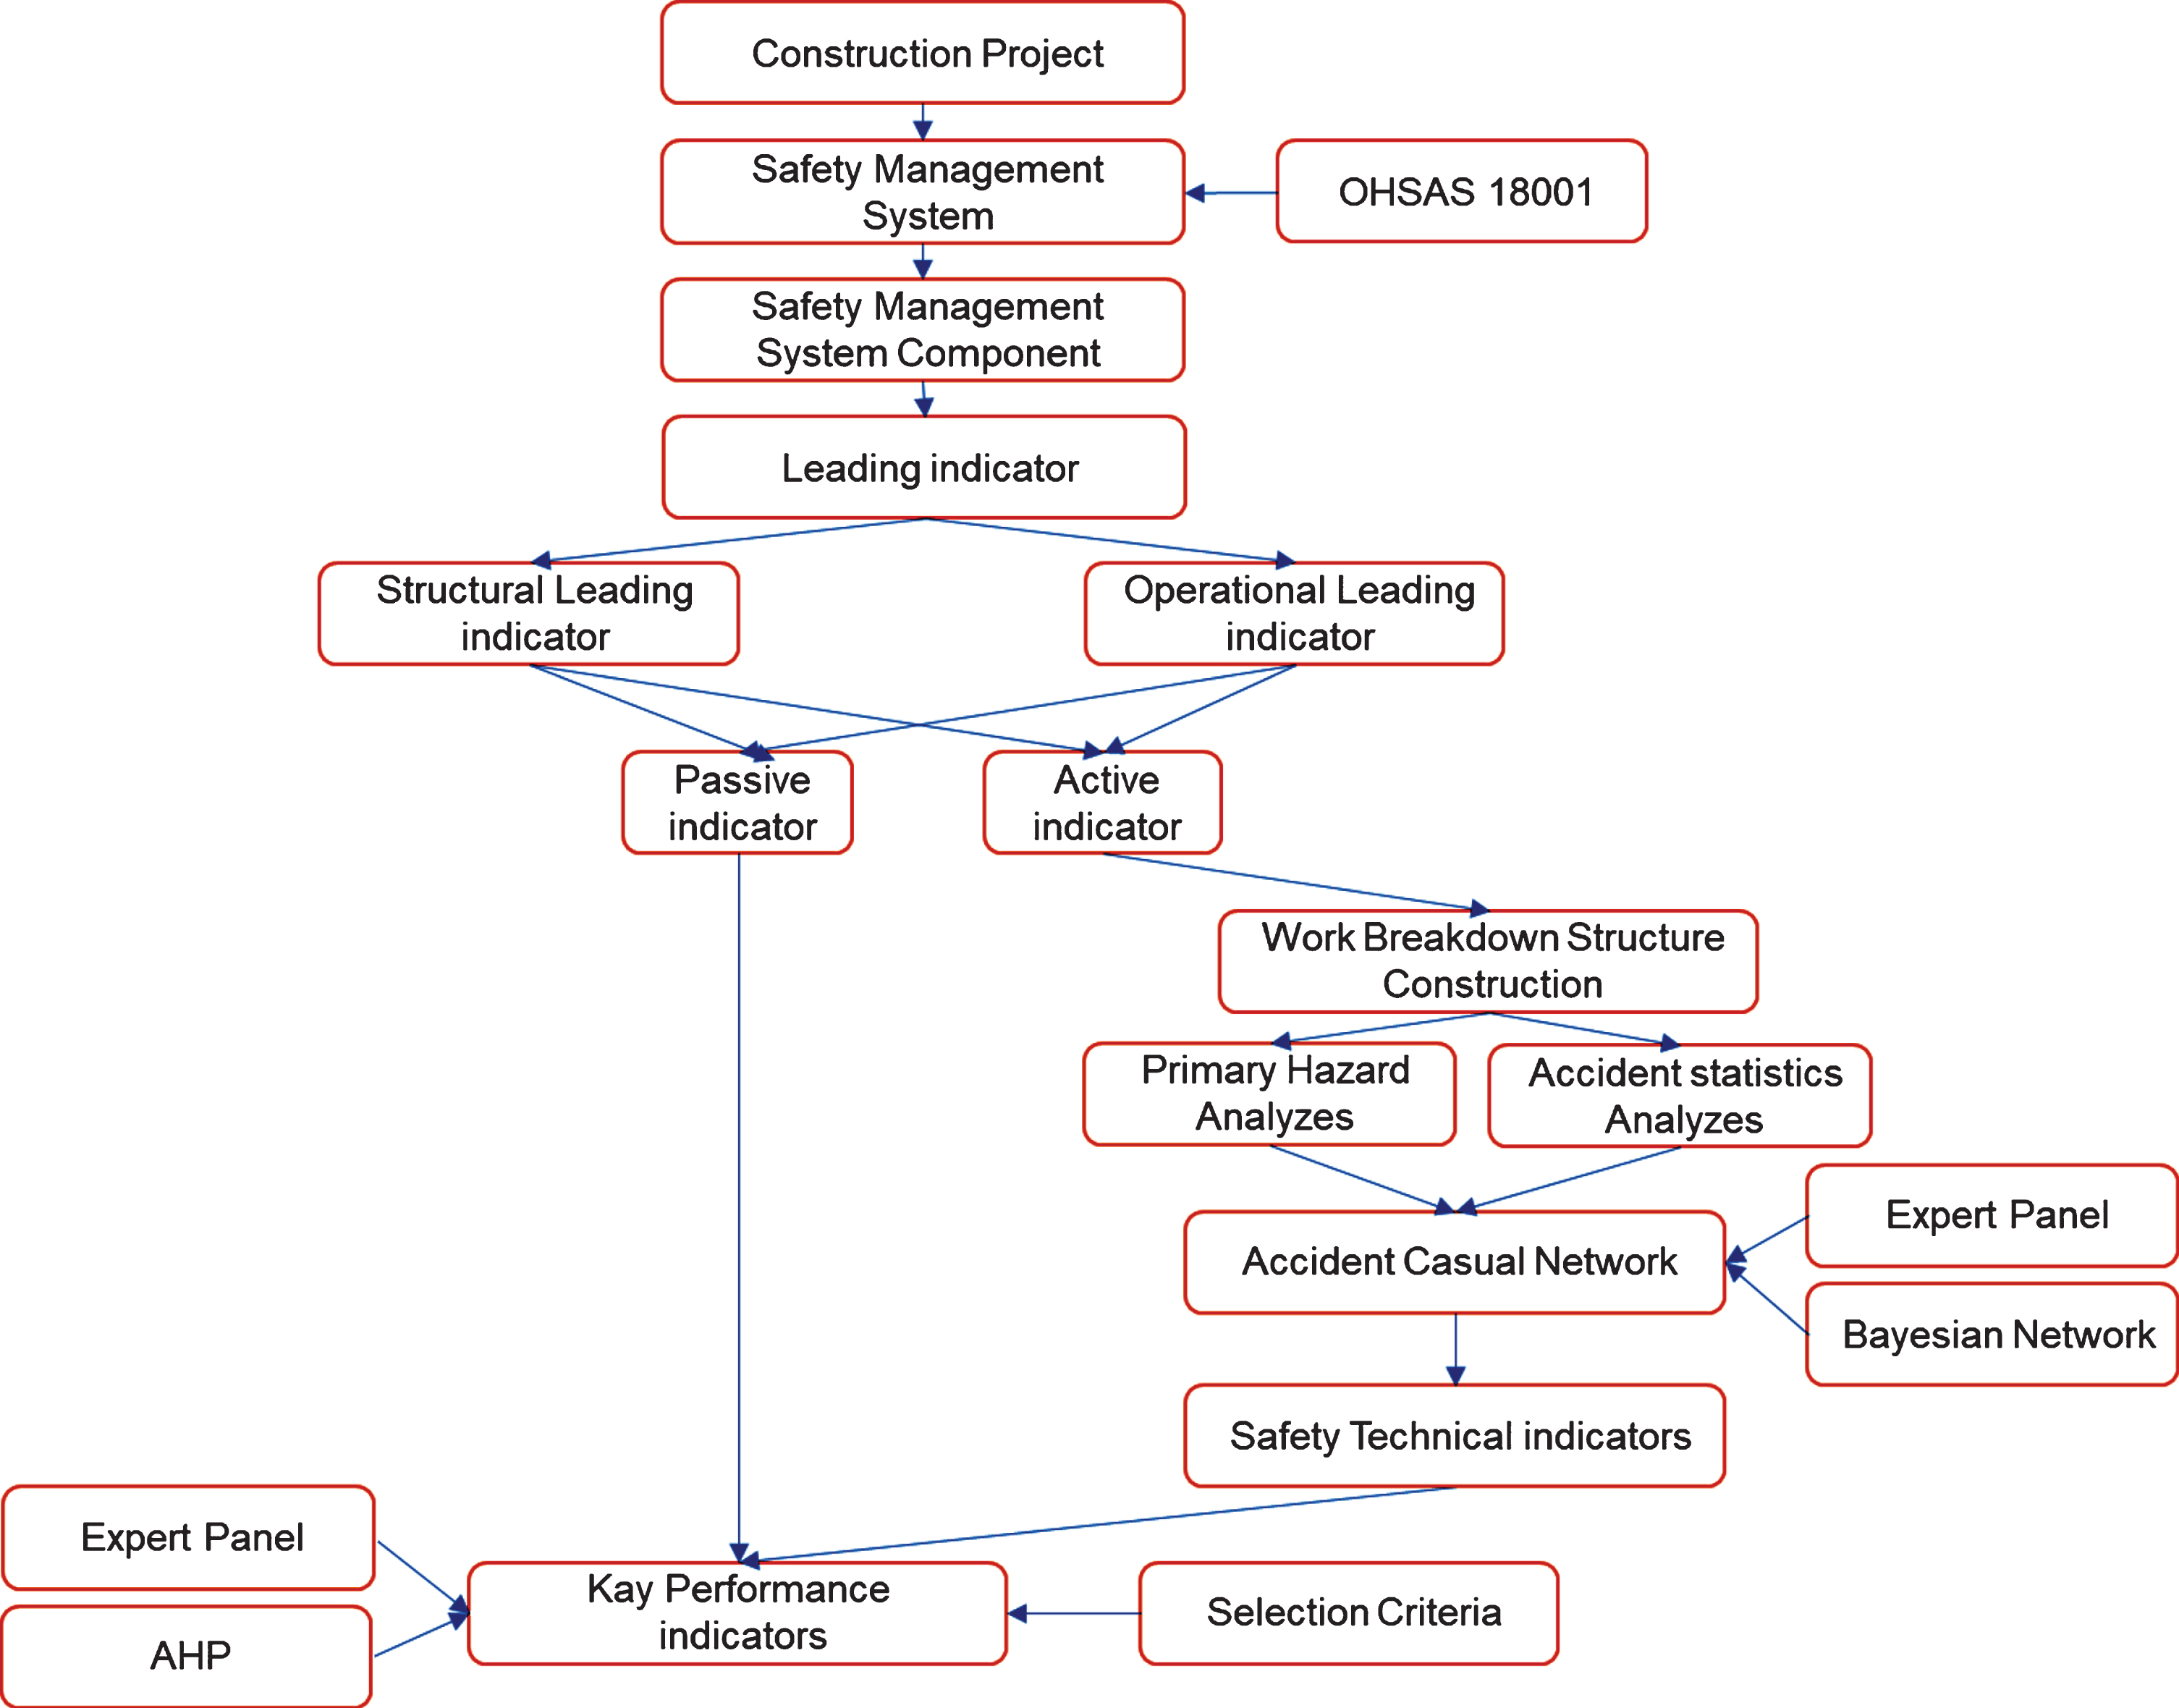
The process of defining and selecting key LPIs.
The current evidence indicates that the application of a systemic approach in different areas can improve efficiency and effectiveness and enhance performance output, and it may integrate all activities. The application of the major components of a management system is a key step in performance measurement to identify the strengths and weaknesses. Different studies demonstrated that among various systems of health and safety management, the OHSAS 18001 management system had the highest priority in different industries [5, 27]. Here, based on the model, which is defined in the second step, the components of OHSAS 18001:2007 were chosen as the OHS management system guidelines in the construction phase of a refinery.
Step 4: Identification and classification of construction phase operations and hazards involved
In this step, to determine the active indicators as defined by Hinze [3], the construction operational processes were determined by the WBS plane. In fact, WBS is a network structure or tree graphic to illustrate the method of producing a product or service. It includes parts of hardware and software services, and some organizational tasks to provide some products or services. In the fourth step, the first main activities of the construction phase were determined by studying the project WBS. Afterward, the hazards of the unsafe conditions of the operation were analyzed using the PHA. The preliminary hazard analysis techniques were the first attempt to identify and classify the hazards of the operations or systems [28].
Step 5: Development of a casual network of accidents by the BN
In the fifth step of the study, the recorded accidents in five refinery construction projects were analyzed by the SPSS version 18 software, and major accidents were selected according to their “occurrence frequency” and “consequence severity”. The casual network of accidents and the assessment of deficiency probability are important factors for risk assessment, determining the safety performance indicator. The 14 experts working for that project determined the relationship between the causes of accident occurrence and their occurrence probability. Moreover, using the BN, the causative relationships and calculation of the probability of the major accidents in this study were accomplished. In brief, the BN method is the appropriate technique to the collect the scattered data, and it is an good framework in the field of subjective probabilities for decision-making under uncertainty [29]. In addition, it is a graphical probability model showing a set of random variables and conditional dependencies among them. The network shows a complete description of the different areas. Each variable of the joint distribution probability is calculated using the data from the network. A variable in the distribution can be set on a variable numbering like P (X1 = x1 … x
n
= x
n
). Regarding the data within the network, the amount of a variable can be calculated according to Equation 1:
Figure 3 shows the causal network related to the E event that is a method to determine leading performance indicators using the BN. In addition, according to this figure, C1 and C3 are one of the causative factors for the occurrence of the E event. The calculation of the probability of the E event is based on relationships between nodes. Moreover, the probability of the event E in the specified path C1 and C3 concerning the chain rule in probability and calculated according to Equation 2.
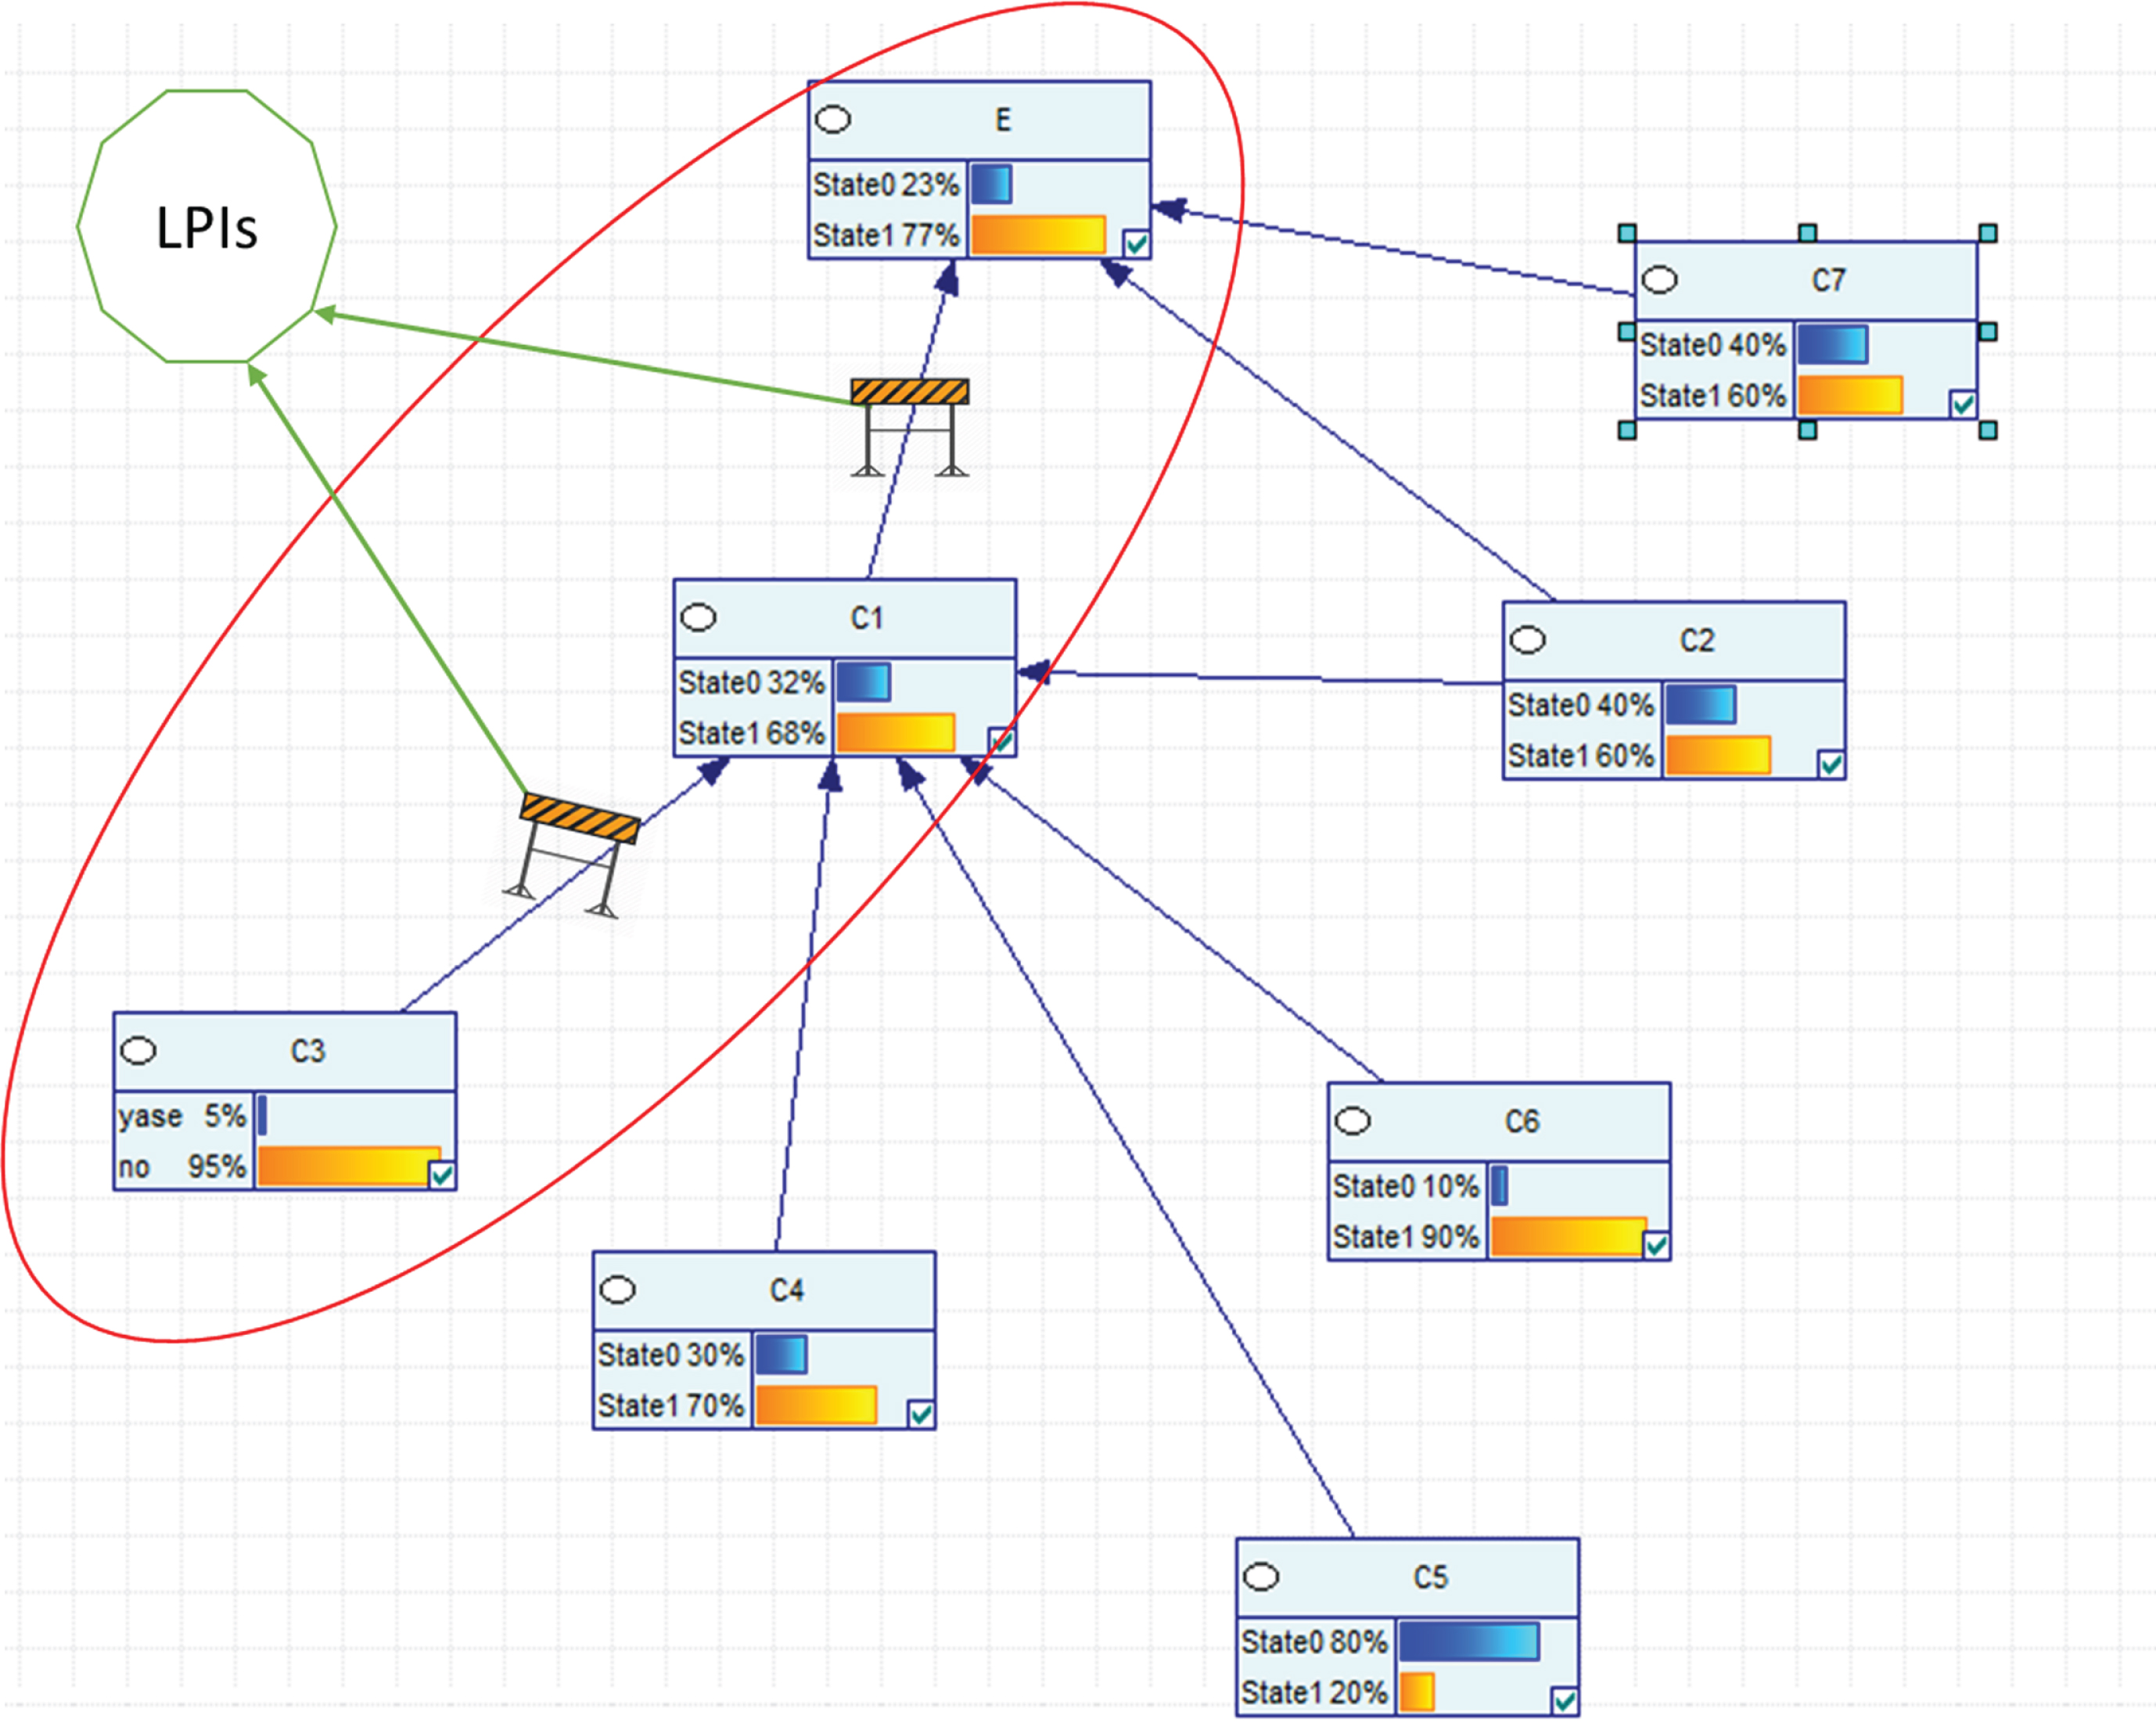
The method of extracting safety LPIs (LPIS).
The BN is exactly equal to the joint distribution, when Equation 3 is valid for any X
i
variable in the network.
Assuming that parents (X1) ⊆ {X1 . … Xi-1} the causal network has two structural and learning characteristics. By applying the network structural model, the safety performance indicators are determined through identification of the preventative measure. The extracted LPI demonstrates the status of the preventative measure in decreasing the probability of the occurrence of causes. The probability of occurrence of any cause is applied as one of the key criteria to select KPIs. In the present study, active safety performance indicators were developed using the concept of the BN.
It is essential to reduce the number of LPIs to some limited KPIs to create an effective method of measuring OHS MS performance. In other words, among the existing indicators, the best and most important indicators should be selected based on the considered criteria. Figure 4 shows the selection model of KPIs. In the scientific literature, different requirements may be found to choose a suitable indicator [30]. However, one of the most famous sets of criteria to select indicators in the field of management performance is SMART (specific, measurable, achievable, relevant, and time-bound) as mentioned previously by Kjellen, Rockwell, and Carlucci [31–33].

Model for the selection of key performance indicators.
In this step, KPIs were selected from a set of extracted indicators according to the components of OHSAS 18001 through the AHP method, and all indicators were compared to each other.
Furthermore, this paired comparison was accomplished based on the SMART criteria and experts’ opinions. Thus, a paired comparison table like a questionnaire was prepared. In addition, the comparison was calculated according to the following square matrix:
In this step, the weighting of the indicators was based on the experience and expertise of the 14 selected safety experts who were employed in the construction of oil and gas industries. After obtaining the paired-wise comparison matrix from each expert, the results were merged using the geometric mean method, and the integrated matrix of paired comparisons was calculated by Equation 5.
The weight was calculated by the geometric mean, and it was the final weight of the elements, but it was not the normal weight. When the geometric mean related to the paired comparison of each element was shown as π
i
, the normal weight of the elements of each column was calculated as follows:
Considering a relatively low complexity, software accessibility, and the possibility of applying this method to decision-making problems in economic, scientific, and technological sectors, the AHP is widely used in scientific contexts, as shown by Vaidya and Kumar, and Subramanian and Ramanathan [34, 35]. Therefore, using the AHP, the KPIs were selected based on the SMART criteria and the cause occurrence probability of accidents, which all of them were obtained from the BN. In addition, the GeNIe software and Expert Choice 11 software were used to generate the causal network of accidents and paired comparison of the LPIs, simultaneously.
Determination of the priorities of AHP in two-by-two comparison
Determination of the priorities of AHP in two-by-two comparison
As per this methodology, 116 LPIS were determined based on the OHSAS 18001:2007 components. Among them, 46 KPIs were selected according to the SMART criteria. Furthermore, Table 2 presents 19 structural performance indicators and 27 operational performance indicators.
The final list of leading KPIs determined on the basis of the components of the OSH MS
In addition, 2,744 accidents were statistically analyzed in five refinery construction projects and the results of them are illustrated in Fig. 5.

The proportion of the frequency of recorded accidents and the mortality caused by the accidents.
Thus, Fig. 5 indicates that the accidents of falling (21%), objects collapse (18%), and falling objects (17%) account for the highest proportion of the recorded accidents. Furthermore, the accidents of falling (7), falling objects (3), and electrocution (2) have the highest frequency of recorded fatalities. According to the results of this stage and the conducted PHA, the accidents of fall from a height, falling objects, and electrocution were selected, and the causal network of the accidents related to these three accidents was developed.
Furthermore, active performance indicators were determined according to the results described in the previous paragraph.
As Table 3 shows, 32 active KPIs of construction and installation of the refinery were selected based on the SMART criteria and occurrence probability of the causes of accidents with the BN.
The final list of determined KPIs based on construction operations
The aim of the present research was to provide a model to determine the safety LPIs in a safety management system in the construction of oil and gas refinery projects. For this purpose, the model was developed by studying previous researches and then prioritizing the leading safety performance indicators in construction projects. For this purpose, 116 safety performance indicators, both structural and operati-onal, were developed based on the OHSAS 18001:2007 management system. The main reason for using the OHSAS 18001 management system components was their use in the majority of companies active in the construction of oil and gas refineries. In previous studies like the one conducted by Podgorski, leading safety performance indicators were developed based on the ILO-OHS-2001 management system components, and KPIs were developed for use in all industries that only considered operational LPIs [18]. One of the main purposes of developing indicators to measure safety performance in construction projects was to rank and compare the safety performance of the project contractors. Thus, it is necessary to consider all aspects of the functional safety management system for an accurate assessment of the situation. However, the performance indicators presented by Podgorski do not cover all aspects, but the model presented in this project divides the indicators into two types: active and passive, which is according to the definition given by Hinze et al. [3]. In the first part, passive indicators in the structural and operational fields are defined. To develop active performance indicators, the construction phase activities of refineries and major accidents occurring in such projects should have been recognized. According to the statistical analysis of the events that occurred in five projects (Fig. 4), falling from a height was the most serious form of accident in terms of frequency and severity, being in consistent with the results of previous studies (such as [36, 37]).
Considering the statistics of incidents in construction industries and the nature of rapid changes in operational conditions in this field, LPIs should recognize rapid changes in the safety of activities. In this study, active indicators were developed based on of Hinze’s definitions as a part of LPIs (Table 3). Hinze et al. showed that active performance indicators were one of the operational performance indicators that are measurable within a short period. Abdelhamid TS et al. stated that unidentified unsafe conditions were one of the major causes of accidents in construction projects; therefore, active performance indicators should enable the measurement of safety condition in the short term. To overcome the limitations of active performance indicators defined in the study by Hinze, the indicators in the present study were designed to detect unsafe conditions. The strength of this study is that the BN was used to determine the direction of the causal pathway. The BN’s excellence in risk assessment and determination of the causal pathways lies in the fact that the variables can be considered together; thereby making it easier to determine relationships between the different levels and causes of accidents. Additionally, the calculated accuracy rate was higher for the probability of events. Correctly determining the accident causal network is the most important factor to identify the active safety performance indicators. The use of a proper method of accident analysis can improve the validity of performance indicators. Therefore, according to the learning capability and modeling of the structure of the causative relationships in the BN, the path of determining active LPIs is more authentic. In addition, studies by Khakzad et al. emphasize the validity and effectiveness of the BN compared to other methods [38, 39].
In the present investigation, the BN was used with two approaches. The first approach includes the extraction of performance indicators from the accident casual network using the structural and graphic capabilities of this method. Furthermore, the approach concerns the selection of active KPIs based on the rate of the calculated occurrence probability in different causal pathways of the main accident as one of the main criteria of indicator selection in the AHP. To select the active KPIs in addition to the SMART criteria, the indicator is highly important as a defined controlled action to prevent accidents. Herra defined active safety performance indicators as preventive control measurements [40]. According to this definition and as Fig. 3 shows, the active performance indicators extracted from accident pathways have varying importance based on the probability of the occurrence of accidents. Indicators derived from causal pathways with high probability of occurrence, according to the criteria and the AHP method, are more important and have greater weight. So, in addition to the SMART criteria, the probability of occurrence of the accident is considered to select active KPIs.
Cambon et al. described the difference between structural and operational indicators of the safety management system. Hinze et al. determined the characteristics of active and passive performance indicators in the construction industry, but the performance indicators were not comprehensively identified. In the study by Podgorski, the selected indicators were developed within the framework of the ILO-OHS-2001 system, but the active performance indicators to measure the safety level in high-risk operations were not specified. In this study, performance indicators were determined based on the challenges of previous studies. One of the main limitations of this study and former ones is the non-implementation of the validation of LPIs. It is recommended that in future studies, providing a proper model for validation of the performance indicators be considered.
Conclusion
The results show that determination of LPIs should be based on the type of operation and the identified hazards of the workplace in addition to the OHSMS components. LPIs extracted from the components of the safety management system deployed in an organization are often passive and cannot show the changes in the safety status of a workplace in a short period. One of the benefits of the present study was to solve the above-mentioned problem. The model presented in this study was designed with an emphasis on extraction of active and operational indicators, as they are capable of detecting performance changes in construction industries. Considering the high-risk nature of construction operations and rapid changes in safety status, it is necessary to select LPIs. One of the limitations of using this model in construction projects is the large number and variety of operations and associated accidents. In this study, weights of KPIs selection criteria and OHS-MS components were considered equal. It is recommended that to prioritize and select more accurately the KPIs, be weighted of these selection criteria and OHS components in the future study. It is also recommended that this model be validated in the construction industry and other manufacturing and service industries.
Conflict of interest
None to report.
Footnotes
Acknowledgments
The authors would like to thank all panel experts who cooperated in this study.