
Abstract
BACKGROUND:
The role of appearance of automotive seats on perceived comfort and comfort expectancy has been acknowledged in previous research but it has not been investigated in depth.
OBJECTIVE:
To identify the effects of the appearance of production automotive seats, based on the hypothesis that visual design differentiations are affective in creating comfort expectations. The significance of the descriptors Sporty, Luxurious and Comfortable and the associated visual design attributes was of interest.
METHOD:
Images from 38 automotive production seats were used in an image-based card sorting app (qCard) with a total of 24 participants. Participants were asked to categorize the different seat designs varying from 1: least, to 9: most for all three descriptors.The resulting data was analyzed using hierarchical clustering analysis.
RESULTS:
The results indicated that the perceived Sporty, Luxurious and Comfortable were descriptor items that significantly differentiated seats with certain design attributes. It was found that for the Sporty perception the integrated headrest design and angular shapes were key. On the other hand, the Comfort perception was characterised by seating with a separate headrest and rounded seat back/cushion shapes.
CONCLUSIONS:
For seat design processes, the method enables a practical way to identify elements conveying Sporty, Comfortable and Luxurious perception.
Introduction
The seat is perhaps the largest significant point of interaction with any vehicle [1], which plays an important role in the overall impression and appeal of that particular vehicle [2]. Automotive seat comfort is also becoming a key topic for all car manufacturers when designing upcoming models [3]. In this respect, providing optimal comfort attributes that support both the psychological and physiological comfort experience as a whole is the utmost goal of the new seat designs. The concept of automotive seat comfort is regarded as a highly subjective and multi-faceted phenomenon where comfort assessment is generally held with different tools and scales with increasing effort to quantify the feelings and impressions associated with the whole experience. The comfort literature has adopted approaches to quantify comfort perception and expanded on various models describing the underlying factors and mechanisms that exists for seating comfort [4, 5]. A recent model by Vink and Hallbeck [6] specifically defines and denotes different underlying mechanisms leading to outcomes of discomfort or comfort or both in relation to various studies cited in literature. Van Veen and Vink [7] extended this comfort model for additional tactile and sensory experiences as a pre-condition that influence comfort expectations of the user regarding the automotive seats. It was deduced that physical interaction with a different product will influence the evaluation of an automotive seat in terms of the sensation of tactility properties. However as the study was conducted with draped seats, the visual properties and how it affected the expectations were not investigated.
Erol [8] conducted a study to identify and analyze how the “holistic automotive seat comfort experie-nce” was constructed retrospectively by the consu-mers. The results revealed three major dimensions: Visual Impression & Aesthetical Appearance Design, Safety & Design Functionality and Feelings & Well-being. In relation to the product design literature, these dimensions were consistent with think-feel type of products where Creusen argued that “think” and “feel” dimensions regarding the information processing of products were independent of each other [9]. The “think dimension” relied on functional proper-ties while the “feel dimension” focused more on emotions and self-expression attributes. This was in contrast to the comfort model for automotive seats put forward by da Silva et al. [10] which suggested 5 facets consisting of physical, psychological, object, environmental and context. The study was based on academic studies and a construct based on literature review where both comfort and discomfort descriptors were categorized under the facets. This was found to be convoluting the facet definitions and not very clear with various indicators. The card sorting approach on the other hand enabled end users to category label their comfort experiences directly associating to the cluster of comfort descriptors. The basis of the rationale for the descriptors for the Aesthetical Appearance Design and Safety & Design Functionality was arguably rooted in the product appearance roles [11]. Focusing on the aesthetical appearance design, the descriptors and the categorizations reflected certain physical features of automotive car seat as design cues. Moreover, luxury, plush, sleek, elegant, sporty and other various descriptors (attributes) were found to play a vital role in the holistic perception of perceived comfort in automotive seats which were classified under the visual impressions dimension.
Pinkelman [12] hypothesized a consumer utility model of “comfort characteristics for automotive seats”, where he argued that comfort/discomfort, sporty and luxurious were the three key variables to characterize any car seat in terms of “comfort characteristics”. These theoretical assumptions relied on a previous study [2] where the seat styling had the greatest impact on the overall customers rating of seats (e.g. JD Power and Associates APEAL Survey). Pinkelman further argued that the utility function represented comfort experienced by users depending on the difference between expected and actual comfort based on these variables, where discomfort was denoted as a detraction from comfort (e.g. fatigue, pain). Hence it can be argued that the “expected comfort” be defined as the appraisal for the design in terms of what will be experienced as “comfort” holistically, where in accordance with Vink and Hallbeck model expectations and comfort have specific relationship [6]. In support of this argument, referring to the semantic interpretation of products, Monö [13] underlined that “ ... the product form that the eye sees creates in the observer, expectation of what the other senses will perceive” (p. 62) where the previous studies conducted by the author [6] and literature review indicates that automotive seat comfort experience has a visual component guided by product appearance roles [11]. Thus the proposed descriptors of sportiness and luxury have to be valid in both the visual evaluation time domain as much as the physical experience time domain.
An empirical study by Kamp [14] physically assessing three different automotive seat designs (no visual exposure) with varying seats’ physical features (width, steepness of side wings, contour etc.) adopted evaluation items of comfortable, protected, relaxed, sporty and luxurious verified by Zenk et al. [1]. It was reported that the seat designs were significantly differentiated on luxurious and sporty feelings where the variable comfortable was not found to be significant. This led to the conclusion that only sporty and luxurious seat have specific design characteristics that are recognizable by the participants when the seats were covered [14]. Moreover as reported by Vink et al. [3], when participants were asked to indicate the seat they would like to have in their own car, the soft seat with prominent wings was deemed more luxurious and protected which also received higher average rating compared to the flat+hard and the curved+hard seat. One major limitation of the study was that the relationships between the significant variables and how it affected comfort were not investigated whereby the seats were not subjected to visual assessment regarding the variables. However, these findings can be partially supported by the fact that in the Erol [8] study Luxurious and Sporty descriptors were also observed where they were mostly used by male participants for describing the visual attributes of comfort of automotive seats. Based on this argument, it should be stated that the effects of gender in automotive seat comfort research has not been investigated in depth. Erol et al. [15] and Zenk et al. [1] found that females were more sensitive to the appearance of automotive seats in comfort studies in terms of design evaluation. Hence Creusen [16] has also emphasized that for different product categories there are essential differences for gender in relation to product appearance roles. Specifically the findings in literature suggested that females attributed a higher importance of the aesthetic attractiveness of products and to the product portraying the correct image to others or themselves (i.e., symbolic value) than males. Furthermore, for product categories such as VCRs, coffee machines, and alarm clocks etc. it was found that females attach more importance to functionality and ease of use than males [17]. Although there is strong evidence in product design literature, this phenomenon has not been fully examined for the product category of automotive seats. In order to investigate and to identify the visual features (the tangible elements) that prompt these experiences, a number (or a family) of production seat designs are necessary with incremental variances in the designs [18]. Moreover the selection of the descriptors that the products evaluated against are crucial for extracting the value of the particular attributes.
Therefore, the aim of this study was twofold. First, to explore the effects of the appearance of aut-omotive seats on expected comfort based on the hypothesis that visual design differentiations lead to a taxonomy of perceptual attributes assessed. This in return is expected to provide an understanding as to which visual attributes are affective in creating comfort expectations. Second, to enhance the understanding of comfort descriptors for “automotive seats” in relation to the visual design. The pre-determined variables of assessment for automotive seats were identified from literature and from the visual impression descriptors as Sporty, Luxurious and Comfortable [2, 14]. The relative relationships that hold for the three proposed descriptors were also of interest.
Materials and methods
Experimental design and stimuli
An extensive range of automotive seat pictures were adopted from the AUDI AG [19] website representing every model with approval. The rationale behind the selection was the amount of variance in seat shapes within the family of seats for every car segment of the AUDI range which provided a good source for the relative assessment in scope of this study. These seats were selected from the models A1, A3, A4, A5, A6, A7, A8, Q3, Q5, Q7, TT and R8. For each model AUDI offers a “normal” (alternatively referred to as standard) seat, a “comfort” seat and a “sport” seat type, where for certain sports car segments “shell” seats (or alternatively bucket seats) were also offered (See appendix for the selection of 38 car seat pictures). These seat renderings were available in monochrome (see Fig. 1).
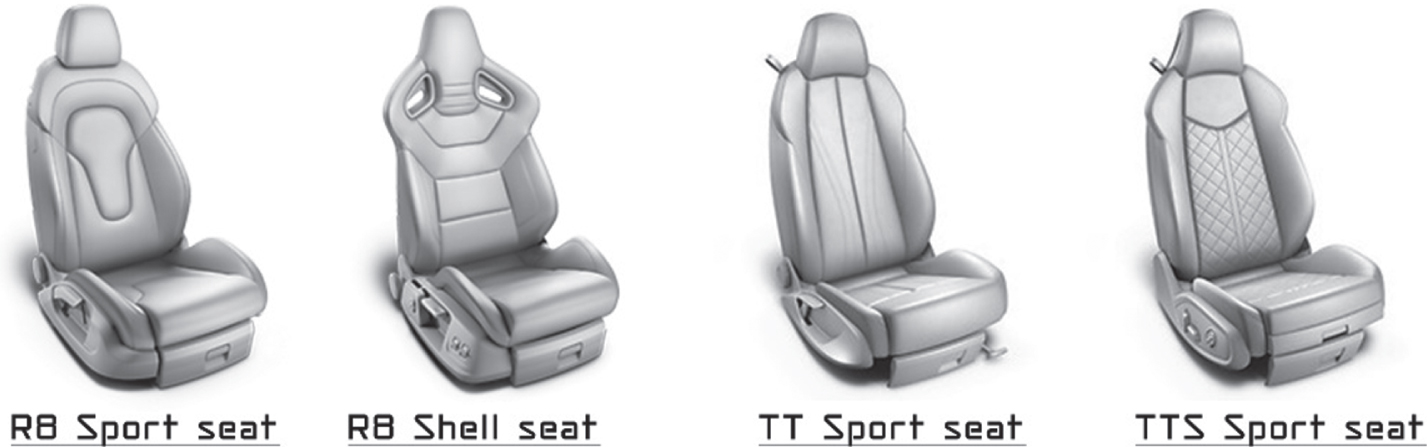
Four of the 38 AUDI seat designs for performance cars, “Sport” to “Shell/Bucket seat” types offered on the AUDI AG website in 2016.
The 38 seat designs had consistent features and functional parts throughout the sample (i.e. trenches, tie-down lines, seat inserts, seat back and seat cushion side bolsters) and were in accordance with the generic automotive seat designs as depicted in SAE Standard J2732 2008 “Motor Vehicle Seat Dimensions Standard” [20]. This ensured that the comparisons among the seat designs could be attributed to the individual variances in the design.
A sample of 24 people (equal gender split, mean age = 35,5, min = 20, max = 59, SD = 11.4) took part in the study and were all university students and staff. All participants had a U.K. driving license and at least 3 years driving experience.
Data collection app
Utilizing “qCard Sorting” [21] app on an iPad, the participants were asked to sort the different seat designs along the descriptors of Sporty/Comfor-table/Luxurious, where they distributed and rated the set of seat images in to nine groups ranging from least (sporty/comfortable/luxurious):=1 to most (sporty/comfortable/luxurious):=9. The first sort allowed the distribution in to three major groups followed in to then in to nine-groups, a methodology inspired by divide-and-conquer sorting algorithm (see Fig. 2) [22]. This principle is applied as the three step approach of divide-and-conquer paradigm 1) divide the problem into a number of sub problems in the first stage,2) conquer the sub problems by solving them recursively and 3) combine the solutions to the sub problems into the solution [22]. Lin [21] designed the app to ease the sorting of a high number of cards and utilized the approach that allowed each individual seat image to be freely browsed at the left hand side of the iPad in a circular scroll fashion and indicated that sorting the card by dragging in to three stacks first made the interface more naturalistic (see Fig. 2). The seat designs were first all displayed in identical properties where the seat image sizes were kept constant individually (4x4 cm) on the virtual cards of the iPad app, in monochrome and ¾ perspective viewing angle in order to provide a cross examination of all the seat designs.
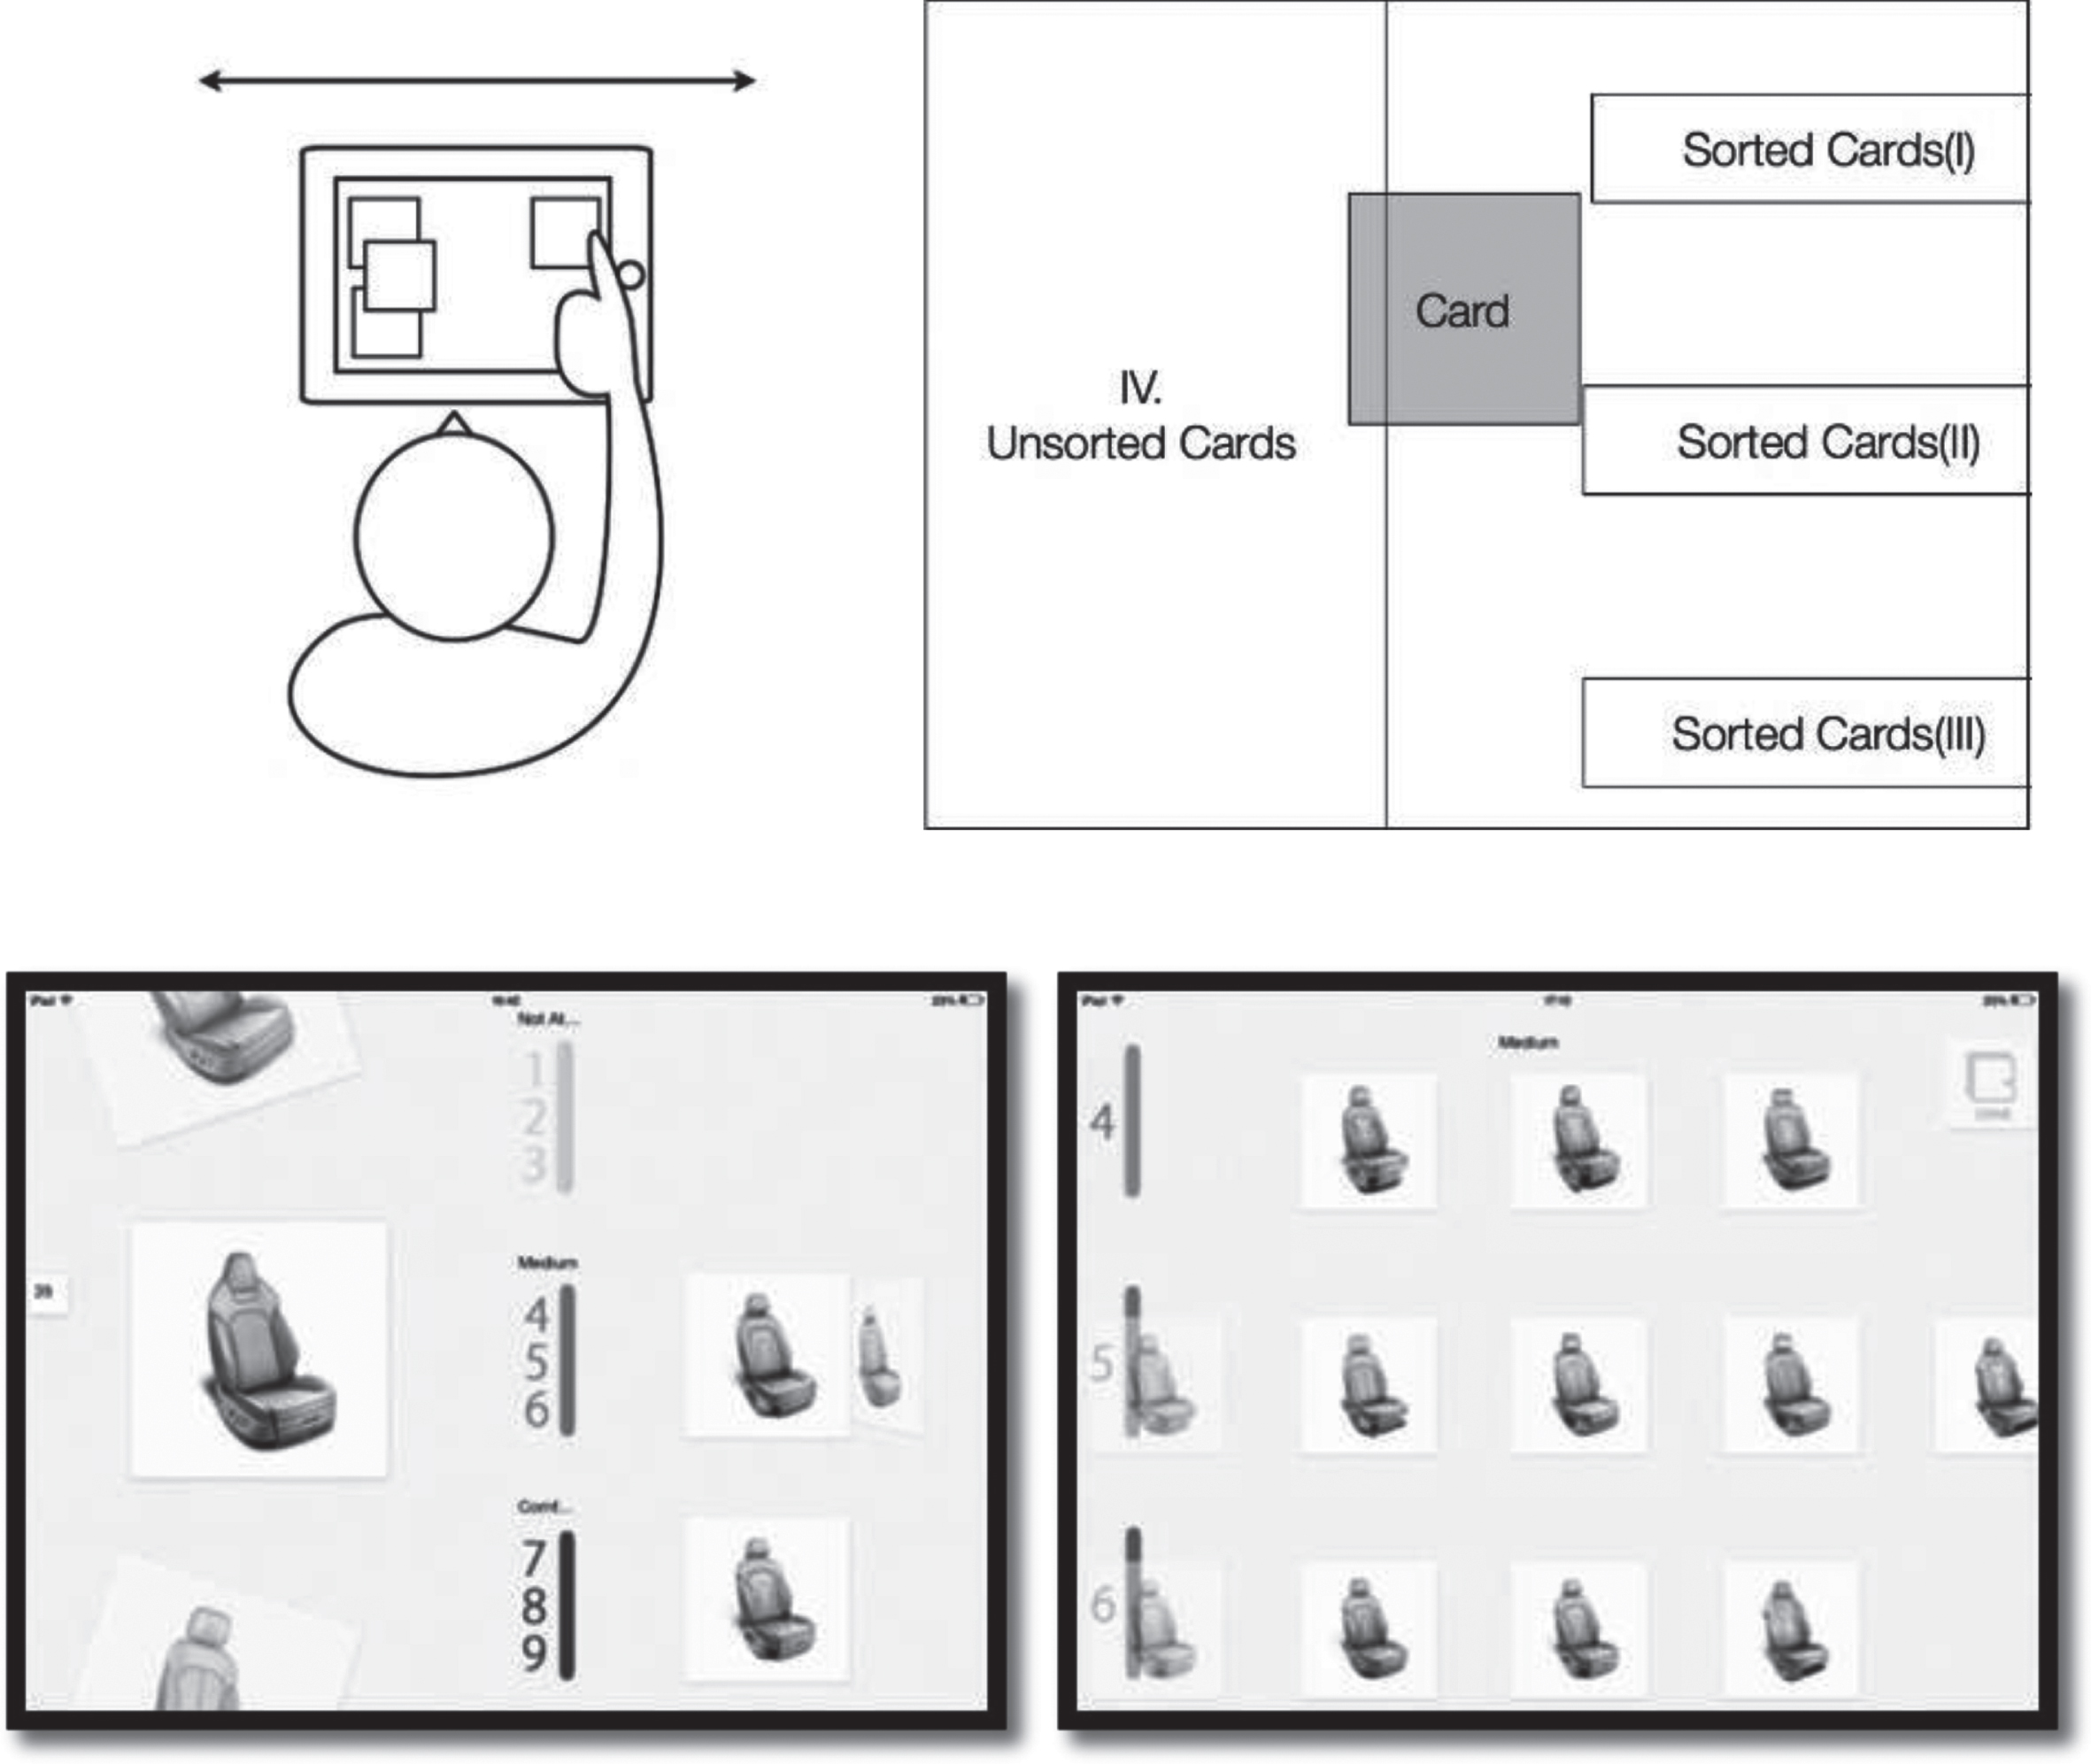
The design of the app only enables the distribution of cards in to three major groups at first (top) indicating the drag and drop of the movement for seat images [19] and the typical subsequent scroll screenshots of the iPad app for sorting phase (on the left) final phase after sorting and fine tuning between categories (on the right).
Each of the three descriptors was entered on the semantic scale each time on the iPad app for every sorting task (and presented in a randomized order). This was a within-subject design where all the participants were instructed to sort the images for all the descriptors Sporty, Comfortable and Luxurious. They were informed that the least to most category scales from 1–9 formed a rating for each seat (see Fig. 2). The application finally allowed the participants to see the rating at the end of each sort by scrolling through the whole range where it enabled a final review and if desired allowed them to amend their sorting results. The participants were specifically not informed of the particular brand. There was no time limit to perform the sorting task but typically took around 20–25 minutes. Following the sorting task, a post-trial semi-structured interview was conducted to obtain participants qualitative comments regarding which attributes of the seat designs effected their sorting task regarding the descriptors utilized.
Analysis
The data was analyzed with standard non-par-ametric tests and Hierarchical Clustering Analysis (HCA) which forms clusters of seats with respect to the rating scales used in the study [23]. The HCA used “average linkage” algorithm which tends to produce clusters based on measured characteristics with rather low within-cluster variance [24]. The resulting “dendogram” produces a tree of hierarchy, where the shorter linkage distance from the origin indicate the similarity of the objects. Following the clustering, the mean rating values for each individual seat design on the descriptors e.g. Comfortable versus Sporty, was utilized to display the design differentiation effect of the 38 seat images [23].
Results
Analysis for individual car seat designs
The mean values with regards to the three descriptors provide an insight in to the effect of the particular attributes and their effects on the perception for each seat design.
The bucket/shell type seats had the highest Sporty mean ratings where the R8 Shell seat had the highest rating (mean = 8.46, SD = 1.67). The A3 Normal seat had the lowest rating (mean = 2.17, SD = 1.5) (see Fig. 3).
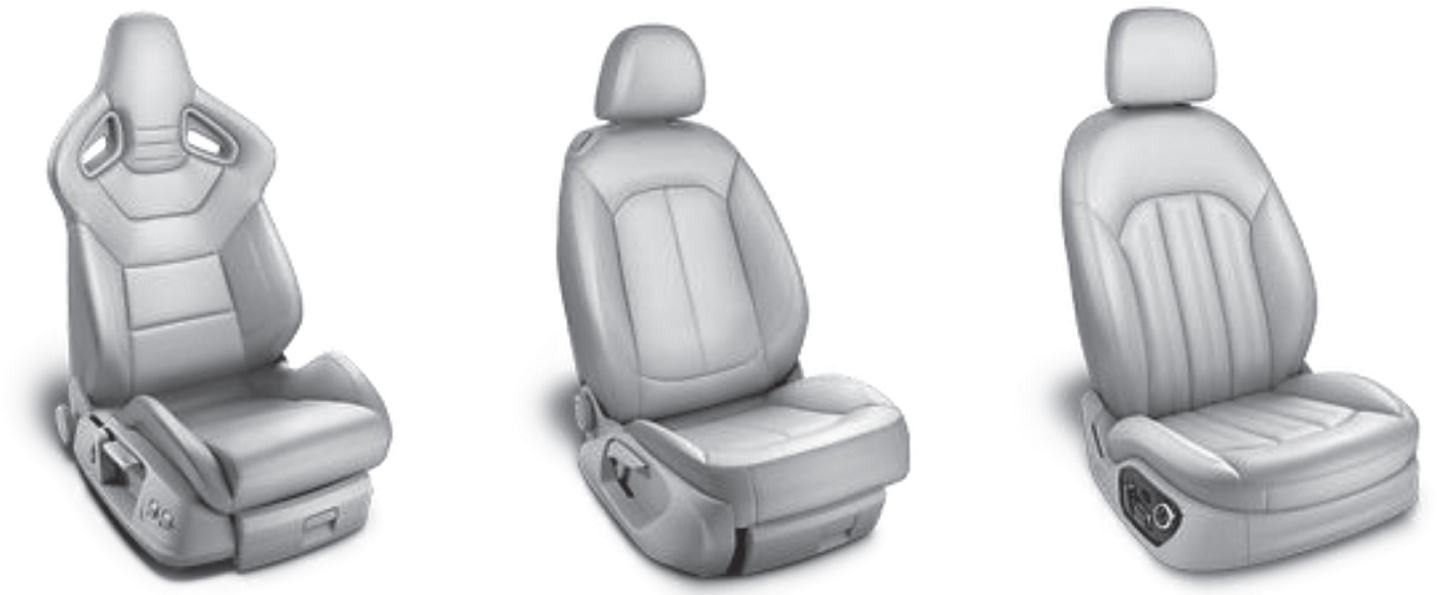
R8 shell seat (on the left hand side) had the highest Sporty mean rating. The A3 Normal seat was the lowest mean rating (in the middle) and closely followed by the A8 Normal seat (the right hand side).
The highest Comfortable mean rating was A4 Sport seat had the highest ratings (mean = 6.54, SD = 2.14). The Q5 Normal seat had the lowest ratings (mean =3.13, SD = 1.8) (see Fig. 4).

A4 Sport seat had the highest Comfortable mean rating (on the left hand side). The Q5 Normal seat has the lowest mean rating (on the right hand side).
The highest Luxurious mean rating was A8 Sport seat (mean = 6.50, SD = 2.4) where The Q5 Normal seat was the lowest (mean = 2.96, SD = 2.2) (see Fig. 5).
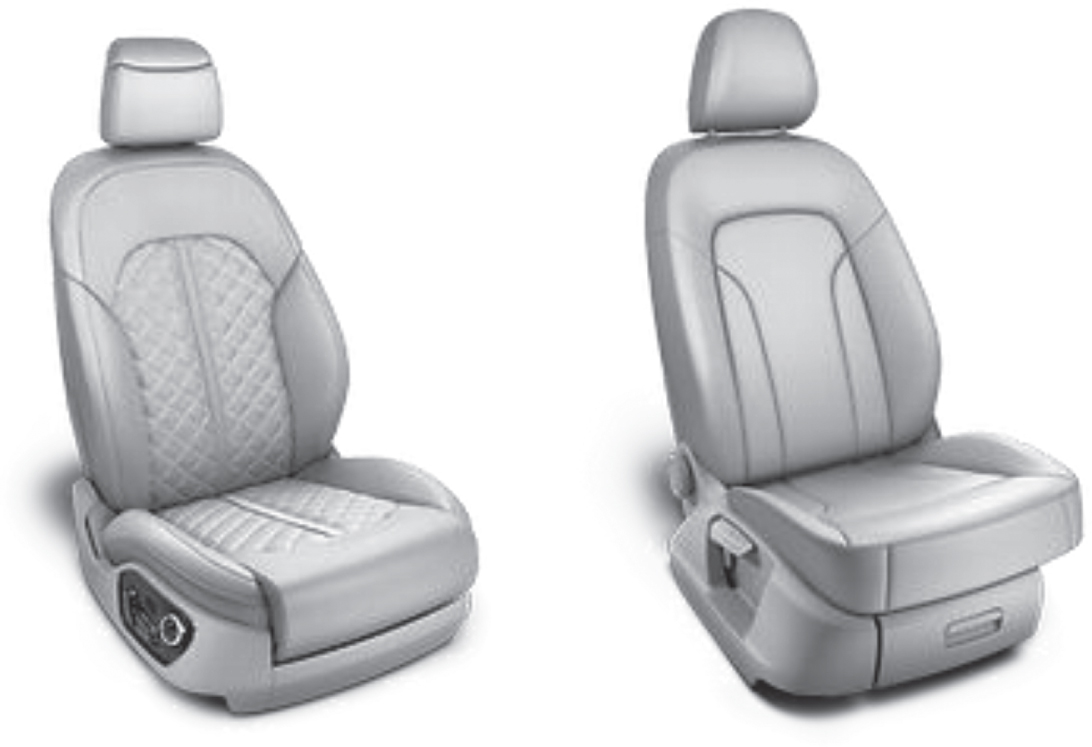
A8 Sport seat has the highest Luxurious mean rating (on the left hand side). The Q5 Normal seat has the lowest Luxurious mean rating (on the right hand side).
The Sporty rating mean values by the participants’ displayed the lowest standard deviations, which indicate that the 24 participant’s perceptions were more homogenous on this descriptor. The distribution of the Comfortable and Luxurious descriptors displayed a larger spread with higher SD in the ratings indicating that there were higher variances in the categorization process.
Friedman tests were significant across the 38 seat designs on all the three descriptors indicating a main effect of design. For Sporty (χ2 = 630.6, N = 24, df = 37, p < 0.001,Friedman test) pairwise co-mparisons indicated the 14 sport category seats were found significantly sportier than A8 Normal seat and Q5 Comfort seat. Moreover the A7 S Sport seat, A8 Sport seat, A1 Sport seat, TT Sport seat, R8 Sport seat, A3 Sport seat were also found significan-tly more Sporty than Q5 Normal seat; see appendix for each design (p < 0.05,Bonferroni correction app-lied). For Comfortable (χ2 = 131.9, N = 24, df = 37, p < 0.001,Friedman test) pairwise comparison tests yielded that A7 Comfort seat, A8 Sport seat, A6 Com-fort seat, A5 S Comfort seat, A5 Sport seat and A4 Sport seat were significantly found more Comfortable than Q5 Comfort seat and Q5 Normal seat (p <0.05,Bonferroni correction applied). For Luxurious (χ2 = 155.5, N = 24, df = 37, p < 0.001,Friedman test) Q5 Normal and A6 Normal seat were found significantly less Luxurious than 6 type of seats; A5 S Sport seat, A5 S Comfort seat A6 S Sport seat, A7 S Sport seat, TT S Sport seat, A8 Sport seat, A3 S Sport seat; see appendix for each design (p < 0.05, Bonferroni correction applied).
The aim of HCA is to link objects together and amalgamate larger clusters of increasingly dissimilar elements. The dendogram tree structures generated by the HCA procedure in Fig. 6, display the particular grouping of the seat designs. At the cut off distance at 12; determined with visual inspection for the Sporty perception, formed two distinct and separate groups. Amongst the three variables, Sporty perception can be attributed as the most coherent within subjects in terms of the distance generated. The categorization effects are congruent with respect to the mean values and SD values of the sportiness ratings (see Fig. 6) The particular group of seats which from the upper group 1(
Kendall’s W referred to as Kendall’s coefficient of concordance is a non-parametric statistic test that can be used for assessing agreement among raters’. Kendall’s W ranges from 0 (no agreement) to 1 (complete agreement). The agreement among raters’ for Sporty displayed a good level of agreement (Kendall’s W = 0.71, p < 0.0001).
In terms of the Comfortable descriptor, there were three distinct clusters at a cut off distance of 16. The first two clusters that displayed rounded back rest shapes displayed higher similarity (as indicated by branch distance) where the third cluster (
At a cut off value of 20, Luxurious descriptor displayed two very distinct clusters as shown in Fig. 6. However with a closer inspection and distance/gap analysis, 4 separate clusters are identified relevant to the design differentiation. The first seat cluster (
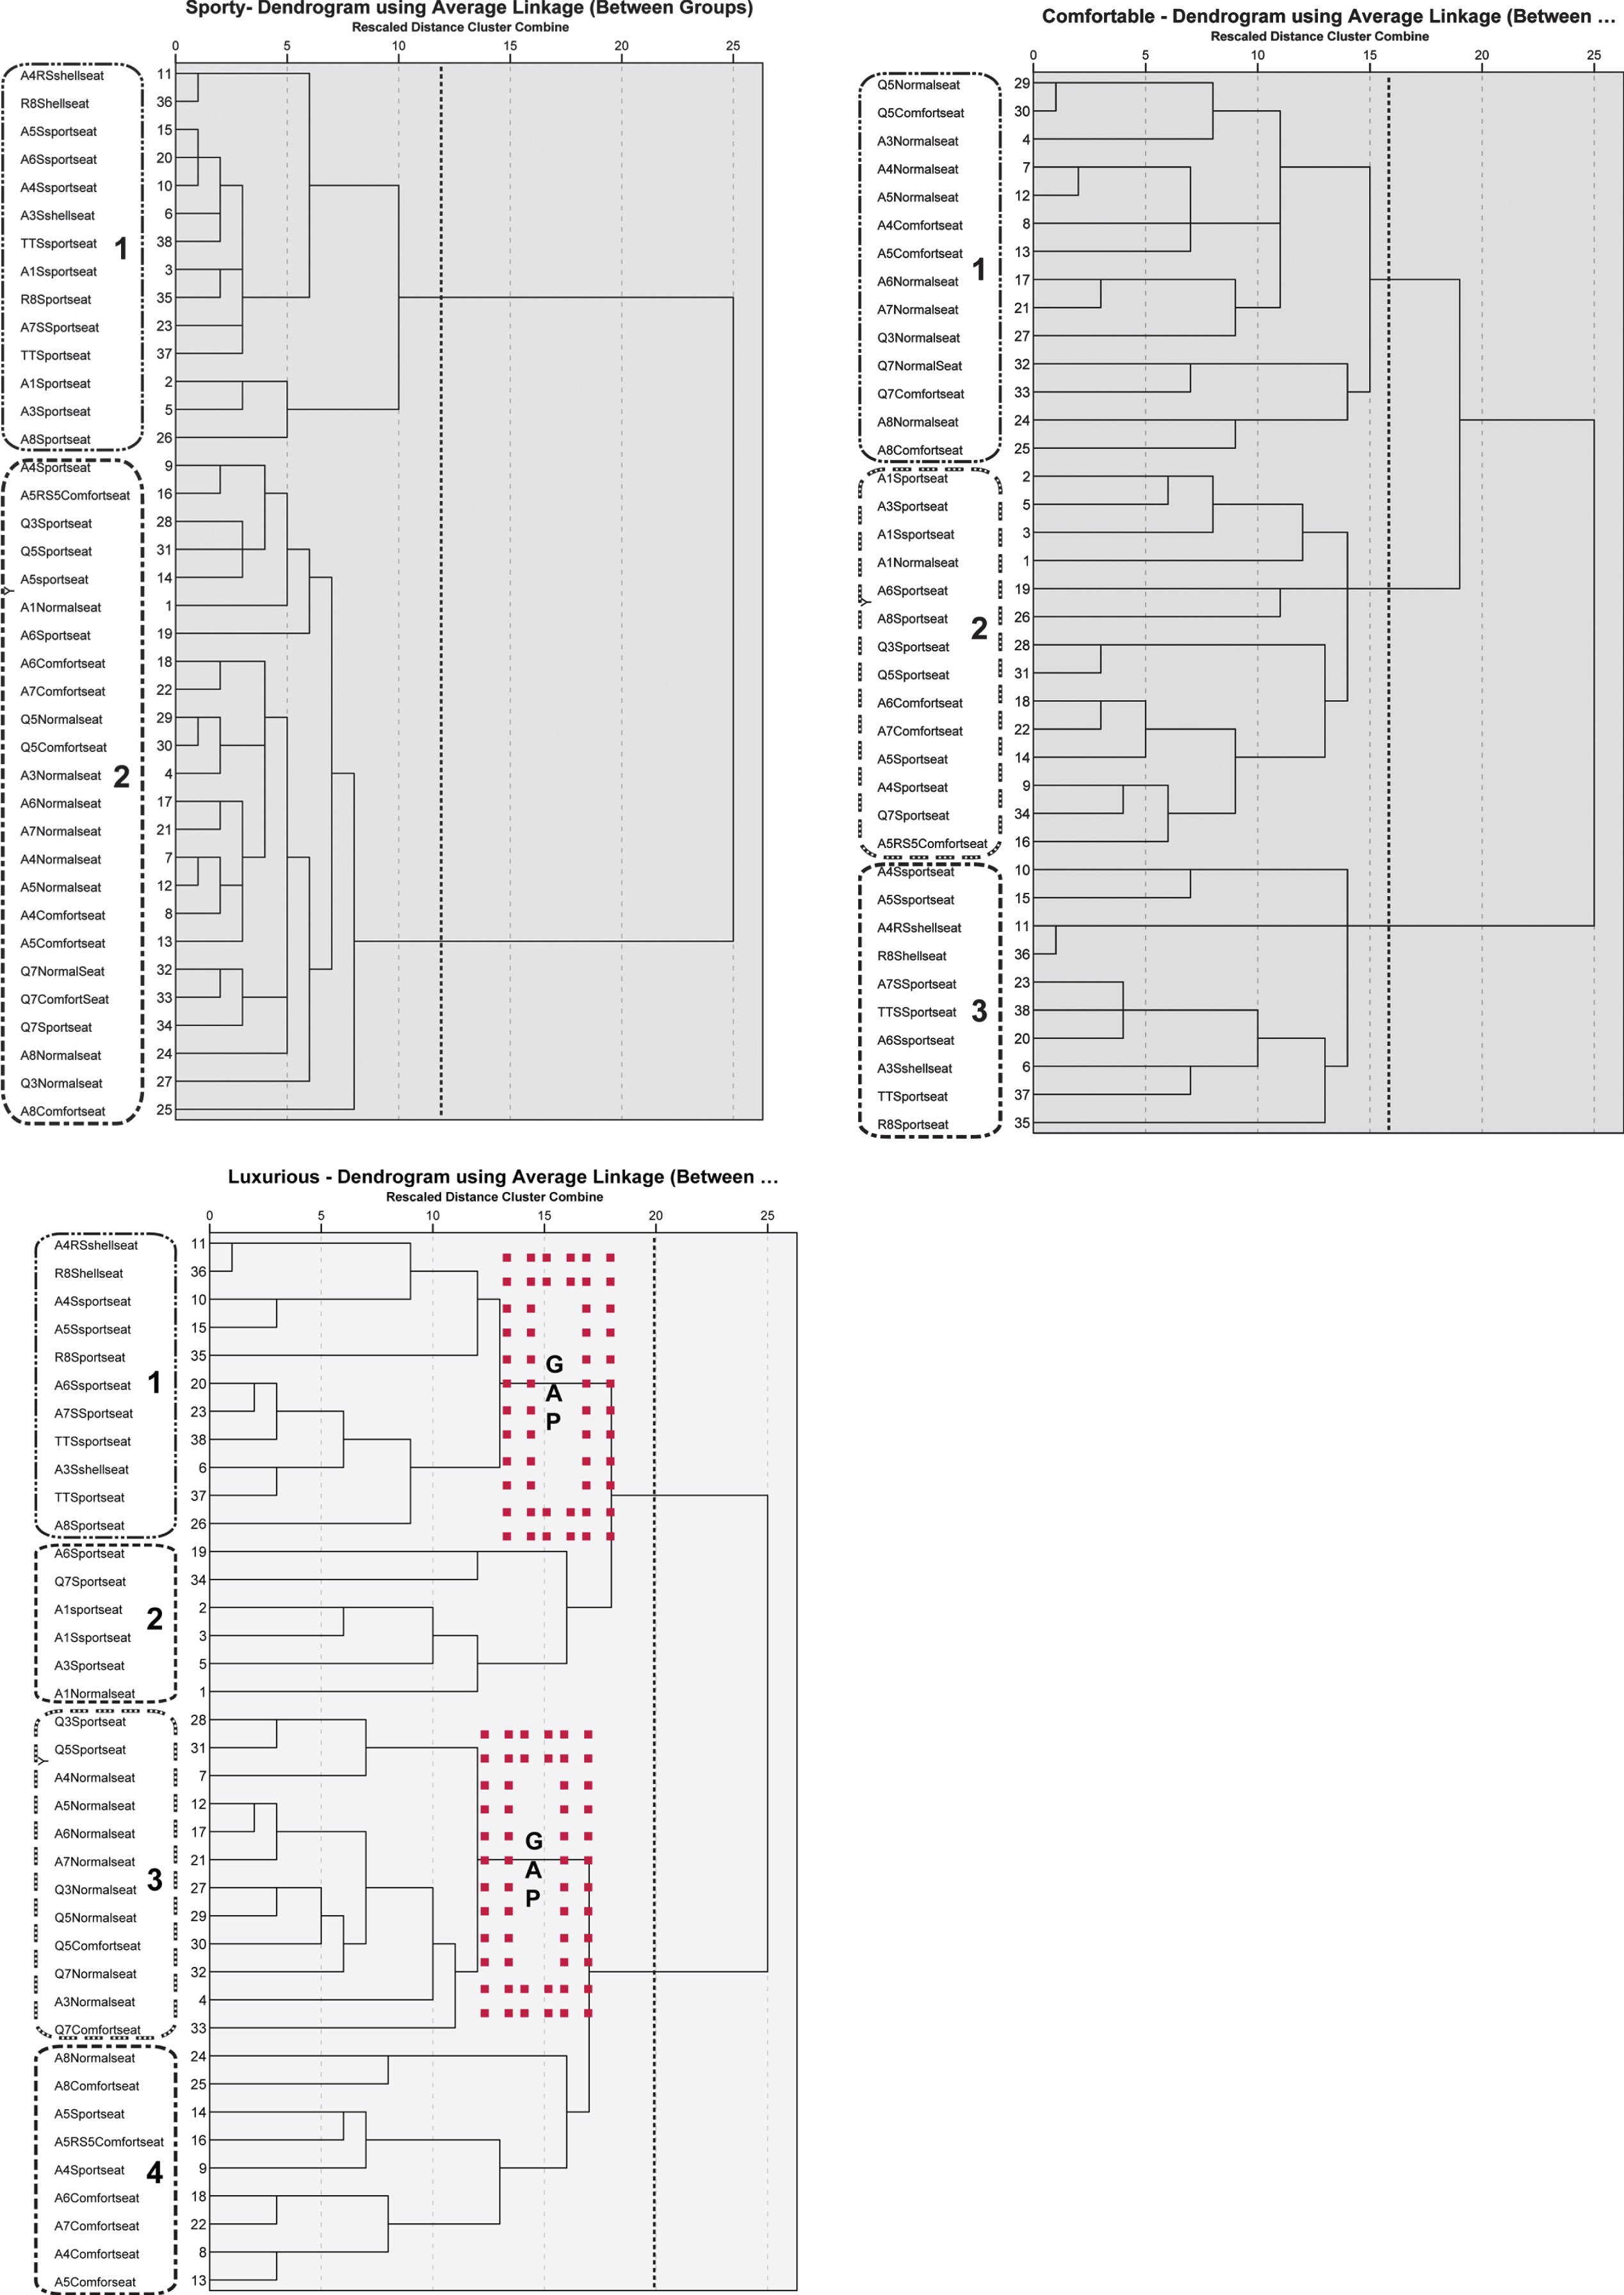
HCA dendogram for the variable Sporty, Comfortable, Luxurious with average linkage.
In order to analyze further the relationships amongst the three dimensions proposed, the results were plotted against each on a Comfortable versus Sporty regarding the mean rating values, explicitly plotting the seats on a coordinate basis. These maps were plotted in Excel with the mean values for each of the 38 seats in the categorization task to identify certain tendencies and clusters of seats.
The plot graph of Comfortable versus Sporty perception displays a clear indication of a separation in clustering of the seat designs in terms of Sporty perception (see Fig. 7A). The clusters were in congruence with the HCA cluster formation, where a closer inspection of the circled seat designs belong to the “sport” category with features of integrated headrest with prominent bolsters and shoulder support. Hence in relation to the graph plots, a quadratic relationship can be argued between the Comfortable and Sporty mean values similar to the inverted U depicting an ideal point for expected comfort being increased with increasing sportiness. The graph plot of Comfortable versus Luxurious perception displays an indication of a linear relationship for the set of seat designs utilized (see Fig. 7B).
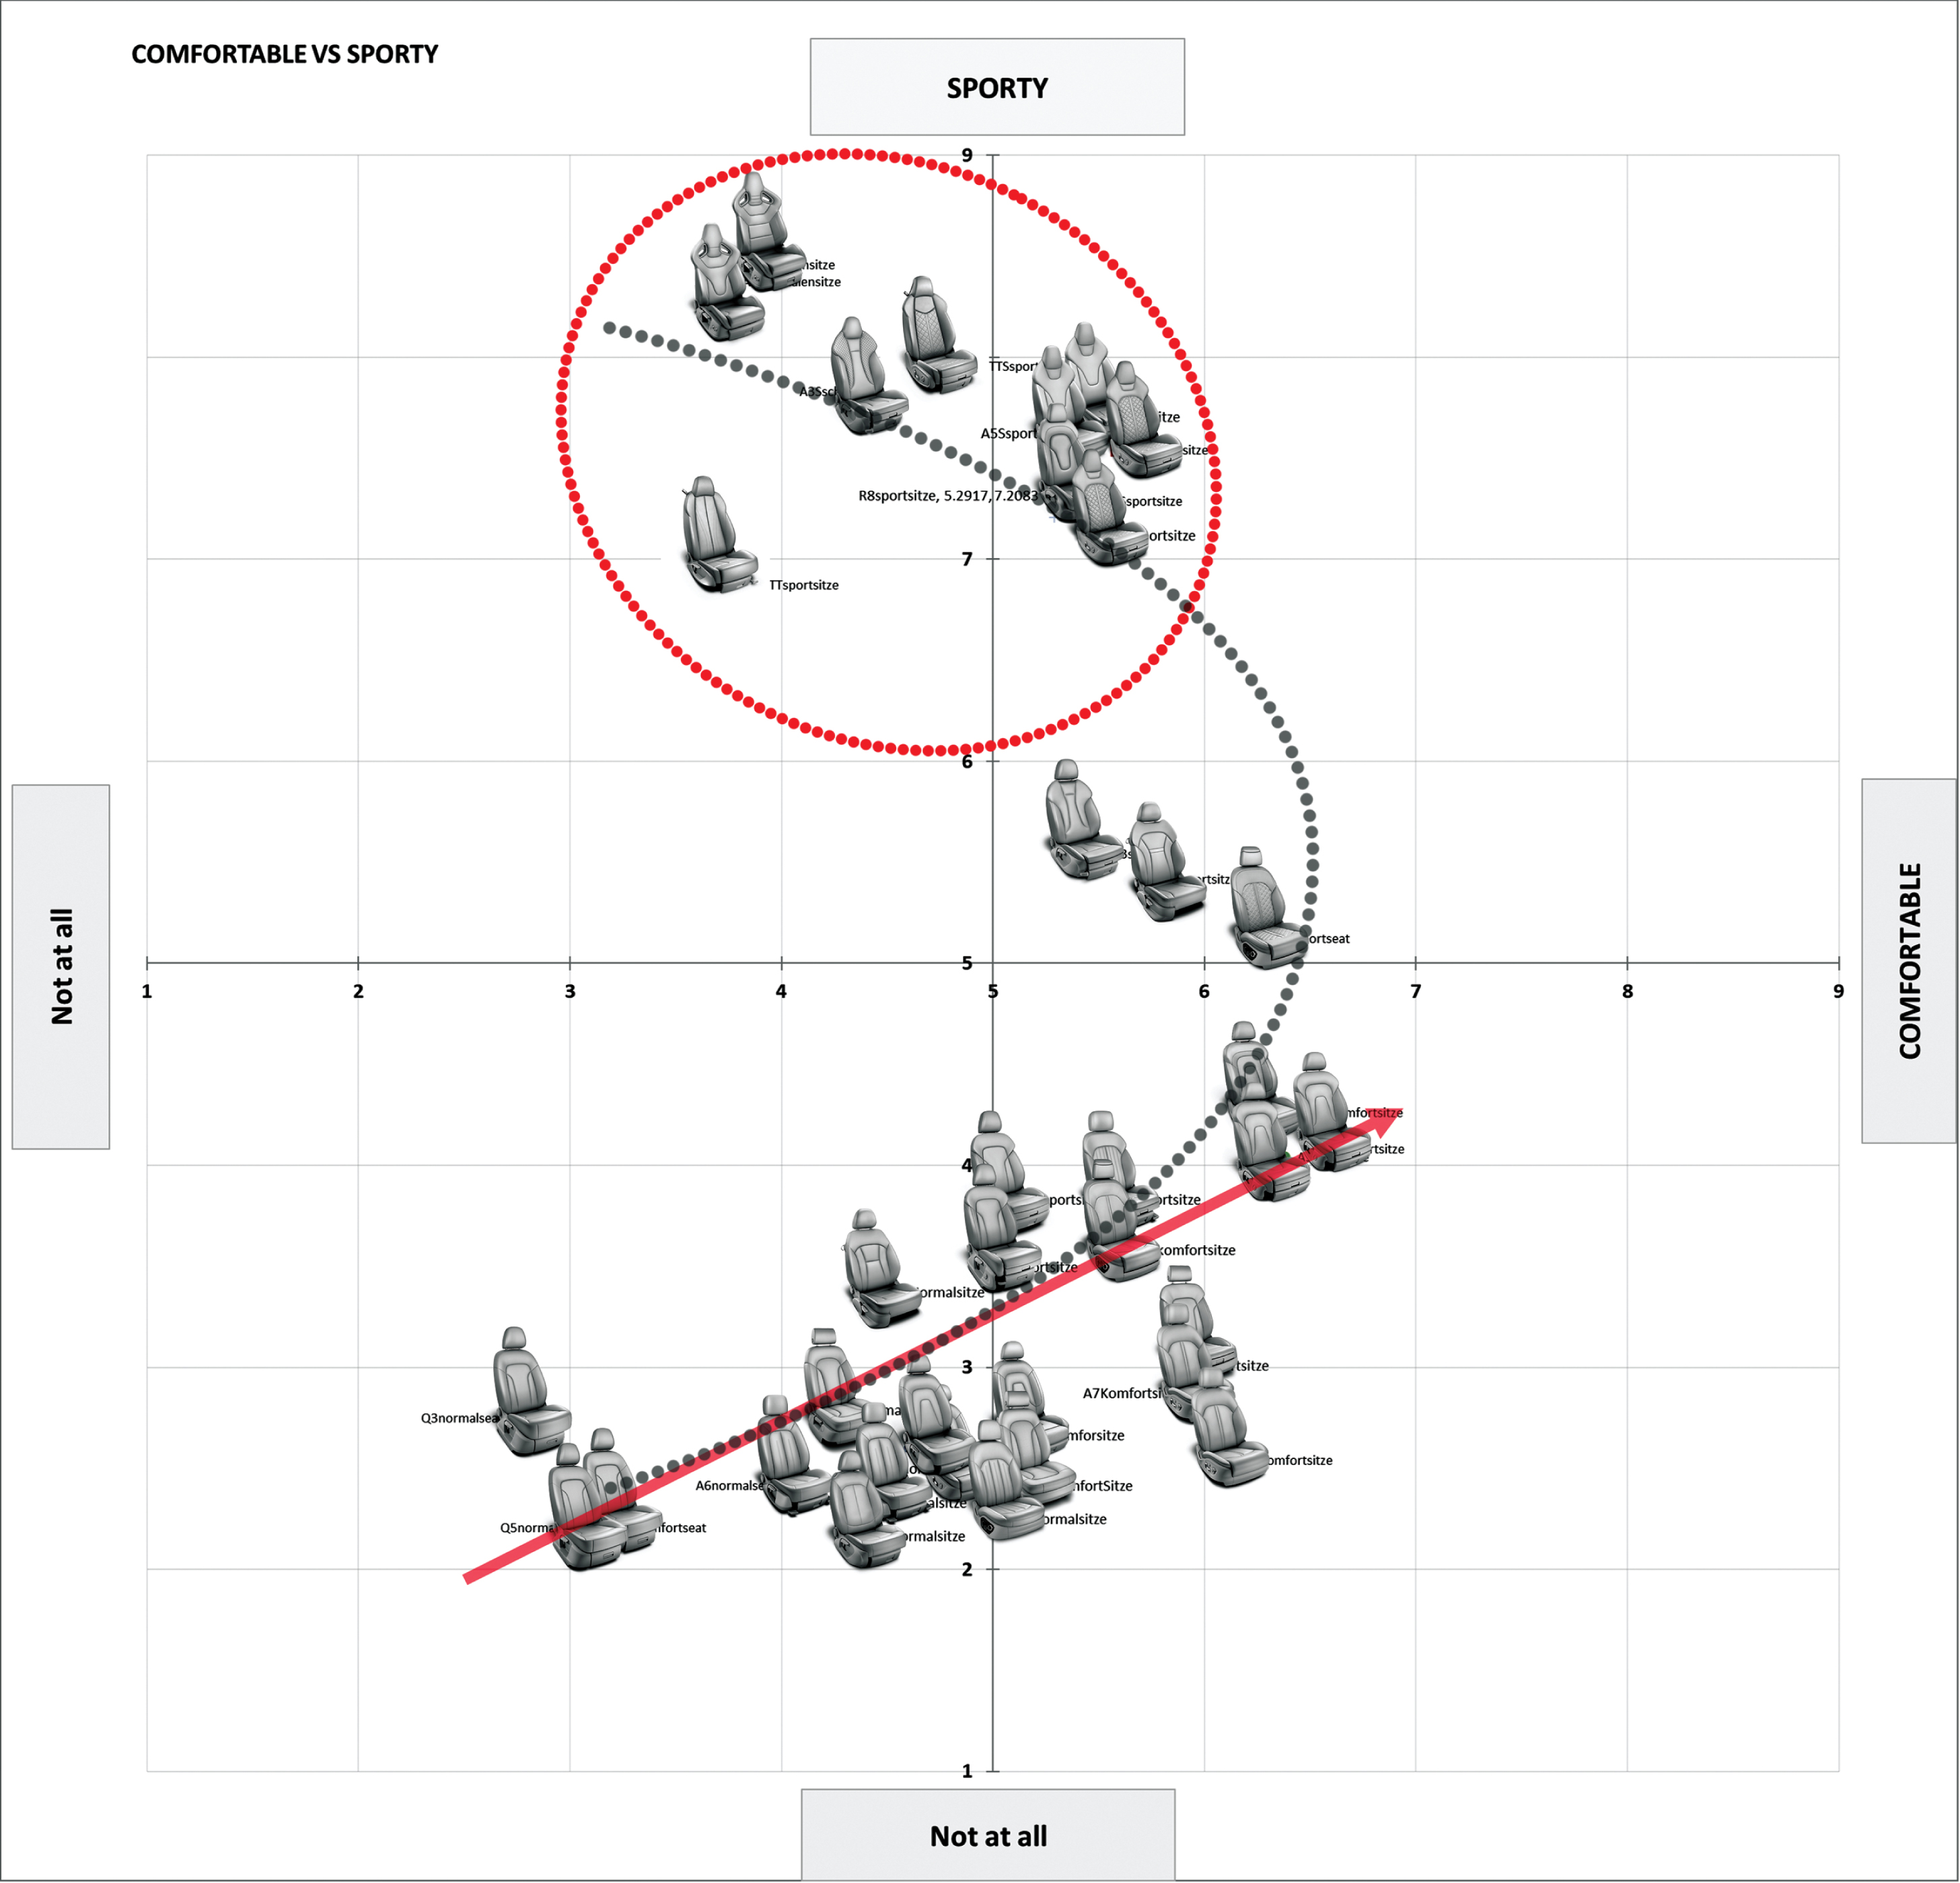
The mean value plot graph of 38 seats on a Comfortable versus Sporty perception.
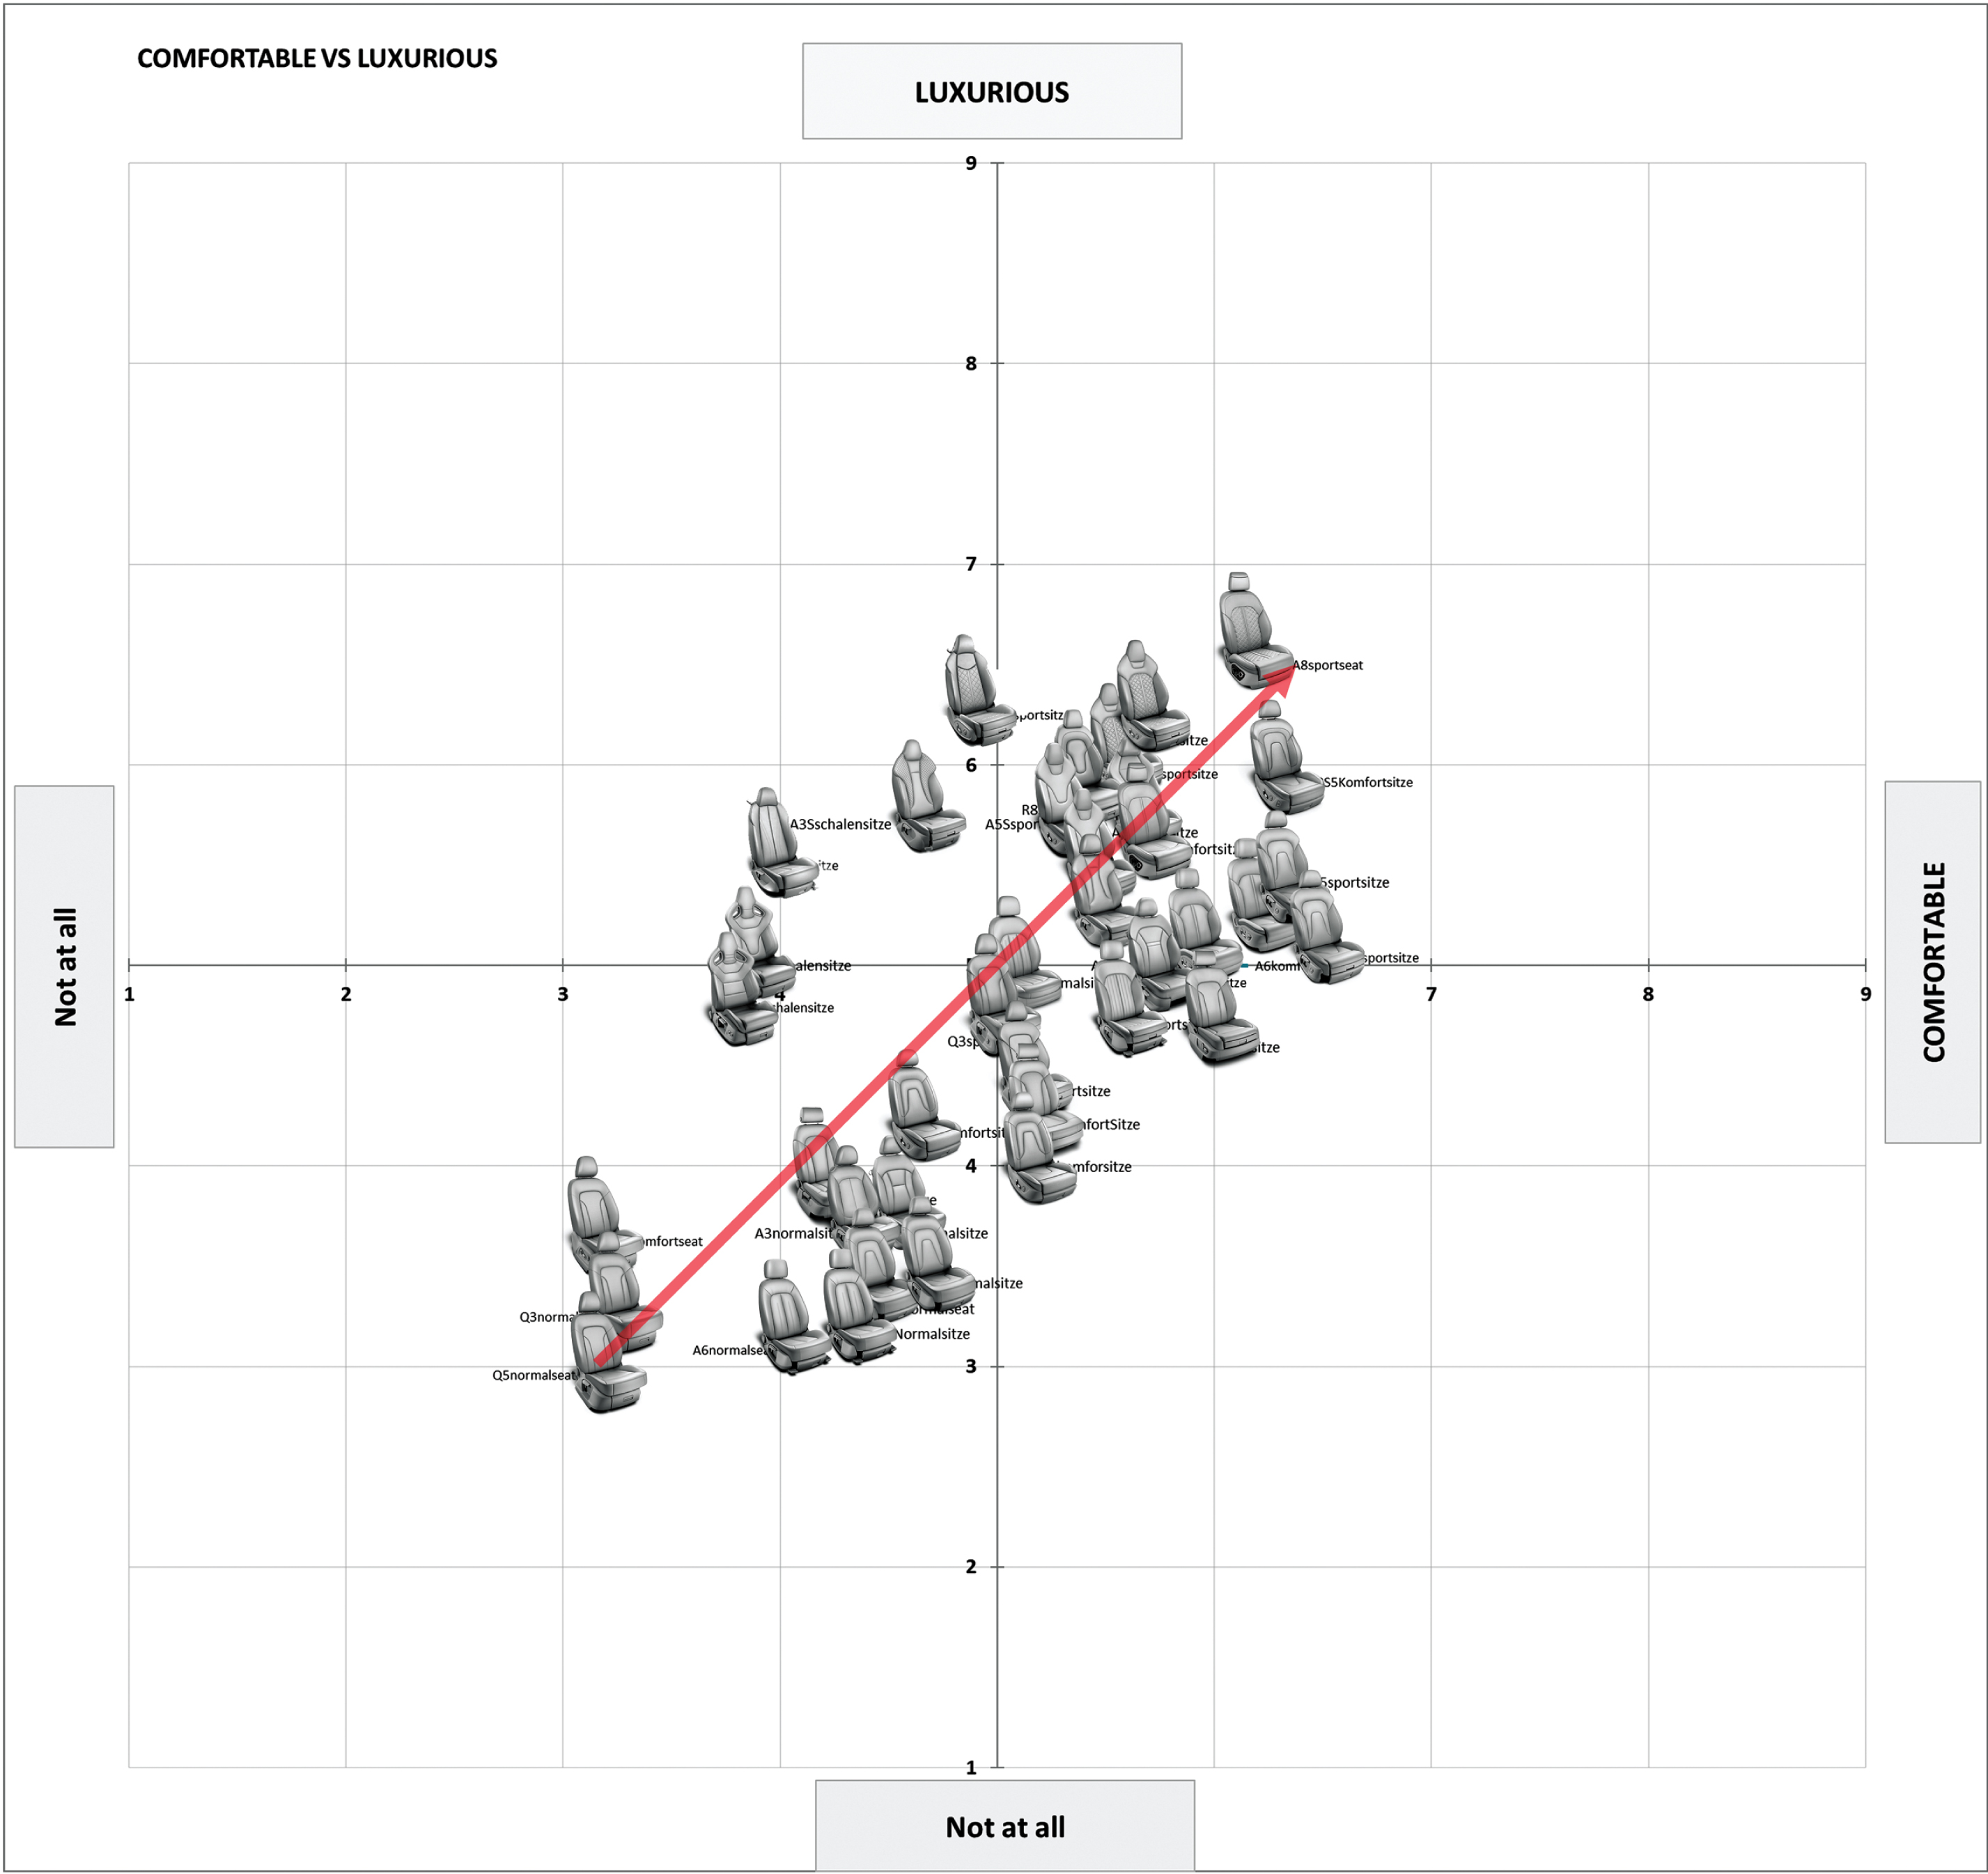
The mean value plot graph of 38 seats on a Comfortable versus Luxurious perception.
The plot graph results show that the A4 Sport seat (Comfortable axis mean = 6.54, SD = 2.14, Luxurious axis mean = 5.04, SD = 2.3) with bolstered seat back and separate headrest was found to perform better than all of the seats in terms of Comfortable. In terms of luxury the A8 Sport seat (Comfortable axis mean = 6.3, SD = 2.1, Luxurious axis mean = 6.5, SD = 2.4) was found more Luxurious.
Using Comfortable ratings obtained from the sorting exercise as dependent variable, a linear regression was carried out using Sporty and Luxurious ratings were used as predictor variables. Entering all data, a significant model emerged (F (2,909) = 74.045, p <0.000; Adjusted R square = 0.138). Both of the predictor variables significantly predicted the Comfortable ratings where, the Sportyβ=–0.065 (p < 0.05) had a negative relationship and the Luxurious ratings β= 0.390 (p < 0.0001) had a positive relationship, explaining 13.8% of the variation on comfort ratings.
Non parametric tests were carried out in order to investigate the particular differences for gender on the three descriptors. Mann-Whitney U test for effects of gender over all the ratings acquired for the seat designs was carried out. It was found that for the Sporty descriptor, male participants rated the whole sample of the seats significantly sportier compared to females, where there were no differences for Comfortable or Luxurious.
On an individual seat design basis, Mann-Whitney U tests for the Sporty descriptor revealed that, from the 38 seat designs, the only difference was for the A8 Sport seat design where the males rated the design significantly higher (U = 36.5, N = 24, p < 0.05). For the Comfortable descriptor, female participants rated the A1 Normal (standard) seat (U = 114, N = 24, p < 0.05) and A3 Normal (standard) seat (U = 107.5, N = 24, p < 0.05) designs higher than male participants. These seat designs had a single piece backrest with less pronounced segmentation and more rounded shapes in terms of design. In contrast, for the A4/S4 Sport seat (U = 33, N = 24, p < 0.05), A5/S5 Sport seat (U = 26, N = 24, p < 0.01), and R8 Shell (Bucket) seat (U = 33.5, N = 24, p < 0.05), male participants rated the design higher in terms of comfort. These seat designs have particularly pronounced side bolsters and integrated headrest designs.
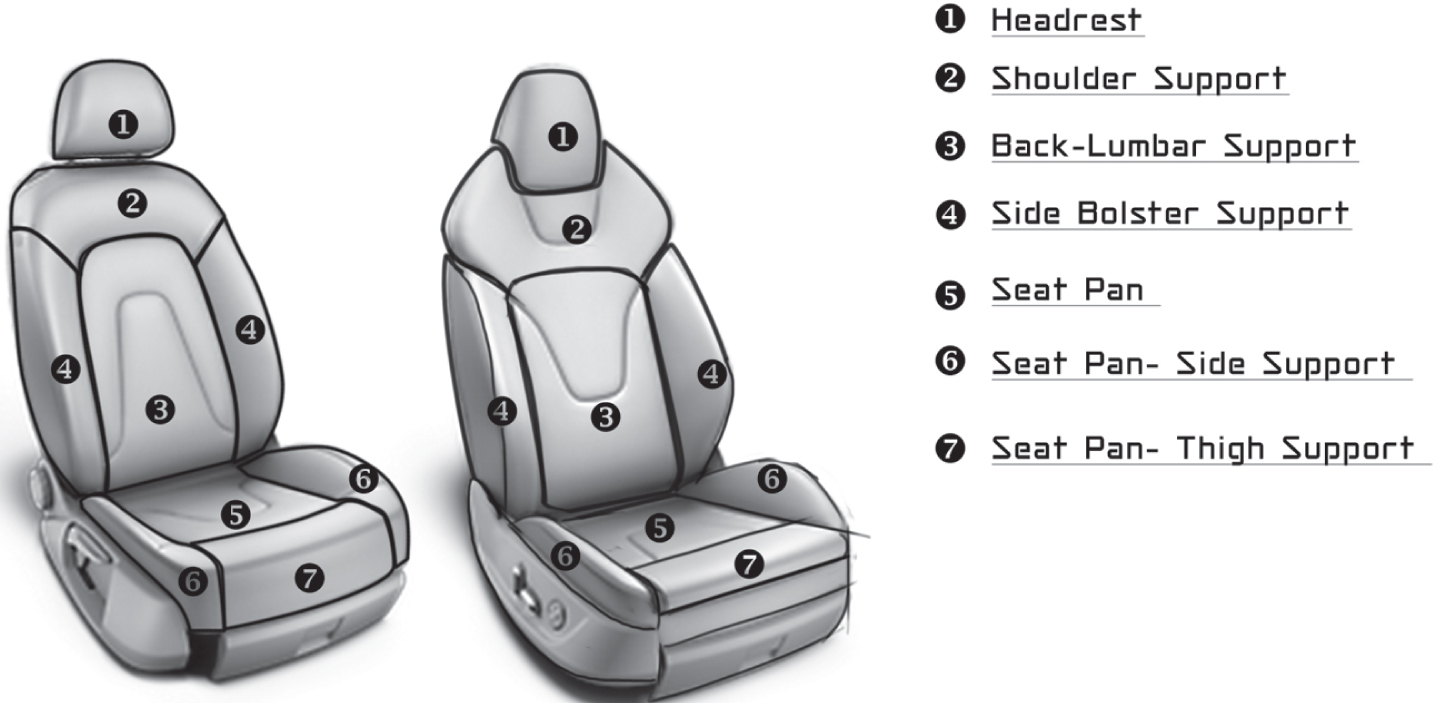
Seat attributes in generic seat design for Production Automotive car seats on the left an A8 Segment Sport seat and on the right A5 Segment Sport seat.
For the Luxurious descriptor, across the seat designs, the female participants rated the A4 normal (standard) seat (U = 111, N = 24, p < 0.05) and Q3 Sport seat (U = 117, N = 24, p < 0.01) significantly higher. These seat designs again have a single piece backrest with less pronounced trench and tie down segmentation on the backrest.
The participants were asked to comment on what they were taking into account when assessing the seat images on the particular semantic scale prompted. The sample of participants commented as a general reference to the sample of seat design while scrolling through them and indicating the particular references that they identified in evaluation and categorizing. The comments were written down in short phrases and keywords in response to the question for each dimension by the author, which were later analyzed with keyword analysis approach [25]. The referenced visual attributes for the current sample of seat designs were denoted in accordance with the generic definitions as depicted in SAE Standard [20] seen in Fig. 8.
The most mentioned Sporty seat characteristics were of “shape of the backrest”, the integrated/fixed head rest and the prominent side supports or side bolsters that was used interchangeable by the participants. 14 in 24 participants directly associated the headrest characteristic of being fixed or integrated, hence not adjustable to the Sporty characteristic of the design. 7 in 24 participants associated the angular shape of the backrest with the perception where two female participants also indicated that there was a “streamlined” look of the seat suggestive of the car design that it belonged to specifically a sports car. “Bucket Seats” or “Racing Seats” were referred to as the exemplar seat type for this variable by 6 participants. Most of the participants indicated that the Sporty categorization process was much easier to assess, compared to Comfortable and Luxurious variables. The extremity of the shapes of the side supports and the prominence was indicated to be perceivable by 17 participants specifically denoting the bolsters on the seat back and the seat pan. The narrow taller looking back design was suggestive of sportiness characteristic. However the particular characteristic features such as “hugging”, “snug” seats were indicated and interpreted by the participants as being less comfortable in use where 6 in 24 participants directly indicated that there is a bipolar relationship with comfort. Another concern raised by participants was that sporty seats were not convenient and had too much of a seat angle at the back and an inclination on the seat pan. Also the “firm” and “hard” look of the seat cushions were mentioned.
In terms of Comfortable assessment of the seats, the comments were generalizable in two themes; the level of padding and supportive segments of the surfaces that was perceivable by the participant and lesser angularity in comparison to sport seats which the comfortable seats were deemed more curved or had more rounded bolster elements. 10 in 24 of the participants made a direct association with the need for supportive surfaces on the seats where 6 participants indicated that they evaluated the amount of padding on the seat for the ability of cushioning. On top of these appearance attributes, the attribute of being “adjustable” was raised by 6 participants, whether this is limited to adjustability of the headrest or the whole seat to conform to the positional requirements. At least 4 participants mentioned that sporty and comfort were bipolar constructs and would not be compatible as sporty meant stiffer and flatter look (feel) whereas comfort was more associated with plush and padded seats. Five participants expressed explicitly that strong Sporty features such as very prominent side bolsters and wings were a hindrance to “comfort”.
In terms of the criteria and characteristics for “luxury” and “luxurious seat”, a major comment was that without the material and the color application, 8 in 24 participants deemed it very “tricky” or “difficult” to assess the seats. Most of the participants indicated that upholstery material was the key for luxury characteristic, where certain patterns (i.e. quilted upholstery pattern) lead the participants to believe or assume the seat had “leather” as upholstery material. 13 in 24 of the participants indicated that the quilt pattern in the upholstery design was the key for luxury characteristic, leading to associations by 8 of the participants such as the seat had “leather” as upholstery material. The width of seats was also associated by 4 in 24 with luxury perception, where a bigger, larger padding on the seat was referred to as more luxurious. Electric adjustment buttons were also mentioned by 6 of the participants as a luxury element that lead those to believe the seats were luxurious and expensive.
Discussion
The first aim of this study was to explore the effects of the appearance of automotive seats on expected comfort, based on the hypothesis that visual design differentiations lead to a taxonomy of perceptual attributes regarding the pre-determined descriptors of Sporty, Comfortable and Luxurious of automotive seats [2, 14]. The second aim was to explore the particular relationships between the three proposed descriptors identified in the literature. Pinkelman [12] hypothetically argued that the “comfort character”, hence expectations from a seat primarily related to the variables of “Luxury” (L) and “Sportiness” (S) in a directly proportional manner. The foundation of these variables originated from “voice of customer” surveys specifically where the seat styling above all other characteristics were found to have an impact on the appeal of the automotive seating system and various other studies focusing on physical attributes of seats. However, these surveys were not designed to determine seat characteristics and identify the effects of the seat styling and hence the relative visual design elements.
In this study with first hand empirical data the findings suggested that sportiness of a car seat is a recognized characteristic by the consumers, however utilized more as a categorical variable. In line with Erol et al. [15] study, this categorization process as a “product appearance role” [11] lead to a high differentiation between the car seat designs. The integrated headrest and prominent side bolsters were the most commented design feature typically associated with maintaining body postures, support and lateral holding ability [3]. However the effect of the headrest/head restraint was not foreseen by any of the prior research in literature. In this regard, the assessment of sportiness of a seat design was found to be “easier” by the participants which was also reflected by the Kendall’s coefficient of concordance with high agreement. It can be argued that particular referral to the integrated headrest, the emphasis on the “triangular” shape, may be considered as an indication of the saliency of the design element and relatively objective feature of the sport seat designs. Focusing on the mean value ratings of the seats and the HCA clusters formed, a segregation or “discontinuity” amongst the design of the seats in terms of sportiness was observed in relation to the integrated headrest design. Moreover it was observed that the extreme cases of Sporty created a perception amongst the participants that they have referred to as “gaming” seats using allo-referential (looking to the other fields of seat designs) semantic cues, and were deemed to hamper comfort. These effects of the categorization are in stark contrast of utilization of continuous variables in seat comfort characteristic equation proposed by Pinkelman [12]. One important hypothesis is that of an inverted-u-hypothesis [26] or quadratic relationship between the variable Sporty and Comfortable. There may exist an optimal point beyond which comfort declines: an inflection point. Future studies could aim to address the hypothesis with increased data points where a structural equation model could aid in determination of the nature of the descriptors in further detail.
For attributes that led to this categorization behavior; in terms of Sporty, the A8 Normal seat and Q5 Comfort seat design were found significantly less Sporty than the 14 sport category seat designs. The most important difference between the designs can be summarized as the sport seats possessing angular shapes and more pronounced segments (trenches) especially in the shoulder support area. Again for Comfortable, the A5 S Comfort seat, A5 Sport seat and A4 Sport seat displayed more segments on the back rest and also had pronounced shoulder support areas in comparison to the Q5 Comfort seat and Q5 Normal seat (see appendix). This feature discrimination in conjunction with the graph plots mapping seats for comfort perception depicts that the increase in prominence of the side bolsters linearly increases with increasing Sporty and Comfortable perception. The third separate group is formed of integrated head restraint/rest element and reported triangular features.
For Luxurious, A8 Sport seat was significantly rated higher than Q5 Normal and A6 Normal seat designs. The quilt pattern and pronounced shoulder areas proved to be perceived as more luxurious. For Comfortable versus Luxurious the plot graph shows that certain seat features incrementally increased the perception of both comfort and luxury, where a continuous linear nature for Luxurious as a variable is achievable. Focusing on the HCA Comfortable dendogram, the first group seat designs display single piece backrest cushion whereas the second group displays increased segmentation on the backrest cushions which increases both comfort and luxury expectancy. Furthermore, the amount of “padded” or “cushioned” areas on the seats were commented as references (design cues) leading to an increased understanding of a more comfortable seat. From the qualitative analysis, it was deduced that the Luxurious content encompassed the quilt patterns and craftsmanship details which implies a degree of complexity of the design.
A key insight of the study was that monochrome pictures were harder for the participants judge the seat designs on the variable of Luxurious; a number of participants reported that the inability to know the tactility, color and the material of the upholstery was particularly hindering the impressions and “tricky” to evaluate. In this regard the participants relied on the particular details of stitching (trenches) and the quilt patterns that were suggestive of craftsmanship, therefore, luxury content. Also the subjective “width” and the “larger” dimensions of a seat forming a “spacious” look were referred to as luxury traits, where in fact all images were presented in consistent dimensions on the iPad. This can be attributed to the visual effect of tapering single piece seat back cushion designs (e.g. A4 Normal seat etc.) and how narrow it was visually perceived. These results were also consistent with the previous study of Kamp [14] and Coelho and Dahlman [27]; where participants associated width and softer materials with luxurious car seats. Specifically the effects reported for the three variables in this study should be utilized to build on the theorized comfort models for automobile seats, where the Sporty variable was not listed in the indicators of Da Silva et al. comfort model for automobile seat [10]. Furthermore it can be proposed that for future studies, the indicators listed in the object facet which were identified from literature can be assessed if they are truly determinants of the expected comfort based on visual appearance.
The results of the linear regression showed a pos-itive linear relationship between Luxurious and Comfortable corroborating the plot graphs. Strikingly, the Sporty had a negative significant relationship with Comfortable indicative of an inflection point for Sporty design attributes. In scope of these findings, it can be proposed that holistic evaluation processes lead to categorization, based on design attributes that change the overall impression of a seat back shape such as the headrest. In contrast the “piecewise” evaluation processes that rely on the partial visual attributes e.g. the prominence of bolsters and various patterns dominated evaluations of comfort and luxury [9, 16].
In support of the arguments put forward by Zenk et al. [1] the effects of gender in response to automotive seat designs might be observed. In this study significant differences were indeed found for certain designs of seats between genders. Overall the male participants found more Sporty attributes or were rating the sport category seats higher in comparison to females. Specifically for the A8 Sport seat this was significant, suggestive of the quilt pattern utilized as a design cue. For the A1 Normal (Standard) seat, and A3 Normal (Standard) seat, the expected comfort perception was significantly higher for females. This may be attributed to the design characteristics of the seats possessing a more rounded shape on the seat back and seat pan design. In contrast, for the A4 S Sport type, A5 S Sport type seat and R8 Bucket seat, the expected comfort levels were significantly higher for the male participants which bear integrated headrest and prominent shoulder support designs. It can be hypothesized that the stature difference and possible attitude differences to the integrated headrest designs (hindered adjustability) and the preference of positions of the supporting surfaces such as the shoulder support impose different perception of comfort on genders. Creusen [16] argued that females were found to indicate that ease of use in terms of “product aspects” is more important to them than males. Moreover as Bhise [28] suggested, the anthropometric differences may lead to a postural difference when driving, where female drivers have different positioning needs compared to males. It can also be hypothesized that males might prefer sportier seats therefore expect higher comfort, where a certain degree of valence affects the perception based on angular shapes reflecting more masculine culture and self-expression (e.g. symbolic value) [16, 29].
Finally, this study focused on specifically the appearance of the seat designs and how the product form conjures expectations where the observer per-ceives-expects comfort based on their past experiences, attitudes and their concerns [17]. The sample of seat designs here utilized belongs to a certain manufacturer where certain elements were differentiated strategically and were relevant to the passenger car segments. It can be argued that the design variations in the 38 seat design images were adequate in revealing the underlying mechanisms for the purpose of the study whilst keeping the stimuli realistic and manageable for participants. However as a limitation of the study, it has to be underlined that the seats were not observed in real world scale and the experience does not constitute a physical experience of seated comfort. Future studies should investigate both time domains; first the visual time domain then followed by the physical evaluation of comfort experience in to the seated time domain to further investigate the findings in this study [8]. Moreover various different manufacturers strategically can emphasize various different aspects of the visual attributes of their seats e.g. heritage design cues, bolsters shapes with larger dimensions, thicker cushions etc. which may also increase the variation in the response. As a final remark, the current study was conducted in the U.K. with a sample of participants that have U.K. driving licenses, therefore it should be noted future studies should investigate the cross cultural differences in various other geographical regions outside the U.K. and E.U., which can also influence the findings in responses.
Conclusion
The findings presented in this paper have significant implications on how the visual appearance of automotive seats affect categorization of automotive seats, hence proposes a method to establish which descriptors are suitable for expected comfort evaluation. In this study the seats with integrated headrest and prominent side bolsters were perceived to belong to “sport” category and generated expectations of lesser comfort hence more function. Conversely, supportive yet visually more padded and pattern bearing designs were apprised as affording more comfort. Moreover, expected comfort had a negative linear relationship with increasing sportiness (utilitarian-functional) and a positive linear relationship with the perceived luxury. It has been demonstrated that categorization as a “product appearance role” as previously hypothesized [15] does indeed guide the end users to develop expectations regarding comfort. Hence it was concluded that the end users rely on specific design cues that elicit significantly different expectation towards the seat in terms of comfort. It can be further concluded that for automotive seat design Sporty, Comfortable and Luxurious variables can be utilized to assess car seat appearance, given that salient design differentiation cues are present in the sample of seat designs selected e.g. prominent shoulder support area versus tapered seat back design. Future research should be conducted to enhance the understanding of visual to physical transition of comfort experience with comfort descriptors of interest and provide insight on various visual seat design attributes and their relationship with overall comfort perception.
Conflict of interest
None to report.
Footnotes
Appendix –Seat design images utilized in the study
The 38 AUDI AG (model year 2016) seat designs for each passenger car segment adopted in this study. The designs vary from “Normal” (alternatively referred to as standard) to “Sport” and “Shell/Bucket seat” types offered on the AUDI AG website.
Acknowledgments
The study reported here was made possible by the utilization of the seat design images of AUDI AG. The usage of the images has been kindly approved by Audi Medienzentrale on behalf of AUDI AG.