
Abstract
BACKGROUND:
Change in current approach to develop methodologies for process risk assessment, where it is commenced from the process industry and exclusively hazardous materials are dealt with, into the approach where it will be commenced from pressure equipment within any context and both technical and organizational aspects are considered, can lead to the orientation of a more comprehensive approach to risk assessment, and thereby to better results in this area.
OBJECTIVE:
The goal of this study implies the creation of a universal measurement instrument that will measure and quantify organizational factors impact on the risk of pressure equipment exploitation.
METHODS:
The research instrument was drawn from previous research and tested by the multivariate statistical methods using the sample size of 253.
RESULTS:
The confirmatory factor analysis conducted shows that the most influencing organizational factor is ‘subcontractors for works from other enterprises’ with maximum value of 104, whereas the factors ‘maintenance/inspection’, ‘safety and health at work’ and ‘human error’ are by 10% to 20% less influencing. There then follow ‘training and competence of employees for crisis situations’, communication’, ‘potentially hazardous materials and equipment’ and ‘organizational change management’ and the factor ‘conducting investigation after accidents’ with the lowest value of 29. Pareto analysis indicates that the factors ‘communication’, ‘subcontractors for works from other enterprises’, ’organizational changes management’, ’potentially hazardous materials and equipment’, and ‘training and competence of employees for crisis situations’ participate with 80%, and they should be given special attention in practice.
CONCLUSION:
The instrument offered can ensure proactive information on the influence of organizational factors as risk predictors of pressure equipment operation, before given influences lead to accidents with severe consequences.
Introduction
The largest number of procedures developed for risk assessment refers exclusively to process industry and focuses on hazardous substances used in process industry. For example, SEVESO directives deal solely with prevention and control of major industrial accidents that involve what is predefined as a hazardous substance [1]. The reason is evident, given that the consequences of accidents involving hazardous substances take much larger proportions than in other cases. Also, some of the largest accidents in history have taken place in process factories that use flammable and hazardous materials [2], such as Flixborough in England in 1974, Seveso in 1976 and Bhopal in 1984, Piper Alpha in UK in 1988, Longford in Australia in 1998, Texas City Refinery in USA in2005, Montara in Australia in 2009, Pike River in New Zealand 2010 and many other, so that further development of risk-related procedures has continued in the process industry and remained focused on hazardous materials used in this industry [3–5]. However, such approach resulted in placing the focus too much on the substances and technical aspects of those systems [6], while in practice it has been shown that in the majority of severe accidents occur due to the failure and working with pressure equipment unrelated to the hazardous substances being handled [3]. Additionally, pressure equipment failure, which is an integral part of the process industry, occurs in other types of industry, where it leads to severe consequences, too, and therefore it is necessary, in terms of process safety and risk, to pay more attention to pressure equipment and types of industry where it is operated. Thus, the consequences of accidents in SMEs, from various branches of process industry, lead to fatalities, huge financial losses, and serious consequences for the local environment, which should be included as an indispensable part of research, when it comes to process safety [4, 7]. A great obstacle to this is the fact that accidents from small firms are rarely reported [8]. Such companies do not have the potential to incorporate risk assessment methods, such as API 581 and RIMAP, because they are complex and very comprehensive in terms of time and financing, so that they are a challenge even for large plants and systems. Ignorance of human and organizational factors, on other side, favors the occurrence of new accidents [8]. This applies to both developed countries and developing countries [9, 10] such as Serbia, where there are numerous small and medium businesses which are using pressure equipment.
For instance, only in Serbia, in the Central Register of Pressure Equipment within the Ministry of Mining and Energy 22 000 pieces of pressure equipment were recently registered. But it is also evident, that while in the oil idustry of Serbia, a risk assessment was performed according to API 581 standard [11], in other companies this is not the case. Similar situation is evidenced in developed countries [9, 12–15]. However, even API procedure does not involve adequately the impact of human, or organizational factors although it is extremely time and financially demanding for the company. Change in current approach to develop methodologies for process risk assessment, to the approach where it will be commenced from pressure equipment within any context and both technical and organizational aspects are considered, can lead to the orientation of a more comprehensive approach to risk assessment, and thereby to better results in this area.
Accordingly, it is necessary for both large and all smaller systems where pressure equipment operates to create a systematic approach to risk assessment that will involve the impact of organizational factors and will be easyly understood and useful for all stakeholders, because organizational factors as a risk predictor of pressure equipment operation need special attention to be paid.
The aim of this study is to determine and statistically prove organizational factors and their descriptors which have an impact on risk in pressure equipment exploitation. Namely, it is intended to offer novel measurement instrument, based on data collected in Serbia and modeled by structural equations, and basic hypothesis is that organizational factors could be described by observed variables and their underlying latent constructs. In general, there is the high importance to perform such a type of study, since it offers approach which can ensure proactive information on the influence of organizational factors as risk predictors of pressure equipment operation, before given influences lead to novel accidents with severe consequences in both Serbian and general context.
Literature review
Organizational factors appear to be more frequently addressed in worldwide literature sources in recent years, but still are more frequently based on common sense rather than the use of systematic methods [6, 9]. Thus, the need to define them clearly is emphasized and to apply a systematic approach to given problem.
Organizational factors as safety culture and process safety descriptor
Organizational factors are often used as safety culture descriptor, so, it is necessary to analyse the concept of safety culture [16–19], which came up all of a sudden, as a universal remedy. Other concepts stem from this one like safety climate and safety attitude [19, 20]. This concept is still difficult to define, despite being dealt with by many researchers. Safety culture is not an isolated structure, but derives from and is embraced by organizational culture. Safety climate is considered visible and measureable while culture is the essential content of human thought and action [21–23]. Just as better design and better material quality contributed to better process safety a decade ago, the focus today has shifted to human behavior and the impact of management. The critical role of wise leadership and good management nowadays has become very clear, because it is evident that if the top of the company does not take safety seriously and encourages employees to take care of safety, all workplace safety measures will not be effective [3]. Therefore, effective leadership is required at all organizational levels so that the climate of appropriate safety culture is created. Safety is something that must be managed, and represents the responsibility of line management. Namely, management is only a means by which joint human efforts ensure the achievement of desired goal. There is an extensive literature [24–28] regarding this topic, where survey methods are developed (questionnaires for safety climate assessment) with objective interpretation of their results, and they proved to be very useful, partly due to their verification by statistical methods. On the other hand, safety culture questionnaires describe employees’ attitudes, beliefs and attitudes about risk and safety and are closely related to personal safety, which is a significantly different concept from process safety, but can be considered one of many areas in the process safety.. For example, HSE tool [29] includes safety climate as one of 10 themes, however not among the areas marked as basic areas (defined as areas of crucial importance in all factories and at all places), but among the areas which are second in importance. Also, there is a general lack of connection of safety climate and safety culture either with the safety concept and risk management or with safety performances [25]. Accordingly, the questionnaires for safety climate assessment, despite being adeqately analyzed throughout the literature, validated statistically and checked, embrace only a small portion of a broader picture about organizational factors. Anyhow, studying these questionnaires may be useful in terms of defining part of questions to describe impact factor related to personal safety, however the coverage of organizational factors is not enviable.
Organizational factors as risk based inspection descriptor
Risk-based API inspection methodology contains organizational/managerial factors. It is presented in three parts [30]: a) Inspection Planning by implementing API RBI Technology, b) Defining the probability of failure by implementing API RBI Assessment, and c) Modelling consequences in API RBI. Probability of failure P f (t) is defined as a product of generic failure frequency, gff, a damage factor, D f (t) and a management system factor, F MS [30]. Generic failure frequency is specified based on known data of the failure history. A damage factor is defined based on appropriate damage mechanisms (local and general corrosion, cracks, creep, etc.), which are associated with the materials that components are manufactured from, as well as with the nature of the process, physical condition of the components and testing techniques before which damages are quantified. A damage factor modifies generic failure frequency in industry and makes it closely related to a concrete component analyzed. A management system factor considers the impact of the management system on the equipment mechanical integrity, which means that certain, higher level organizational factors are well recognized. This factor also considers the probability of timely detection of carrying capacity loss due to damage accumulation and is directly proportional to the quality of the mechanical integrity program within the plant. As emphasized in API standard [30], the effectiveness of management system by process safety within a company may have a major impact on the mechanical integrity. The API RBI procedure includes management system assessment that most directly influence the probability of the component failure, whichconsists of a series of questions about the plant management, operations, inspections, trainings, etc. Each possible answer to each question has specific weight, depending on the adequacy of the answer and the significance of the question itself. Such system produces a quantitative result of management system assessment, which is easy to reproduce. Further, it is explained that the number of questions and the scope of the area they cover allow management system assessment to make the difference between PSM systems of various effectiveness level but without any generalized result that can be used as a basis to define agreement vs disagreement. A 1000-value is equivalent to the achievement of excellent results regarding the problems related to PSM that affect mechanical integrity. However, questions for Management System assessment within API procedure are not statistically processed. Also, there is no explanation for the manner of defining the questions. Quantification of the questions themselves and obtaining the overall factors in the end is not explained either. Further, as pointed out in the API document [30], in RBI the purpose of management system assessment is not to measure the overall agreement with API standard recommendations or with OHSA recommendations, but to stress the problems that are present in the mechanical integrity, the largest risk prone area, and those questions are related to areas closely connected to mechanical integrity. This leads to a slight negligence of very important areas that are affected by management system.
On the basis of American standard API 581, RIMAP project was initiated in Europe in 2001 [31–33]. The project resulted in 4 workbooks which were produced for specific industries: petrochemical industry, chemical industry, steel industry and power plants. The major RIMAP result was to make increased awareness of risk-based inspection, whose main role is to present the framework as the basis for assessment of more detailed risk approaches, i.e. as a general ‘good European practice’ [31, 35]. Risk-based inspection that RIMAP project is grounded on and defined as a method that uses risk for a basis to determine inspection priorities in the process plants components - tanks, pressure vessels, reactors, exchangers, pipelines... [31].
Seveso-Directive is a directive that deals exclusively with prevention and control of major industrial risks involving hazardous substances [36, 37]. The first Directive was enacted in 1982 (82/501/EC), followed by significant enhancements in 1996 (96/82/EC) and 2012 (2012/18/EU) [38]. These Directives require submission of a satisfactory report on safety prior to issuing a license, where operators show that ‘everything that is needed has been done to prevent severe accidents’.
However, both RIMAP project and Seveso directives are very similar to API 581 standard –focusing mainly on technical causes of accidents, costly and complex, and do not have developed any statistically valid tools for assessing the impact of human and organizational factors.
The OECD has issued guidelines through a senior management guide in the high-risk industry [39], whose goal is to establish a balance between risk and profit by drawing attention to the most responsible persons in high-risk industry [40]. In a booklet, recommendations are given for simple measures that should be reviewed by each director or president of the company, whose work involves severe risks, so they can check themselves in the safety field. The adoption of these guidelines, according to the guide authors, and their implementation in industry could demonstrate great devotion to the highest standards of process safety, which could result in a long-term sustainable development. As for the area of application, it is emphasized that despite the guidelines are intended for chemical and petrochemical industry, they will be useful for any industry or organization that is in touch with hazardous processes and substances due to the nature of its activity, which leads to the risk for a large number of humans or the environment. As regards the purpose of the guide, it clearly defines that it is intended for senior managers such as directors, presidents, members of boards (executive and non-executive) and other senior staff within the organization, that is, who have the opportunity to influence the direction in which the company safety culture will develop. It is considered that the guidelines are also useful for shareholders entering high-risk industries, as well as for regulators and stakeholders [14]. The guide consists of 5 areas, i.e. themes [39]: actions, risk awareness, information, competences, leadership and culture, the number of questions ranging from minimum 5 to maximum 8. For possible answers to each question, 3 options are offered: 1 = Yes, I can easily demonstrate this, 2 = I am not sure, I would have to find out, 3 = No, I do not think there is an omission here. Like in the case of the questionnaire from API standard these questions are not statistically processed.
Organizational factors as risk predictors of pressure equipment operation
Integration of risk assessment and organizational factors impact is scarcely present in the available literature, in general, although above mentioned references emphasize its high importance in accidents prevention. To this day, there is no universally accepted methodology for the assessment of organizational factors impact on risk in pressure equipment exploitation. All available techniques and methods, either complex or simple, more or less effective, have not been incorporated in the procedures for risk analysis, or associated with industrial accidents of pressure equipment with severe consequences. Considering all mentioned, there is an evident need to develop statistically valid tool for organizational factors assessment as a risk predictor of pressure equipment operation. So, further efforts aimed to prove hypothesis that it is possible to establish organizational factors by using statistical multivariate methods, as well as links between their dimensions, are necessary. This research aims at providing a valid and reliable measurement instrument to study the impact of these factors, which could be of great benefit for industries where pressure equipment operates.
Research methodology
Research operationalization and framework
So, in this paper, the research methodology comprises: Creating a preliminary list outline of organizational factors’ constructs and their observed variables that are pressure equipment risk predictors, using current standards, available literature research, history of major accidents involving pressure equipment, conversations and consultations with experts in the related area. Creating a data collection plan. Conducting research –collecting necessary data on a representative sample. Analysis and statistical processing of obtained results in order to define a final measurement instrument for studying organizational factors impact.
All survey questions used were drawn from existing surveys [3, 41–44]. After the preliminary questionnaire was created, 30 experts in the area were interviewed in aim to prove its’ content validity, and thereafter the final questionnaire was formed to be distributed later on.
Survey construction
The first part of the questionnaire involves general (demographic) data such as industry type and company size and age and experience of the person which participates in survey, while the questions in the second part describe the following organizational factors as constructs - communication, potentially hazardous materials and equipment, safety and health at work, organizational changes, subcontractors from other companies, maintenance/inspection, human error, trainings and competences of employees for crisis situations and conducting research after accidents and their descriptors/observational variables which lean on a 5-level Likert scale (see Appendix). In the second part, in order that each question/observational variable describes given phenomenon viewed from all aspects and involves in the best possible way managers’ attitudes to a given topic, i.e. theme, two columns are defined, the first related to the current condition in the company and the second related to the significance of the item studied for potential pressure equipment failure. Responses from both columns were afterwards multiplied, because they can be perceived as the probability and consequence predictor, yielding a cumulative response from minimum value 1 to maximum value 25.
Sample and data collection
Questionnaires were distributed to the companies on the entire territory of Serbia, which cover electric power sector (thermal power plants, thermal plants –heating, and hydro power plants); oil, coal and natural gas sector; pharmaceutical industry, food industry and others, i.e. sectors where pressure equipment is in exploitattion. In total 321 questionnaire was distributed and they were provided with electronic surveys, by e-mail, printed surveys by mail, or taken in person, according to contacted persons’ choice. Participation was voluntary and anonymous. Lastly, 287 questionnaires were collected, of which 253 were valid (correctly filled in – exclusion criteria was an error in a control question). High response rate (79%) could be explained by five reminders during 3 months and different options of survey distribution to contacted persons which included even personal distribution on site. Two waves of responses have arrived during data collection period, according to inferential statistics results, with higher values of variables in the first wave.
Data on demographic facts on the sample surveyed are given as in Table 1:
Sample demographic data
Sample demographic data
After the described procedure of data collecting, it was necessary to check the sampling adequacy and the questionnaire reliability and validity [45]. Statistical Package SPSS (IBM Corp., SPSS Statistics Version 20, Armonk, NY, USA) was used for the needs of all analyses, together with additional module AMOS (AMOS 21). The questionnaire structure established by EFA analysis, after the reliability analysis, was further tested by confirmatory factor analysis, CFA, as one of the tools employed for structural equation modeling (SEM) [46]. The measurement model is given in a CFA diagram, represented by the links between certain measured values (items) and their related factors, including links between those factors. The ‘paths’ from latent factors to measured loadings are based on measurement theory. The only loadings that theoretically link measured items to their latent factors are calculated, whereas it is assumed for others that their value is zero [47]. The proposed model adequacy was defined by calculating the fit index, which is used to test the acceptance or rejection of the proposed model. There are a large number of such indices but none of them alone is sufficient to accurately assess fit into the CFA or SEM model. Recommendations for researchers are to apply multiple indices from different categories (cross validation) [48]. These indices give an idea on the measure of mutual correlation of the variables relative to the measure predicted by the model [49]. There are over 25 different model adequacy measures, i.e. fit indices, in the literature available, of which only a portion are commonly considered [50]. There are disagreements even on boundary values of these indices [49]. Therefore, all measured values should be interpreted within the context of a concrete sample size, assessment procedure, model complexity, essential assumptions on multivariate normality, etc. [42].
One of the most commonly applied fit indices is chi square χ2, which is used to examine the approximation of the sample covariant matrix fit to the fitted covariant matrix [49]. A negligibly small value of χ2 indicates that observed data does not differ significantly from assumed model. Since the formula for calculating the value of χ2 is directly linked to the sample size, nearly all models are rated as wrong, with increasing sample size. For that reason, the ratio of χ2 to the degrees of freedom (df) is often applied as an alternative fit index. If this value is about 2, the model is considered to have optimum fit [49]. Another commonly employed fit index is Root Mean Square Error of Approximation (RMSEA). The RMSEA is better than other fit indices, since RMSEA measures the lack of fit by the degree of freedom. The RMSEA values of 0.05 indicate good fit of the model, the values below 0.08 indicate the acceptable approximation error, while the values above 0.10 point to the model that does not fit well [42]. NFI index compares fit of two different models (assumed and zero model) with the same data set. Some authors [49, 50] recommend the adoption of NFI values of 0.90 and larger, as indicators of good fit. NNFI represents another fit index that considers model complexity as well, comparing the assumed model with the zero model. Although the interpretation of NNFI index is somewhat more complex, due to its range going beyond the 0 –1.00 limits, it is recommended to apply this index combined with at least three other types of indices [49].
The model adequacy measurement within this research was performed by applying the following fit indices: Model (χ2), χ2 divided by value df (χ2/df), Comparative Fit Index (CFI), Root Mean Square Error of Approximation (RMSEA), Normed Fit Index (NFI), as well as Non-Normed Fit Index (NNFI), also referred to as Tucker-Lewis index (TLI).
To test the sampling adequacy, each organizational factor was estimated using the Kaiser-Meyerto-Olkin (KMO) parameter, and results showed a good degree of data covariance in the range of 0.72 to 0.91. Also, Bartlett’s test of sphericity obtained that the matrices of all examined organizational factors were statistically significantly different from the identity matrix, as for each factor the significance was < 0.001, which confirms that the data are suitable for the application of factor analysis.
Exploratory factor analysis (EFA), in combination with varimax rotation and Kaiser normalization was applied to analyze the dimensional structure of the questionnaire. The percentage of explained variance was above 60% for each variable, while the eigenvalues were above 2 for the first extracted factor and below 1 for the second one. The “Scree” diagram showed an obvious cut-off from the first factor, for all factors. All factor loadings were above value of 0,4, which is cut-off value for the sample size in this study.
After initial EFA analysis, each factor’s reliability was assessed using Cronbach’s α and satisfactory values between 0,74 and 0,94 have been obtained. Kendall’s W test (Kendall’s coefficient of agreement) was also applied to estimate agreement among respondents and value 0,15 has been obtained, which is quite a satisfactory value. Finally, Spearman–Brown coefficient has been calculated and value 0,848 is obtained, which also proves this survey as reliable.
In the next step CFA is used to advance the connections between the observed measured values and the essential factors, based on previous theoretical knowledge and empirical research, and then statistically examines the assumed structure. Due to the fact that the CFA model focuses exclusively on the relationship between factors and measured values of variables, within the SEM framework, it represents the measurement model. The adequacy of the proposed measurement model is determined by the calculation of the fit indices, by which we test the acceptance of the proposed model. The obtained structural model presented in CFA diagram (Fig. 1) provide an insight into the formulated hypothesis that it is possible to describe organizational latent constructs using the observational variables/dimensions based on previous research and its parameter estimates. Larger ovals in the diagram represent unobserved latent factors, smaller ovals represent errors, while rectangles represent the observed variables.Majority of observed variables loads to only one latent factor, except few variables which describe organizational change management, subcontractors for works from other enterprises and conducting investigation after accidents. Structural equations look like this:

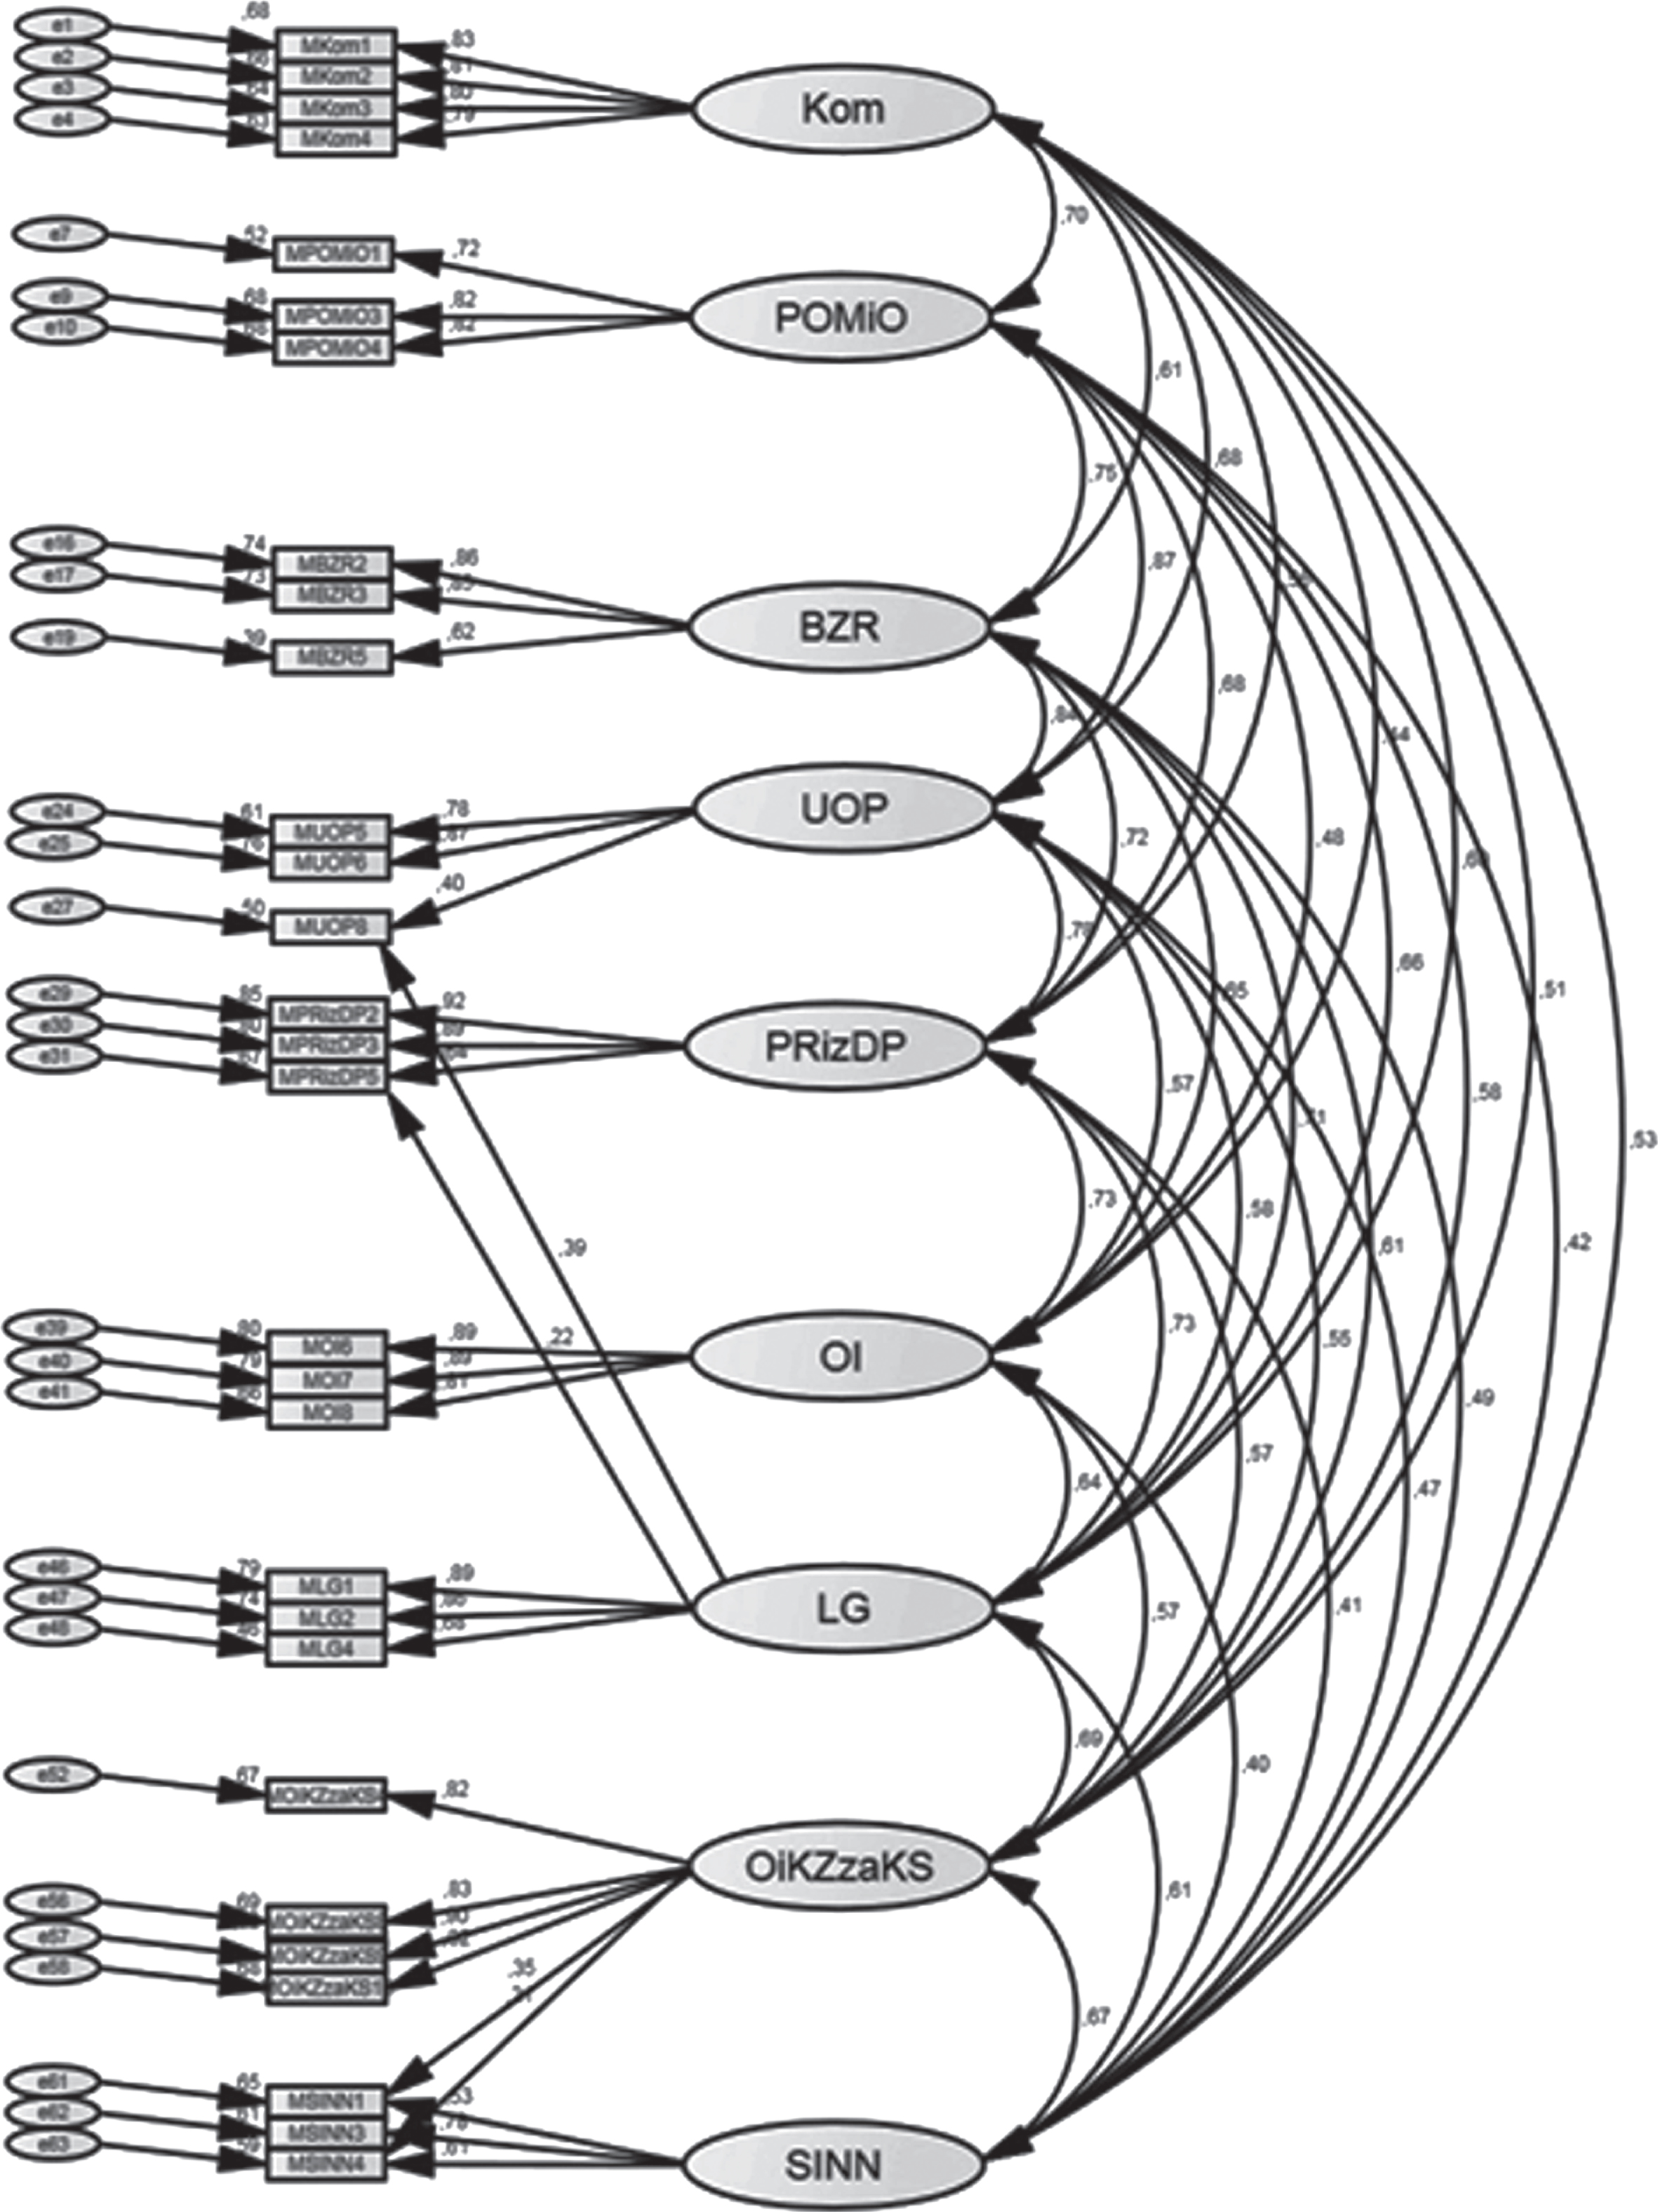
CFA model for organizational factors.
Finally, the confirmatory analysis has shown that the model overall fit is acceptable, with the remark that NFI, NNFI and TLI values are close to the recommended and a consequence of model complexity, as presented in Table 2.
Fit index values for obtained model of organizational factors
Discussion
The results show that it is possible to quantify the impact of organizational factors on the risk when working with pressure equipment in reliable and valid manner, using the questionnaire that consists of 29 valid and reliable questions describing 9 different factors –constructs (final format of the questionnaire is given in the Appendix). Also, this paper differs from previous by the fact that beside determining observational variables and constructs which describe organizational factors it has offered structural model which quantifies its influences and measures its significance. Based on this fact, the impacts of organizational factors were measured, i.e. quantified, so that their maximum values, viewed individually, can be represented as in Table 3.
Maximum values of organizational factors
The most influencing organizational factor, with the highest possible value, is ‘subcontractors for works from other enterprises’ with the value of 104, whereas the factors ‘maintenance/inspection’, ‘safety and health at work’ and ‘human error’ are by 10% to 20% less influencing. Factor ‘subcontractors for works from other enterprises’ is also seen as important descriptor of organizational factors in previous research [29–34], but its influence has not been measured there by equations. Other three following factors are also recognized in previous research such as [24, 39], again without precise quantification. There then follow ‘training and competence of employees for crisis situations’, ‘communication’, ‘potentially hazardous materials and equipment’ and ‘organizational change management’ with the values ranging from 67 to 49, and the factor ‘conducting investigation after accidents’ with the lowest value of 29. It is well known that training courses can strongly mitigate occupational risk factors in various working sectors and training has been recognized in numerous research such as [12, 44] as extremely important risk predictor, while in this survey has been confirmed that it important, but also shown that it is not the most important one. Additionally, it is also useful to implement Pareto analysis [51], so as to see which are ”a vital few“ factors in overall impact.
Pareto analysis indicates that (Fig. 2) the share of factors communication, subcontractors for works from other enterprises, organizational change management, potentially hazardous materials and equipment and trainings and competences of employees for crisis situations is 80%, and therefore they should be given special attention. Communication, although as the second factor in line according to maximum possible value, shows the highest influence according to Pareto principle, which is in accordance to previous research results [20–27, 29]. It is followed by subcontractors for works from other enterprises, organizational change management, potentially hazardous materials and equipment and trainings and competences of employees for crisis situations, as expected to represent the “vital few” factors and in line with other works which have recognized, but have not quantified their influence.
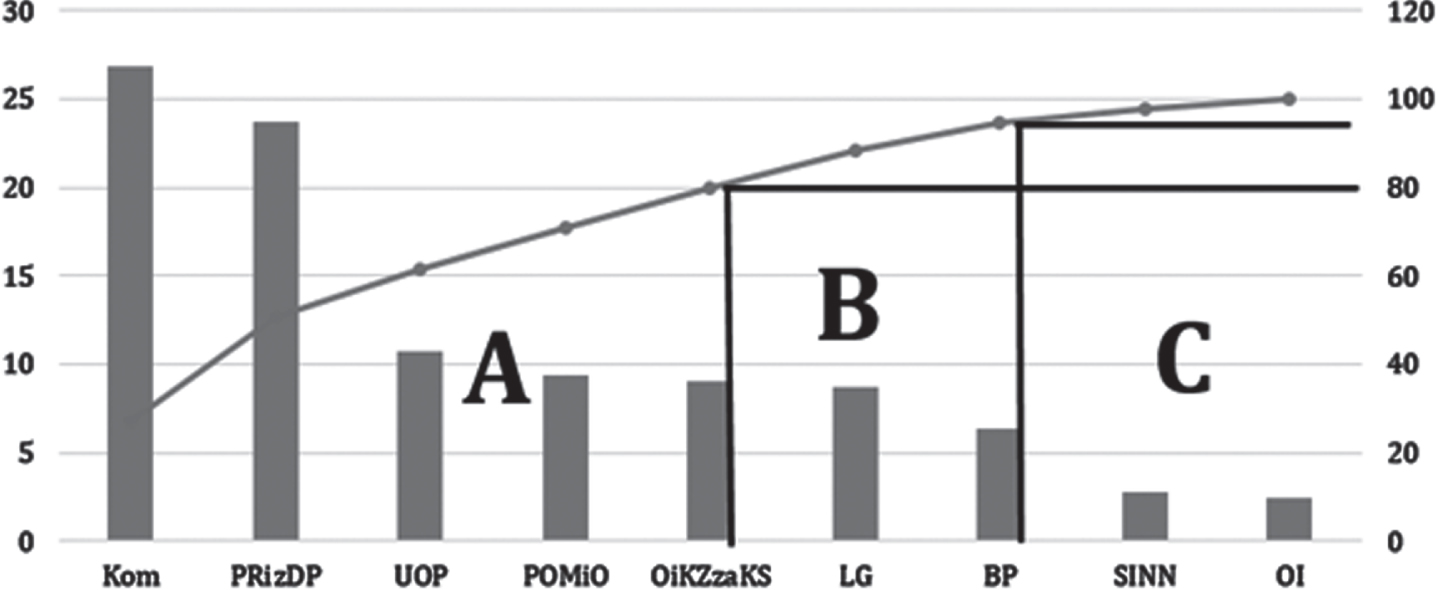
Pareto analysis of organizational factors.
This study is not without limitations. It is based on Serbian sample, which has shown adequate sampling adequacy and passed all reliability and validity test, anyhow recommendation for further studies is to enlarge sample size and repeat survey in aim to move from cross-sectional to longitudinal study. Also, it is recommended to test questionnaire proposed herein, using the same methodology, in other, both developed and developing countries. Those limitations do not diminish this survey significance neither its generalization, since contextual approach is promoted in novel versions of ISO mamangement standards, such as ISO 45001, ISO9001 and similar.
This research proved its basic hypothesis that it is possible, by using statistical multivariate methods, to establish organizational factors, as well as links between their dimensions, which are common for risk impact on pressure equipment exploitation. It differs from previous research by the fact that beside determining observational variables and constructs which describe organizational factors it has offered structural model which quantifies its influences and measures its significance, namely, the influencing organizational factors have been scarcely recognized in previous research, but its influence has not been quantified neither described by equations till now. Accordingly, this paper adds to knowledge about the theme, with respect to previous published articles, which have not till now pointed out to quantification of organizational factors and its observational variables neither used multivariate statistics. It can be concluded that providing a valid and reliable measurement instrument to study the impact of these factors, which emerged as a separate whole within the framework of developing the methodology, can be of great benefit for industry. The novel instrument offered to measure managers safety attitudes as organizational factors and pressure equipment risk predictor can ensure proactive, in contrast to reactive, information about the impact of employees in the organization on risks when working with pressure equipment, before given impacts lead to accidents with severe consequences. Practical contribution of this work, as expected, mirrors in its benefit for researchers in the scientific area (check and further development of the proposed methodology are expected), industrial experts involved by the research (by applying the methodology they will check it and enhance process safety wherever pressure equipment is in exploitation), and, certainly, consultants who are working on management system implementation oriented to risk assessment (the methodology should make their work easier and provide the guidelines for risk assessment).
However, the research results should be interpreted in accordance with a number of its constraints. First, some subjectivity is present, as is always the case in collecting data for survey, which is significantly reduced by the control question. Findings of this survey for sure are relevant out of local context, especially in methodological sense, and it is recommended to test this model both in other contexts and longitudinally. Also, the proposal for further research is to integrate the proved measurement instrument into the current risk assessment models, e.g. integration with the structural integrity principle and fracture mechanics principles, whereby they can be quantified in a simple way and provided as data necessary for decision makers on further exploitation of pressure equipment.
Footnotes
Acknowledgments
The paper is supported by grants from the Ministry of Education, Science and Technological Development, grants from project E!13300 and contract 451-03-9/2021-14/200105 (subproject TR 35017). The authors thank the respondents who filled out the questionnaires for their kind cooperation.
Conflict of interest
None to report.