
Abstract
BACKGROUND:
Return to work (RTW) after injury or illness is a behavior influenced by physical, psychological and social factors. This study aims to determine the structural validity and reliability of a return to work assessment scale using internal consistency and factor analysis.
METHOD:
A cross sectional survey research design was adopted for this study involving 101 Post stroke survivors. The return to work assessment scale, which was developed by Ibikunle et al. in 2019, was subjected to structural validity and reliability.
RESULT:
The results reveal that 58 (57.4%) were males and 43 (42.2%) females with mean ages of 53.88±10.68 years. Internal consistency was high with a Cronbach’s alpha coefficient of 0.81 for Domain 1, 0.93 for Domain 2 and 0.76 for Domain 3.Test-retest reliability analysis gave an ICC of 0.85(p = 0.001) for Domain 1, Domain 2 an ICC of 0.91 (p = 0.001) and Domain 3 an ICC of 0.99 (p = 0.001). The Kaiser-Meyer-Olkin measure of sampling adequacy (KMO) value for Domain 1 was X2 = 0.63 and that of Bartlett’s test of sphericity value was significant (P = 0.000), Kaiser-Meyer-Olkin measure of sampling adequacy for Domain 2 was 0.84 and the Bartlett’s test of sphericity value was significant (P = 0.000), the Kaiser-Meyer-Olkin measure of sampling adequacy for Domain 3 was 0.66 while the Barlett’s test of sphericity was significant (p = 0.001). Therefore the factor analysis was appropriate.
CONCLUSION:
The return to work assessment scale is a good, internally consistent and reliable tool that has demonstrated good group and structural validity.
Background
Stroke is defined as “a neurological deficit attributed to an acute focal injury of the central nervous system (CNS) by a vascular cause” [1, 2]. Depression and dementia are also found to be associated with stroke [3, 4].
In 1599, the term “stroke” was used to explain apoplectic seizures [5]. In 1658, Johann Jacob Wepfer in his book entitled “Apoplexia,” explained the causes of apoplexy as bleeding in the brain.5 It is a medical emergency that frequently causes death and disability universally [5]. It is the second widespread reason for death subsequent to heart disease and is a superior cause of death than cancer globally [5]. It is one of the primary causes of disability and illness universally [2]. Regardless of the large-scale severity of stroke, stroke occurrence estimates excluding Western countries, particularly those from South Asian or East Asian regions are not as readily available [6, 7]. In 2007, the death rate for stroke in the USA was 40.2 per 100,000 for white males and 67.1 per 100,000 for black males, and 39.3 for white females and 55.0 for black females [8].
Universally, stroke is the second primary reason for death and the third important reason of disability [9, 10]. It is the second most important reason why patients die universally and a primary source of disability in adults [9, 10]. It is a major cause of long term disability and has enormous emotional and socio-economic burden for patients, their families and health services.
Its mortality in Nigeria is high with stroke reviews reporting a prevalence of 1.14 per 1000 with a 30-day case fatality rate that ranges from 28 to 40%[11]. Stroke is the leading cause of neurological admissions into tertiary health care institutions in Nigeria also accounting for a fatality rate between 1.8%and 15.6%of all deaths in these institutions and as such is an important health concern for individuals and society and a public health burden in Nigeria [12].
There is a differential pattern for the incidence of stroke in developed and developing countries [13]. According to Danesi et al., in a study conducted in Lagos, Southwest Nigeria, the gender specific rate was 28.3/100,000 for males and 21.3/100,000 for females [14]. The age adjusted rate was 54.08%per 100,000 year; hospitalization rate was 84.6%, while the case-fatality-rate (CFR -hospitalized) was 16.2%in Surulere Sub-urban of Lagos [14]. In a study conducted in Ondo, Southwest Nigeria, Okon et al. [15] placed pathologic diagnosis as confined in 75%of the cases. Stroke impacts on a survivor’s ability to return to work, thereby affecting participation in community activities, especially people who are still within working age [18]. Return to work (RTW) contributes to life satisfaction and social identity through independence gained from income generation. Recovery and life satisfaction are also enhanced from a psychosocial point of view. Return to work (RTW) after sickness is an action controlled by physical, emotional and societal factors. To improve employment outcomes of post stroke survivors, it is important to know the factors determining job retention, significant factors correlated to return to work, and current society’s opinion of disability. Unlike developed countries, there are no reliable figures for the developing world because of the poor registry system and rapid urbanization which is not commensurate to information system records. This results in inaccurate statistics that in turn negatively impact the allocation of resources and the planning or prioritizing of services [16, 17].
Stroke impacts on a survivor’s ability to return to work, thereby affecting participation in community activities, especially people who are still within working age [18]. Return to work (RTW) contributes to life satisfaction and social identity through independence gained from income generation. Unless work absence is medically necessary, remaining away from work is likely to hamper rather than promote recovery from injury and illness [19]. It is possible to transform work disability into work ability. The independence of stroke survivors, socio economic contribution to the family and community at large bring great relief. Returning to work and sustaining employment are considered key aspects of rehabilitation and recovery by younger stroke survivors [19]. From a psychosocial perspective, successful return to work can enhance recovery and life satisfaction by consolidating self-esteem, confidence and social identity [19]. However, even higher functioning stroke survivors with minimal or no obvious physical disability may experience workplace challenges relating to their neurological condition. Presently there is no instrument that can be used to assess return to work from different views; that is from the employee, employer and from contextual viewpoints.
An outcome measure was developed by Ibikunle et al., which was designed to assess return to work among post stroke survivors [20]. The validity and reliability of the outcome measure was determined in this study. There is a need to determine the structural validity and reliability of the developed instrument in order to present it as an instrument which is valid and reliable for determining return to work among post stroke survivors.
Methods
The research design was cross sectional survey research design. Data were collected from a population (a representative subset) at one time point over a short period.
The populations of this study were adult patients aged 40 years and above who were post stroke survivors from the Physiotherapy department, who met the inclusion criteria. They were recruited from the following health institutions in the five states of South-Eastern Part of Nigeria: Nnamdi Azikiwe University Teaching Hospital, Nnewi, Anambra state. Anambra State University Teaching Hospital, Amaku, Awka, Anambra state. Enugu State University Teaching Hospital, Park lane, Enugu state. Federal Teaching Hospital, Abakaliki, Ebonyi state. Federal Medical Centre Owerri, Imo state. Federal Medical Centre, Umuahia, Abia state.
The participants in this study included: Patients who were post stroke survivors in the physiotherapy department of the South-Eastern hospitals. Patients that were 40 years and above. Patients who were literate in English.
The following were excluded from the study: Patients whose symptom duration was less than 2 months. Patient’s inability to complete questionnaires because of cognitive impairment or language barriers.
Sample size and sampling technique
The sample size was determined using this formula: n = (z/e)2 .
Where, n = sample size, z = degree of freedom (1.96), e = acceptable margin of error (0.20), n = (1.96/0.2)2 = 96.04.
One hundred participants were recruited from the selected hospitals in the South-Eastern part of Nigeria. A consecutively recruited sample of 101 post stroke survivors admitted to or receiving rehabilitation at the rehabilitation settings which were part of the research setting were recruited to participate in this part of the study.
Instrument for data collection
Return to work assessment scale
This instrument was designed to assist stroke survivors with assessing their readiness to return to work. The scale is made up of two sections, A and B. Section A is made up of general questions about the individual completing the scale, while section B includes three parts that are important to consider in deciding to return to work. The three domains of return to work in section B are scored separately; each domain assesses a different concept in return to work. Domain 1 (personal), Domain 2 (work) and Domain 3 (contextual factors). The three Domains are assessed independently of the other, so their scores do not provide an overall sum.
Procedure for data collection
Ethics approval and project registration was sought and obtained from the Senate Research Committee of the University of the Western Cape, Republic of South Africa (Registration number 15/2/20). In Nigeria ethics approval was also sought from the Faculty of Health sciences and Technology ethics committee of, Nnamdi Azikiwe University (ERC/FHST/NAU/2018/028). Access to the clinical sites was requested from the relevant persons (i.e. the Heads of Physiotherapy departments) at the clinical sites. The names of potential participants were obtained from the rehabilitation professionals. Potential participants were approached either in the wards or at the therapy departments and invited to participate. The return to work assessment scale was distributed to the post stroke survivors through the physiotherapist in charge of the neurorehabilitation clinic in each of the selected teaching hospitals. Their informed consent was sought and obtained before distributing the questionnaires to them. The researcher visited the physiotherapist in charge of the neurorehabilitation clinics and trained them how to use the return to work assessment scale. They were given copies of the questionnaire and told to administer it to their patients. It took about 30 mins to complete a questionnaire. The filled questionnaires were later returned by post to the researcher after completion.
Procedure of data analysis
Data collected were captured in SPSS version 23 and analyzed to assess the psychometric properties of the instrument. The estimate of internal consistency was specifically obtained by using the Cronbach’s alpha method. The procedure applies to instruments that are polytomously scored and provides an index of reliability [21, 22].
The validity of the instrument was computed through construct validity using factor analysis. Exploratory factor analysis was used to determine the factor structure of the instrument as an estimate of construct validity. From factor analysis, the minimum numbers of factors that best explained the data set or structure of the instrument the factor loadings of each item on each of the factors emerged. Factor loadings are correlation coefficients. An item that is highly loaded on only one factor is said to be factorially pure or factorially simple [21–24]. On the other hand, if an item loads highly on two or more factors, it is said to be factorially complex. The selected items are arranged under those factors that they are highly loaded on. Depending on the results of the analyses, final revisions were made to the instrument [21–24]. The Intraclass Correlation Coefficient (ICC) and Bland and Altman plotting method were used to compare the scores on the return to work assessment scale at the two different occasions in order to determine the test-retest reliability of the return to work scale. The Cronbach’s alpha was used to determine the internal consistency of the return to work assessment scale. Factor analysis was used to determine the structural validity of the return to work assessment scale.
The level of significance was set at 0.05.
Results
Sociodemographic distributions of phase three participants
One hundred and one patients who were stroke survivors participated in the psychometric testing of the return to work assessment scale 58 (57.4%) males and 43 (42.2%) females with mean ages of 53.88±10.68 years. They were all Africans (100%), 51 (50.5%) were right sided hemiplegic, 49(48.5%) were left sided hemiplegic, while 1 (0.99%) was affected on both sides. When grading the impact, eight (7.92%) had total weakness, while 93 (92.1%) had partial weakness. Thirty eight (37.6%) had speech defects, while the remaining 63 (62.4%) had no speech defect. Sixty two (61.4%) had hypertension, 10(9.9%) had diabetes, 1 (0.99%) had renal impairment, 14 (13.86%) had two other types of co morbidity while 14 (13.86%) had no comorbitities.
Nature of employment, work type and remuneration
Table 1 reveals the results obtained from one hundred and one [101] post stroke survivors. The results reveal information on the nature of their employment, type of work and remuneration before and during their illness.
Nature of employment, type of work and remuneration
Nature of employment, type of work and remuneration
Table 2 reveals the results obtained on the level of communication required for the post stroke survivors to return to work. The level of interaction required for them to be qualified to return to work was also assessed.
Level of work, communication and interactions
Level of work, communication and interactions
Test-retest reliability was analyzed for Domains 1–3. The initial scores for the domains were 89.21±6.20, 53.07±7.04, 64.64±9.53 respectively. On the second visit the scores obtained were 90.14±6.16, 53.00±5.42, 65.57±8.35.Test retest reliability analysis gave an ICC of 0.85(p = 0.001) for Domain 1, Domain 2 an ICC of 0.91 (p = 0.001) and Domain 3 an ICC of 0.99 (p = 0.001).The Bland Altman plotting method revealed that the test retest results were not strictly centered and the bias was only –0.93 for Domain 1; 0.07 for Domain 2 and –0.93 for Domain 3.The limits of agreement for the two scores of each Domain were –3.16 to 1.31, –6.99 to 7.14 and –13.6 to 11.74 respectively (Table 3 and Figs. 3, 9).
Internal consistency for Domains 1–3
Internal consistency for Domains 1–3
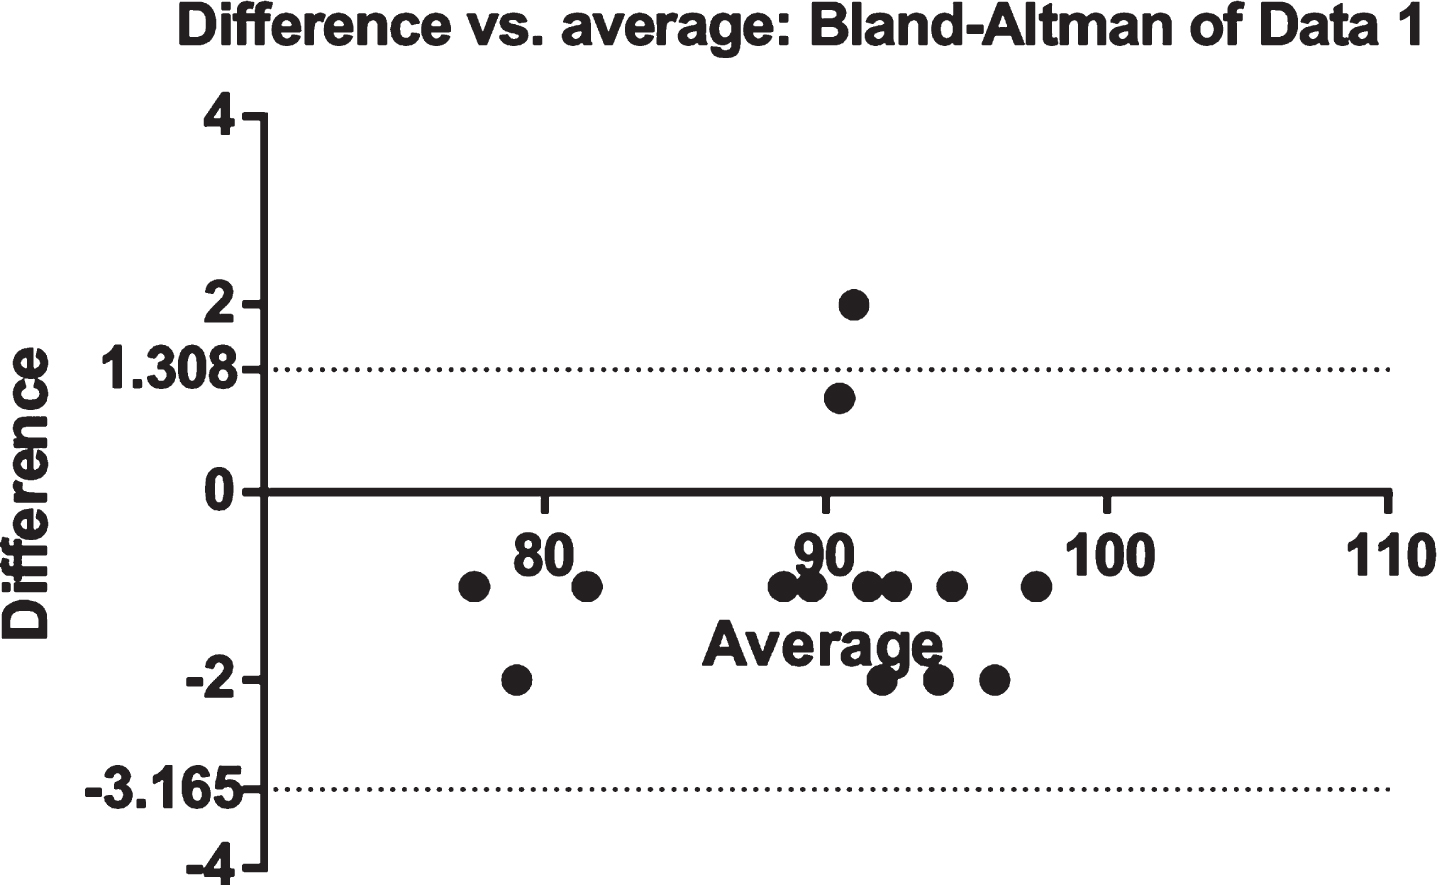
Bland-Altman plot of test-retest scores of the RAS (Domain 1). The difference between scores = Scores at first visit -RAS (Domain 1 score at the second visit).
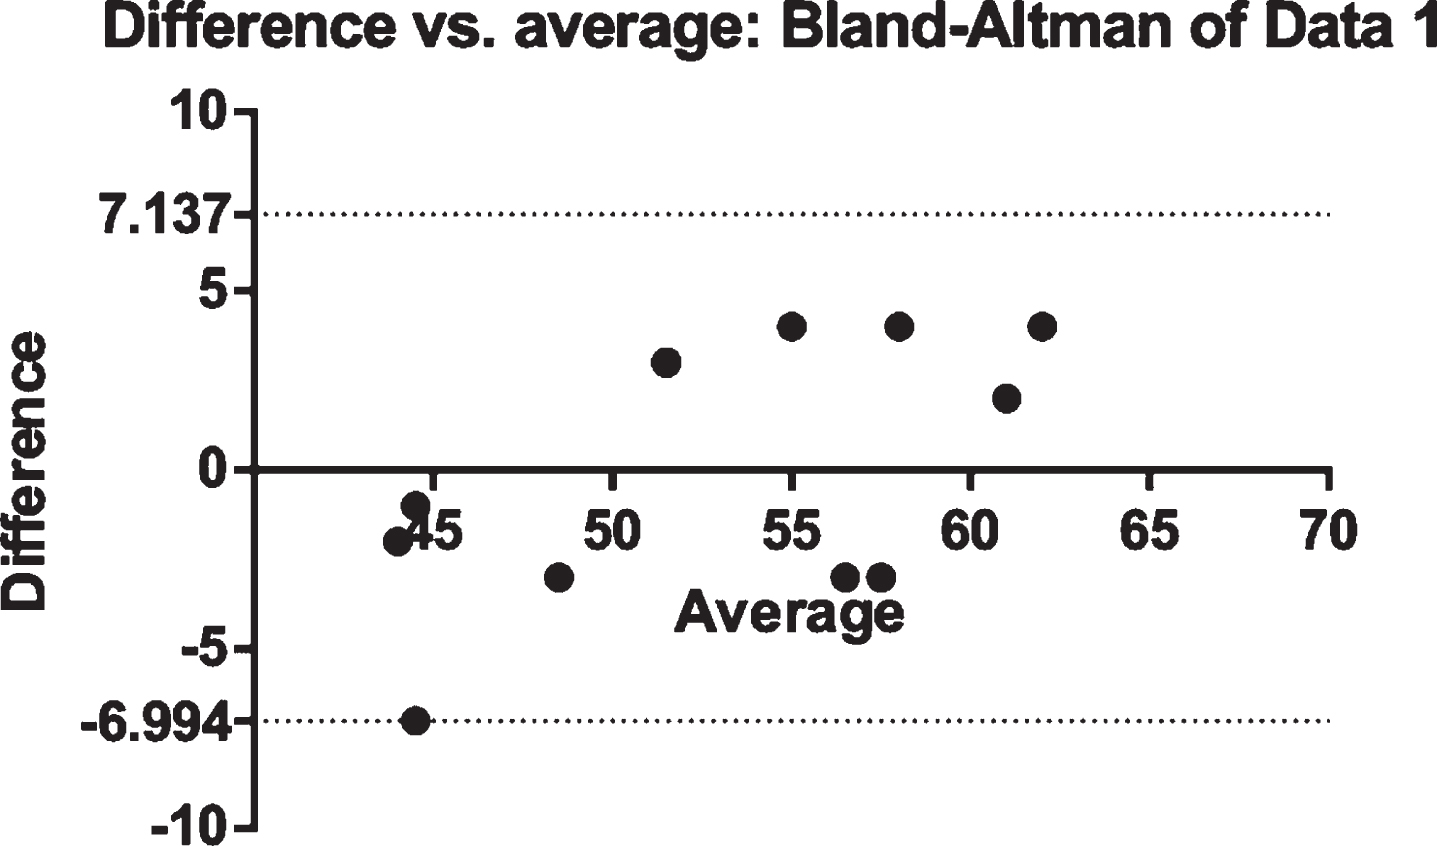
Bland-Altman plot of test-retest scores in analysis of the RAS (Domain 2). The difference between scores = Scores at the first visit –RAS (Dom 2) scores at the second visit.
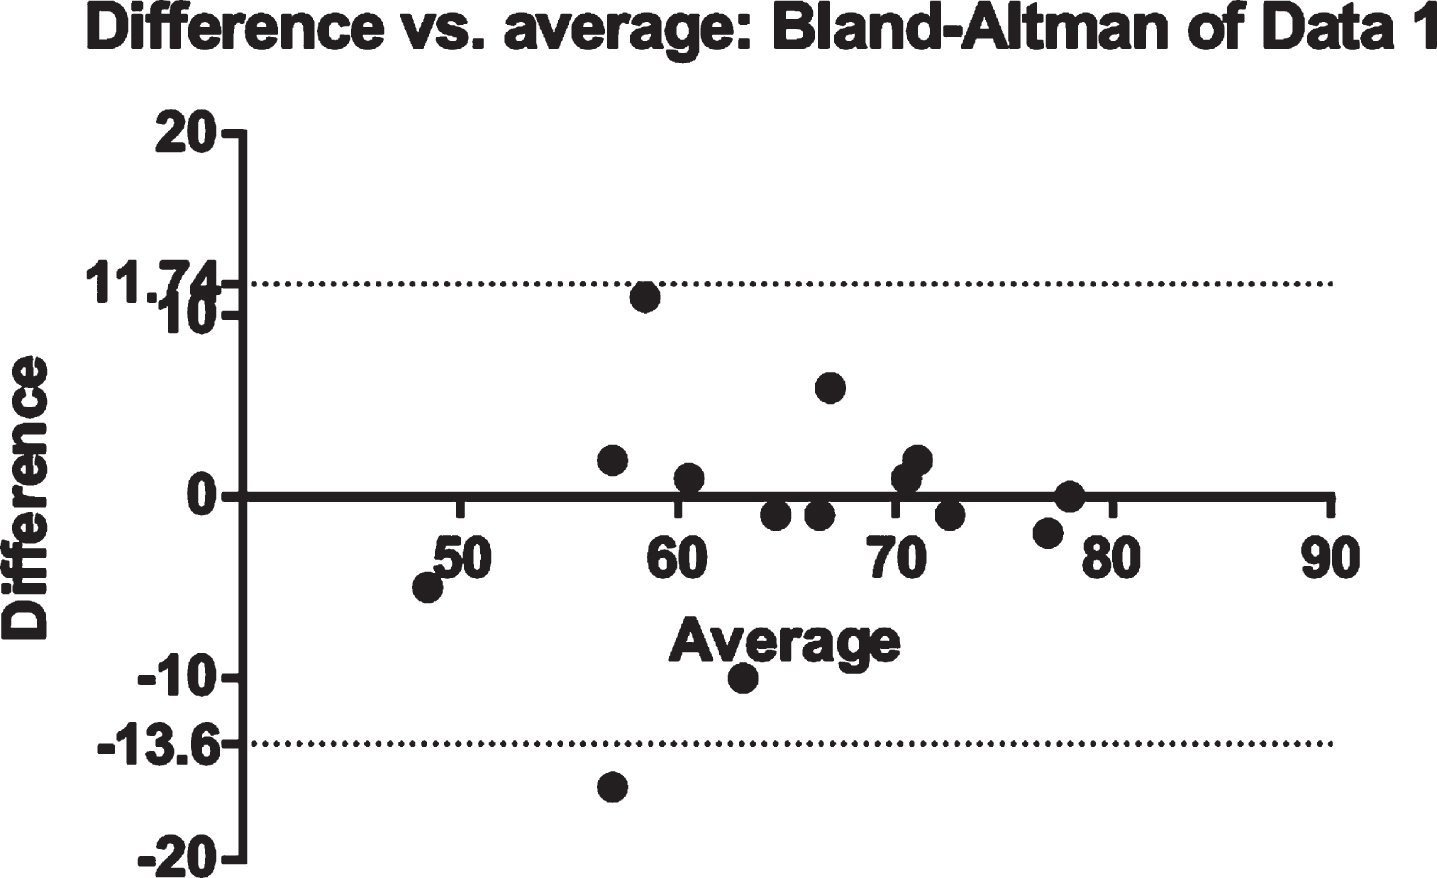
Bland-Altman plot of test-retest scores in analysis of the RAS (Domain 3). The difference between scores = Scores at the first visit –RAS (Domain 3) scores at the second visit.
Internal consistency was high with a Cronbach’s alpha coefficient of 0.81 for Domain 1, 0.93 for Domain 2 and 0.76 for Domain 3.
Assumption of normality (Shapiro-Wilk) domain 1
From the Supplementary Data it is evident that the Shapiro-Wilk statistic for items tested were significant at 0.01 alpha levels. Thus, this suggests that the distribution of scores for the sample is significantly different compared to a normal distribution [25]. An assessment of the normality of data is a prerequisite for many statistical tests as normal data is an underlying assumption in parametric testing. This reveals that only non-parametric statistical tests would be appropriate for inferential analysis, as the data was not normally distributed and therefore would not be appropriate for parametric statistics.
Structural validity (Factor Analysis) domain 1
The Kaiser-Meyer-Olkin measure of sampling adequacy (KMO) value for Domain 1 was X2 = 0.63 and that of Bartlett’s test of sphericity value was significant (p = 0.000) therefore data were suitable and adequate for factor analysis.
Part 1: Principal component analysis (Domain 1)
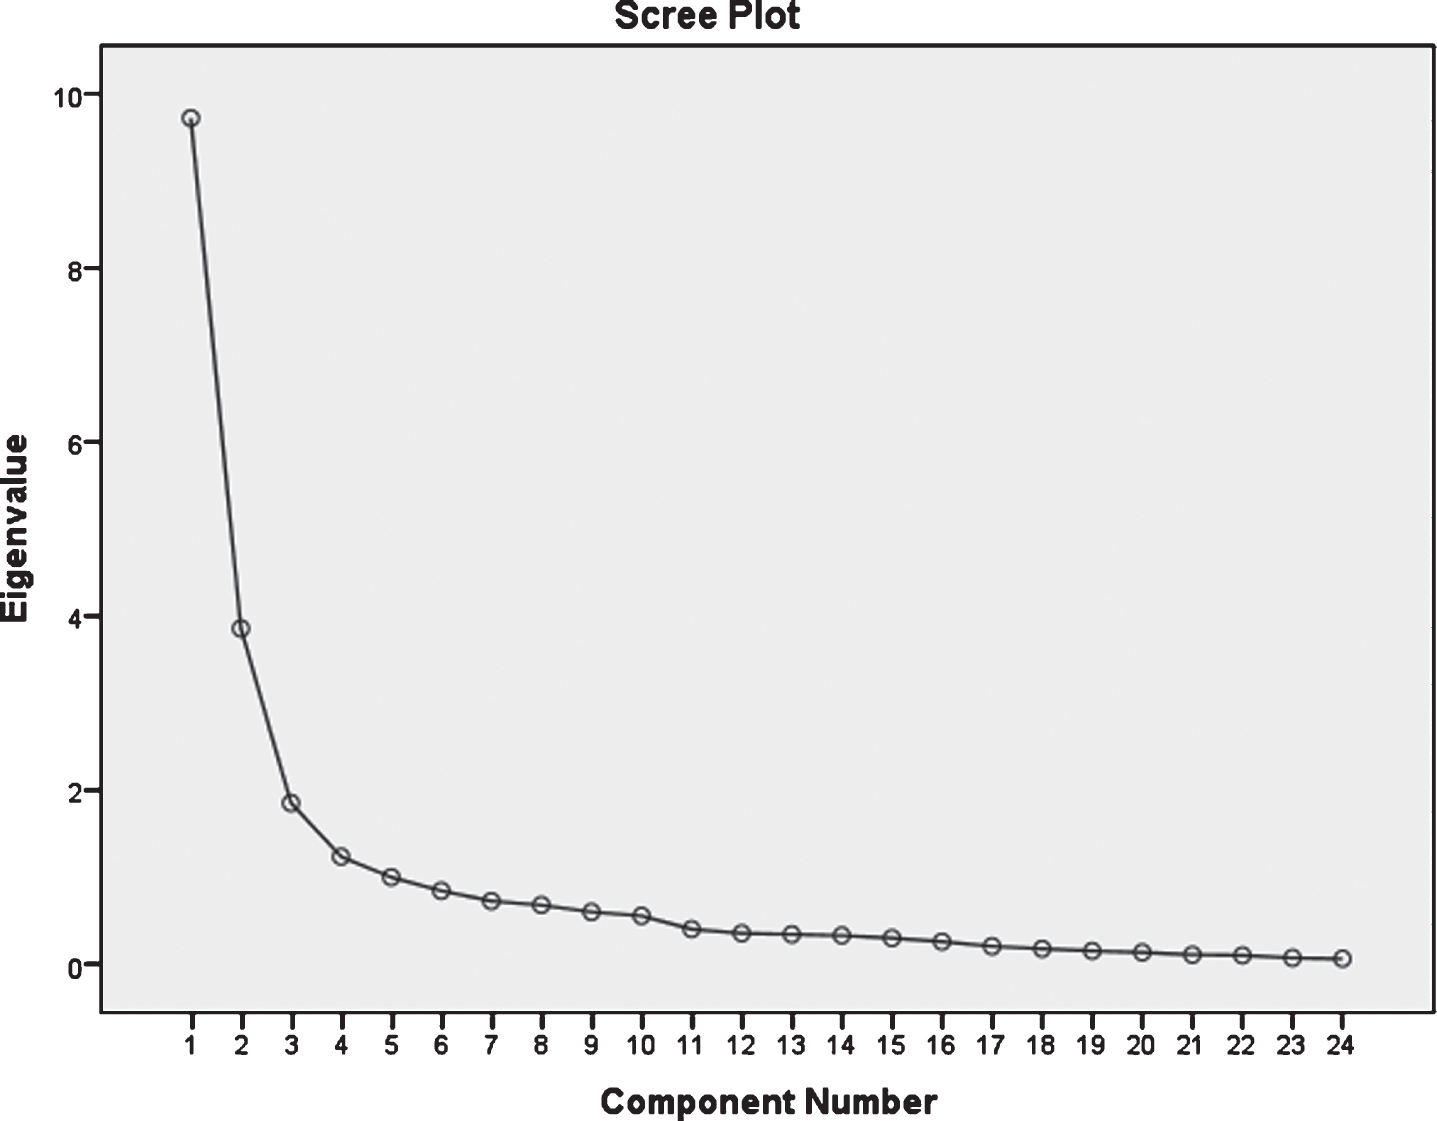
The Supplementary Data shows tables of communalities, with the factor loading of each of the 43 items of Domain 1, all the scale items had factor loadings that were above 0.3 which indicated that all the items are to be retained for use on the scale. Principal component analysis revealed the presence of 10 factors with the eigenvalues exceeding 1 in Domain 1 (Supplementary Data). Ten factors emerged from extraction as shown in the scree plot (Fig. 1). Using Cartell’s scree test, it was decided to retain five components for further investigation in Domain 1. It was further supported by the result of the Monte Carlo parallel analysis which showed five components with eigenvalues exceeding the criterion values for randomly generated data matrix of the same size (Table 3). Figure 2 reveals the scree plot generated after subjecting the eigenvalues to Oblimin rotation in order to obtain the perfected scree plot [26].
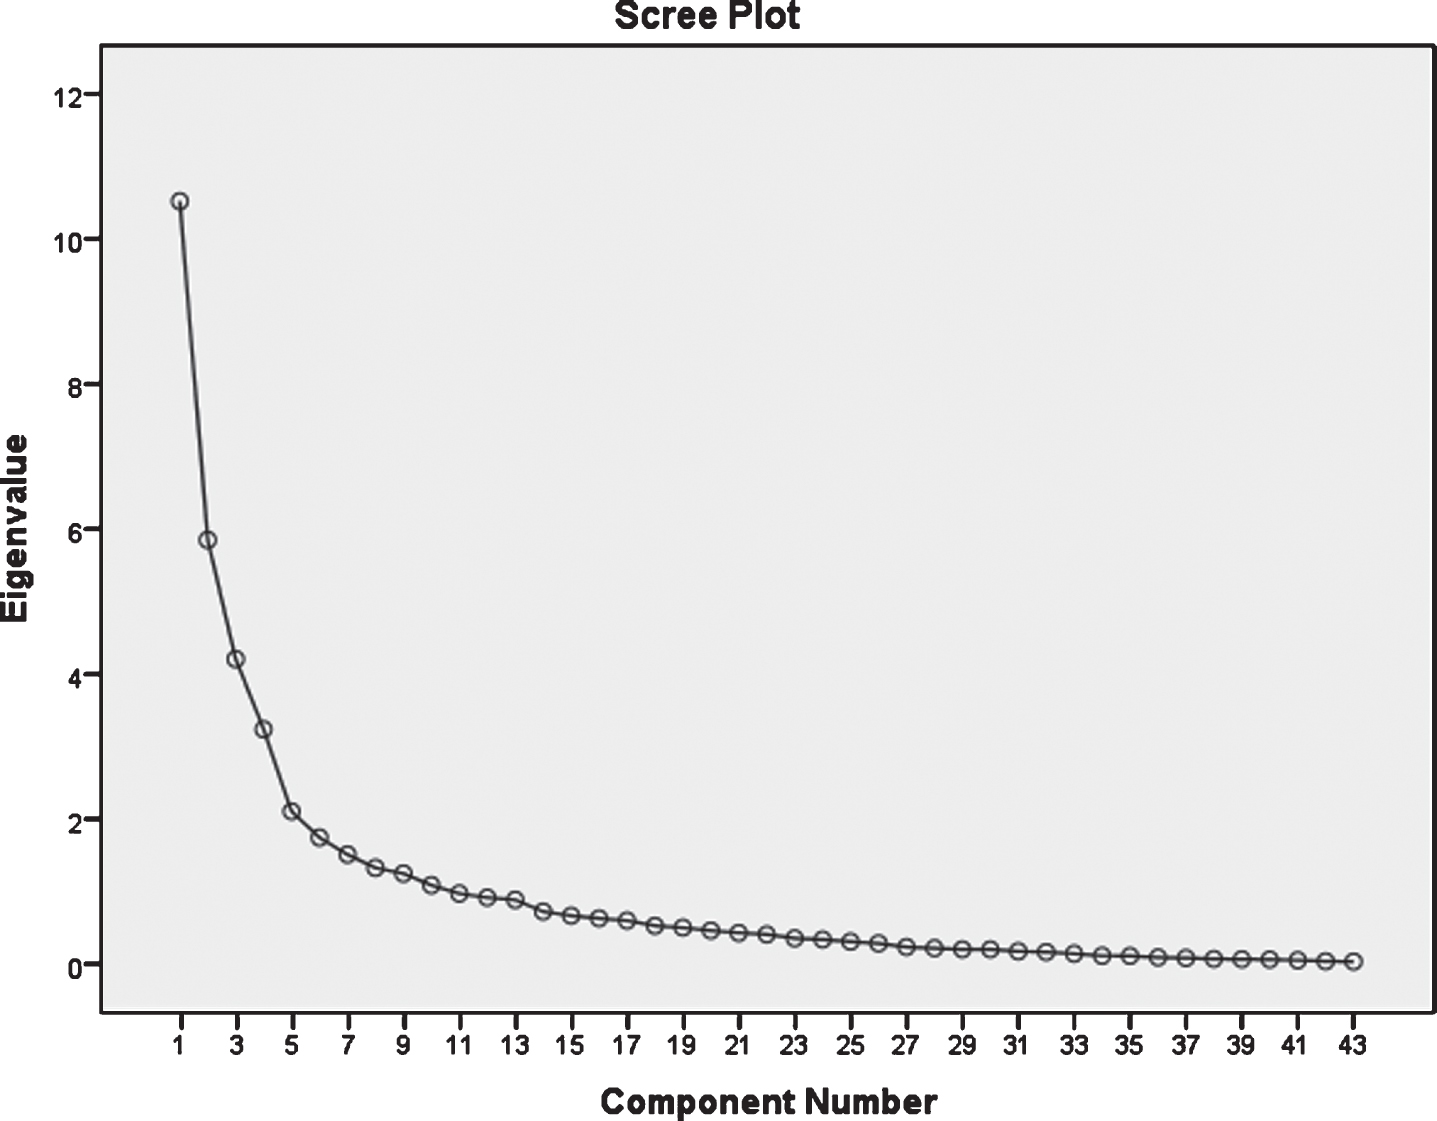
Scree plot of the 10 factors before Oblimin rotation.

Scree plot of the 10 factors after Oblimin rotation.
The percentage of variance explained for the factors are shown in Table 3. The pattern matrix demonstrated the factors loading of each of the variables (Tables 6 and 7).
The structure matrix, which is unique to the Oblimin output, provides information about the correlation between variables and factors which was r = –0.27 for Domain 1 (Supplementary Data).
Assumption of normality (Shapiro-Wilk) domain 2
From the Supplementary Data it becomes evident that the Shapiro-Wilk statistic for items tested were significant at 0.01 alpha levels. Thus, this suggests that the distribution of scores for the sample is significantly different compared to a normal distribution [25]. This reveals that only non-parametric statistical tests would be appropriate for inferential analysis, the data not been normally distributed would not be appropriate for parametric statistics.
Structural validity (Factor Analysis) domain 2
The Kaiser-Meyer-Olkin measure of sampling adequacy (KMO) value for Domain 2 was 0.839 and the Bartlett’s test of sphericity value was significant (p = 0.000). Ideally the KMO value is from 0.6 or above and that of the Bartlett’s Test of sphericity value is significant (i.e. the significant value should be 0.05 or smaller) to verify that the data used are suitable for factor analysis. This was the case based on results obtained.
Part 1: Principal component analysis (Domain 2)
The Supplementary Data shows the factor loading of each of the 24 items of Domain 2. All scale items had factor loadings that were above 0.3 which indicated that all items are to be retained for use on the scale. Principal component analysis revealed the presence of 4 factors with the eigenvalues exceeding 1 in Domain 2 explaining the variance respectively (Supplementary Data). Four factors emerged from extraction as shown in the scree plot (Fig. 4). Using Catell’s scree test, it was decided to retain three components for further investigation in Domain 2. It was further supported by the result of the Monte Carlo parallel analysis (Supplementary Data), which showed five components with eigenvalues exceeding the criterion values for randomly generated data matrix of the same size (Supplementary Data) [26]. Figure 5 reveals the scree plot generated after subjecting the eigenvalues to Oblimin rotation in order to obtain the perfected scree plot.

Scree plot (Domain 2) of 4 factors before Oblimin rotation.
Scree plot (Domain 2) of 4 factors after Oblimin rotation.
The percentage of variance explained for the factors are presented in the Supplementary Data. The pattern matrix demonstrated the factors loading of each of the variables (Supplementary Data).The structure matrix which is unique to the Oblimin output provides information about the correlation between variables and factors which was r = 0.28 for Domain 2.
Assumption of normality (Shapiro-Wilk) Domain 3
From the Supplementary Data it is evident that the Shapiro-Wilk statistic for items tested was significant at 0.01 alpha levels, which suggests that the distribution of scores for the sample is significantly different compared to a normal distribution [25]. This reveals that only non-parametric statistical tests would be appropriate for inferential analysis, the data not been normally distributed would not be appropriate for parametric statistics.
Structural validity (Factor Analysis) domain 3
The Kaiser-Meyer-Olkin measure of sampling adequacy for Domain 3 was 0.66 while the Barlett’s test of sphericity was significant (p = 0.001). Kaiser recommends accepting values of Kaiser-Meyer-Olkin (KMO) greater than 0.5 as acceptable [27]. Values below this should lead to either collection of more data or a rethink of which variable to include. Therefore the data were suitable for factor analysis and was adequate for data reduction.
Part 1: Principal component analysis (Domain 3)
The Supplementary Data reveals the factor loading of each of the 19 items of Domain 3 on the scale after extraction. All the scale items had factor loadings that were above 0.3 which indicated that all the items are to be retained for use on the scale. Principal component analysis revealed the presence of 5 factors with the eigenvalues exceeding 1 in Domain 3 explaining the variance respectively (Supplementary Data). Five factors emerged respectively from extraction as shown in the scree plot (Fig. 8). Using Catell’s scree test, it was decided to retain five components for further investigation in Domain 3. It was further supported by the result of the Monte Carlo parallel analysis which showed three components with eigenvalues exceeding the criterion values for randomly generated data matrix of the same size (Tables 15) [26]. Figure 8 reveals the scree plot generated after subjecting the eigenvalues to Oblimin rotation in order to obtain the perfected scree plot.

Scree plot (Domain 3) of 5 factors after Oblimin rotation.
The percentage of variance explained for the factors are presented in the Supplementary Data. The pattern matrix demonstrated the factors loading of each of the variables (Supplementary Data). The structure matrix which is unique to the Oblimin output provides information about the correlation between variables and factors which were for Domain 3 (Supplementary Data).
Discussion
Item reduction and factor analysis
One hundred and one patients who were stroke survivors participated in the psychometric testing of the return to work assessment scale. Factor analysis was done using the principal component analysis for each domain. Factor analysis according to Nunnaly cited in Matsunaga, is intimately involved with the question of validity and it is the heart of the measurement of psychological constructs [28]. In other words, factor analysis provides a diagnostic tool to evaluate whether the collected data are in line with the theoretically expected pattern, or structure of the target construct and thereby determine if the measures used, have indeed measures what they are purposed to measure. The choice of principal component analysis was informed by the fact that the scale had already been established on existing theories (the Flag model, international classification of function and the psychometric theory) by the researcher.
Assumption of normality (Shapiro-Wilk)
It was evident that the Shapiro-Wilk statistic for items tested was significant at 0.01 alpha levels in all the three domains. The assumption of normality was tested with the Shapiro-Wilk test. Field recommended the test to be a strong and accurate test for the assumption of normality [25]. In the Shapiro-Wilk test, a non-significant (p > 0.05) statistic shows that the distribution of the particular sample is not significantly different from a normal distribution [25–30]. This would indicate that the distribution of the data approximated normality. If the Shapiro-Wilk statistic tested significant (p < 0.05), this would indicate that the distribution of data differed significantly from a normal distribution that in turn suggests that the distribution was not normal [25–30]. The sample size may not be as large as required; the participants are post stroke survivors and not an apparently healthy population. Large samples sizes can be obtained for a healthy normal population in which a post stroke survivor is not totally included. They are a special group of people with particular needs and the data obtained may not be normally distributed.
Domain 1 (Personal)
The Kaiser-Meyer-Olkin measure of sampling adequacy (KMO) value for Domain 1 is 0.63 and that of Bartlett’s test of sphericity value is significant (p = 0.000). Therefore factor analysis is appropriate. Kaiser recommends accepting values of Kaiser-Meyer-Olkin (KMO) greater than 0.5 as acceptable [20]. The 43 items of the Domain1 (personal) of RAS were subjected to principal component analysis (PCA), prior to performing PCA the suitability of data for factor analysis was assessed. Inspection of the correlation matrix revealed the presence of many coefficients 0.3 and above the Kaiser-Meyer-Olkin value was 0.65 exceeding the recommended value of 0.6 and Barlett’s test of sphericity revealed statistical significances, supporting the factorability of the correlation matrix [26].
Principal components analysis revealed the presence of 10 components with eigenvalues exceeding 1,explaining 24.38%, 13.54%, 9.72%, 7.47%, 4.82%, 4.0%, 3.46%, 3.03%, 2.89%and 2.48%of variance respectively (Supplementary Data). An inspection of the scree plot (Fig. 1) revealed a clear break after the sixth component using Catell’s scree test, it was decided to retain five components for further investigation [26]. This was further supported by the results of parallel analysis which showed only five components with eigenvalues exceeding the corresponding criterion values for a randomly generated data matrix of the same size. The five component solution explained a total of 61.28%of the variance, with component 1 contributing 25.07%, component 2 contributing 14.00%component 3 contributing 10.04%, component 4 contributing 7.61%and component 5 contributing 4.56 %(Table 3). To support the explanation of those five components, Oblimin rotation was performed. The rotated solution revealed the presence of simple structure with all components showing a number of strong loadings and all variables loading substantially or component 1 to 3 (Supplementary Tables 3 and 4). The interpretation of the five components was consistent, there was a weak negative correlation between the five factors (r = –0.27).
Domain 2 (Work)
The Kaiser-Meyer-Olkin measure of sampling adequacy (KMO) value was 0.84 and the Bartlett’s test of sphericity value was significant (p = 0.000). When Bartlett’s test of sphericity is significant it indicates that the correlations between variables are in general significantly different from zero [25–31]. The 24 items of the return to work Domain 2 (work) were subjected to principal component analysis (PCA) using SPSS version 23. Prior to performing PCA, the suitability of data for factor analysis was assessed. Inspection of the correlation matrix revealed the presence of many coefficients of 0.3 and above. The Kaiser-Meyer-Olkin value of 0.6 and Barlett’s Test sphericity reached statistical significance supporting the factorability of the correlation matrix. Principal component analysis revealed the presence of four components with an eigenvalue exceeding 1, explaining, 40.09%, 16.64%, 7.46%, and 4.94%of the variance respectively (Supplementary Data). An inspection of the scree plot (Fig. 5) revealed a clear break after the fourth components for further investigation. This was further supported by the results of parallel analysis, which showed only three components with eigenvalues exceeding the corresponding criterion values for a randomly generated data matrix of the same size. The three component solution explained a total of 64.09%of the variance, with component1 contributing 40.39%, component 2 contributed 16.02%and component 3 contributing 7.689%. To aid the interpretation of the two components, Oblimin rotation was performed. The rotated solution revealed the presence of simple structure with all components showing a number of strong loading and all variables loading substantially on all components (Supplementary Data). There was a weak negative correlation between the two factors (r = –0.28)
Domain 3: Contextual factor
The Kaiser-Meyer-Olkin measure of sampling adequacy was 0.658 while the Bartlett test of sphericity was significant (p = 0.000). Therefore the factor analysis is appropriate. Using the Kaiser criterion, we are interested only in components that have an eigenvalue of 1 or more. To determine how many components meet this criterion, looking at the total variance explained table, Kaiser recommends accepting values of Kaiser-Meyer-Olkin (KMO) greater than 0.5 as acceptable [27–31].
The 19 items of the return to work (Domain 3) were subjected to principal components analysis using SPSS version 23. Prior to performing PCA, the suitability of data for factor analysis was assessed. Inspection of the correlation matrix reveals the presence of many coefficients of 0.3 and above. The Kaiser-Meyer-Olkin value was 0.66 exceeding the recommended value of 0.6 and Barlett’s test of sphericity reached statistical significance, supporting the factorability of the correlation matrix.
Principal components analysis revealed the presence of five components with eigenvalues exceeding 1, explaining 26.00%, 19.16%, 12.25%, 6.99%, and 6.14%of variance respectively (Supplementary Data). An inspection of four components using Cartell’s screen test (Fig. 7), it was decided to retain five components for further investigation. This was not supported by the parallel analysis which showed only two components with eigenvalues exceeding the corresponding criterion values for a randomly generated data matrix of the same size.

Scree plot (Domain 3) of 5 factors before Oblimin rotation.
The three components solution explained a total of 57.07%of the variance, with component 1 contributing 24.98%, and component 2:19.58%, while component 3 contributed 12.50%. To aid in the understanding of these three components, Oblimin rotation was performed (Supplementary Data). The rotated solution revealed the presence of simple structure with both components showing a number of strong loading and all variable loading substantially on all the components. There was a weak negative correlation between the three factors (r = –0.28)
The stability of the Domain of the return to work scale was tested using test-retest reliability. The instrument was administered initially and was re administered after a week’s interval. The intraclass correlation (ICC) obtained for Domain 1:0.85, Domain 2:0.91, and Domain 3:0.99.ICC for test–retest can be considered excellent, graphic representation of the test–retest scores by the Bland-Altman method (Figs. 3, 9) revealed that despite a marginal number of outliers, the scores were not all centered, with a systematic trend observed. The return to work assessment scale is a multidimensional assessment tool and it is a good, internally consistent and reliable tool that has demonstrated good group and structural validity.
The article concentrated only on structural, construct validity and test-retest reliability. Other forms of validity and reliability such as the criterion (concurrent and predictive) and scorer’s reliability were not tested.
Conclusion
The return to work assessment scale is an excellent, internally consistent and reliable tool that has demonstrated good group reliability, internal consistency and structural validity. It should be used to assess and monitor return to work among post stroke survivors.
Author contributions
PO was involved with conceptualizing, literature review, manuscript writing, data collection and analysis of data. AR was involved with conceptualizing, literature review, and manuscript writing. MS was involved with conceptualizing, manuscript writing and interpretation of analysis.
Conflict of interest
The authors declare that there is no conflict of interest.
Supplementary data
The supplementary files are available from https://dx.doi.org/10.3233/WOR-213528.