
Abstract
BACKGROUND:
The match between classroom furniture and students’ anthropometry is an important factor in students’ academic performance.
OBJECTIVE:
Our aim was to investigate the ergonomic suitability of the classroom furniture to the students, and to propose design suggestions for both desks and chairs.
METHODS:
We analyzed the ergonomics of classroom furniture that students aged 10–14 years old in Turkey currently use. To this end, we selected Maltepe Primary Education School, one of the largest schools in the Çankaya district of Turkey’s capital city, Ankara, in which to conduct the study. A sample of 119 students was selected, and seven anthropometric measurements were taken for each of these students. We then calculated five relationships between the dimensions of the furniture and the students’ anthropometric measures.
RESULTS:
We observed high levels of mismatch rates, with an average of 66.6%and high values of over 95%for the relations of two furniture measures, seat depth (related with buttock-popliteal length) and seat-to-desk height (related with elbow height, sitting). Each anthropometric measure was applied a fit probability distribution, and based on those distributions; we suggested the most appropriate classroom furniture dimensions in order to maximize suitability of the furniture to the anthropometric measures in terms of fixed-size (i.e., non-adjustable) classroom furniture.
CONCLUSIONS:
High mismatch rates can be reduced by 52.0%on average based on the classroom furniture dimensions suggested in this study.
Introduction
Classroom furniture is one of the important factors affecting students’ motivation, performance, and willingness to learn in school. Furniture has many parameters, such as esthetics, color, and design. In this study, we focus on the physical compatibility of school furniture with middle school students’ anthropometric measurements. Any level of incompatibility can result in a student’s discomfort, distracted attention, pain, and even long-term health issues.
The term “middle school” can vary in its meaning from country to country. For example, in Turkey, “primary education” covers from first grade to eighth grade, combining two former terms that have been in use since the proclamation of the Turkish Republic following the collapse of the Ottoman empire; “primary school” and “middle school.” The term primary school used to cover Grade 1 to Grade 5, although more recently that changed to Grade 1 to Grade 4, and whereas middle school used to cover Grade 6 to Grade 8, it now means Grade 5 to Grade 8. Although the term “middle school” is no longer used, it is well-known in Turkish society and by Turkish educators, and is widely known to cover Grade 5 to Grade 8. Middle school students are in the 10 to 14 year old age group. As an example of the term “middle school” in another country’s context, the term applies to roughly the same school grades as in the United States [1]. In 2018, the total number of middle school students in Turkey was 5,590,134, with 90.8%enrolled to public (state) schools and the remainder in private schools [2], meaning that the vast majority of middle school students in Turkey attend public schools.
As researchers, we worked with middle school students from Maltepe Primary Education School, which is a large public school in Turkey. Maltepe Primary Education School had a total enrollment of 1,201 students to its middle school during the 2017/2018 academic school year. This school was chosen for three main reasons. First, the school is located in the center of Ankara, Turkey’s capital city, with a population exceeding five million. The school’s demographic makeup consists of students from varying different backgrounds. We want to point out that the students constituting the sample used in the current study are all from the same ethnic background, hence ethnicity does not play a significant role in any ergonomic mismatches and was not therefore considered as a relevant factor [3]. Second, the school is considerably large, which makes it possible to observe a wide variety of students. Last, with an excess of five million middle school students attending public schools throughout Turkey, from a total of 5.5 million, public (state) schools are unable to offer a wide range of classroom facilities; therefore, the classrooms of Maltepe Primary Education School are considered to be a good representative of public schools throughout Turkey.
Our objective of the study is to compare middle school classroom furniture to the anthropometric measures of a representative student sample from a large city middle school in Turkey in order to evaluate the level of ergonomic mismatch between classroom furniture and students. So as to make appropriate inferences, we use probability distributions of five anthropometric measures based on the sample, and then put forward suggestions as to the most appropriate suitable furniture dimensions in order to mini-mize mismatch rates for non-adjustable classroom furniture.
Literature
Dianat et al. [4] reviewed the published literature regarding the methodology and applications of anthropometry in ergonomics and product design, and emphasized the need for anthropometric research in order to design for special user groups such as school-aged children. School classroom furniture is one of the products in this group. Whilst interruptions to the education of school-aged children occurred in most countries during the COVID-19 pandemic, schools are plausibly still the second most common place (after the home) that children are likely to spend much of their time. Accordingly, Bluyssen [5] performed a literature review, and pointed to new research directions for the health, comfort, and academic performance of children studying in school classrooms. Bluyssen mostly focused on air quality, acoustics, and lightning aspects of classroom ergonomics. Castellucci et al. [6] reviewed the literature on school furniture, with a specific aim to analyze the effect of its dimensions on school students’ physical responses and/or their academic performances in order to find a clear positive effect.
To the best of our knowledge, there have been no studies conducted on classroom furniture ergonomics in Turkey with students aged 10–14 years old (or within that range). Studies on even just anthropometric measurements for that age group of Turkish children have also been very limited. Kayiş and Özok [7] were among the earliest researchers in this area, presenting percentile values for 14 anthropometric measurements for 3,584 children aged 6–13 years old from schools in Ankara, Turkey. In a study published by İsmailoğlu [8], suggestions were made for school furniture dimensions based on the anthropometric measurements of 6–10 year old Turkish students in the Black Sea region of the country. Duyar [9] then constructed optimal growth standards for Turkish youth aged 12–17 years old after measuring 22 anthropometric dimensions on 100 selected subjects, whilst Burdurlu et al. [10] presented descriptive statistics on 23 static anthropometric measurements of 668 students living in Ankara, Turkey, who were aged between 12 and 15 years old. In another study, Aykal and Günyel [11] provided seven anthropometric measurements of 103 children aged 7–14 years old living in Diyarbakir, Turkey. Considering these papers, our current study provides the most recent data for Turkish students in the age range of 10 to 14 years old.
Panagiotopoulou et al. [12] compared classroom furniture dimension with 180 Greek primary school students’ (aged 7–12 years old and split equally by gender) anthropometric measurements and found that, except for desk clearance, the mismatch rates were high; with chairs too high and too deep, plus desks also found to be too high. Parcells et al. [13] used a sample of 74 students aged 10–14 years old with an equal gender split. They compared the students’ body dimensions to furniture dimensions in order to calculate the mismatch rate, and found that less than 20%of the students were using suitably sized classroom furniture. In Castellucci et al.’s [14] study, the researchers measured the mismatch between classroom furniture and the anthropometric measurements of Chilean Grade 8 students aged 12.5 to 14.5 years old. Using a sample of 195 students (101 female and 94 male), they considered three schools within three different socioeconomic areas and found quite high levels of mismatch leading to a conclusion that the furniture was mostly inadequate for the students. Castellucci et al. [15] undertook a similar study, but with a much larger sample of over three thousand students. Mismatch rates were found to be lower for private schools (compared to public and semipublic schools). The authors concluded that the furniture acquisition was made without any consideration of ergonomic criteria. In a study by Parvez et al. [16], the researchers collected the anthropometric measurements of 300 Bangladeshi primary school students, and proposed appropriate furniture dimensions in order to reduce mismatch percentages that were found to range from as high as 90%to as little as 10%. Comparing the anthropometric measurements of 375 Nigerian secondary school children aged 10–17 years old with the dimensions of their school furniture, Obinna et al. [17] concluded that the classroom furniture was not suited to a large number of the students.
It is clear that mismatches between students and classroom furniture dimensions cannot be blamed on the students’ anthropometric measurements. Either the furniture fits a student or it does not. Furniture selection is the fundamental decision point that can help reduce mismatch rates for new furniture acquisition (e.g., when replacing furniture or increasing school capacity). Even the reallocation of furniture within a classroom or school may go some way to improving the ergonomic match rate. Gouvali and Boudolos [18] compared the mismatch percentages of 274 Greek students aged 6–18 years old under two alternative scenarios: the current desk and table that each student used, and students given the best-fitting type of desk and chair. They found that the mismatch percentages were significantly reduced for the best-fitting furniture scenario in terms of desk height and chair seat height. They concluded that considering individual anthropometric measurements for the purposes of furniture allocation under current conditions may be improved, and that having a larger variety of furniture sizes available for each school grade would significantly reduce the mismatch rate. Lee et al. [19] considered the mismatch of students to school furniture using the anthropometric measurement of elbow height in a sitting position. They proposed using several desk height and seat height dimensions. Through the application of an optimization model, the researchers showed that under the best assignments, the mismatch rate could be significantly reduced.
The incorrect sitting postures of children at school can reduce their academic effectiveness during school-based activities such as writing [20]. Inappropriate furniture dimensions can result in students’ incorrect sitting positions [21], which over a prolonged period can negatively affect their spinal curvature resulting in back pain [22]. If a schoolchild uses furniture that best fits them, they are more likely to stay on-task compared to a child using furniture that does not properly fit them [23].
Furniture assessment is therefore an important topic from this perspective, and there have been a number of studies on this in the literature. For example, Troussier et al. [24] compared two furniture types, Mandal’s furniture (designed to reduce the load supported by the spine and its musculature) and a widely-accepted furniture design known as ISO standard furniture. Over a 5-year period, they assessed the effect of using each furniture type according to back pain reported through a questionnaire and from the physical examination of 263 children aged 8 to 11 years old. Although the physical examination did not indicate any significant difference according to the furniture type used, Mandal’s furniture was found to have been preferred by the children. Based on the anthropometric data of 3,078 students, Castellucci et al. [25] proposed an update to the Chilean standard for school furniture, which was found to significantly improve the match rate. Kaya and Erkarslan [26] proposed furniture dimensions based on the anthropometric measurements of 393 students aged 12-13 living in İzmir, Turkey; having compared the students’ furniture measurements with the Standards of Classroom Furniture published by the Republic of Turkey’s General Directorate of Primary Education. Herga and Fošnarič [27] found serious mismatches between Slovenian students in Grade 6 and their school’s furniture which had been designed according to the ISO 5970 standard. Lee and Yun [28] made an assessment of the Korean standard for height selection for both desks and chairs used in primary schools. From their study, they suggested new guidelines which were shown to significantly decrease the mismatch rate. In another study, Lu and Lu [29] collected seven anthropometric measurements from 1,146 Indonesian school students aged 6–12 years old, and suggested six furniture dimensions based on their findings after making comparisons with the Indonesian National Standard for furniture dimensions for small and large school furniture types.
There have also been studies conducted on fur-niture properties that have proposed design suggestions. Carneiro et al. [30] used the anthropometric measurements of children aged 6–10 years old from 10 different countries, and proposed a universal measurement system for the school chair and desk set using the ellipse methodology. The researchers concluded that a company producing and supplying school furniture in the global market should be able to meet the furniture requirements for primary education classrooms by considering only five sizes of school furniture. Oyewole et al. [31] used anthropometric measurements of 20 first-grade students to propose ranges for six furniture dimensions (namely; seat height, seat depth, seat width, back rest, arm rest, and desk height) for an adjustable ergonomic furniture. Based on the anthropometric measurements of 940 Indonesian elementary school students aged from 7 to 12 years old, Yanto and Lu [32] found that the current school furniture dimensions were inappropriate, and proposed four different sizes of school furniture in their study.
In yet more example studies, Adeyemi et al. [33] found that none of the furniture was suitable for the majority of students in a study conducted in North-West Nigeria. They introduced a new set of furniture using the students’ anthropometric measurements and conducted statistical analyses along with a questionnaire in their assessment. Fixed furniture dimensions may induce constrained postures causing discomfort for some students [34], hence adjustable furniture has been widely suggested in many studies as a solution. Biswas et al. [35] calculated mismatch rates between anthropometric and furniture measurements for 300 Bangladeshi students (equally split by gender) aged 5 to 10 years old between three schools. Finding high mismatch rates, they concluded a preference for adjustable furniture. Maheshwar and Jawalkar [36] explained the design and production of 10 prototype furniture items (of which eight were adjustable) for two schools through the application of physical surveys, whole body assessment tools, and Rapid Upper Body Assessment. Ansari et al. [37] designed an adjustable chair based on 207 students’ anthropometric measurements in order to increase the match rate, and claimed that their designed chair was able to reduce musculoskeletal disorders in students. Ramadan [38] reported on an opposing result to adjustable furniture as a solution. Using the anthropometric measurements of 124 young male Saudi students aged 6–13 years old, the study found that even the best furniture adjustment w.r.t. discomfort scale (out of six possible adjustments) was not found to suit one-third of the students’ body dimensions in terms of their chair height; and suggested collecting additional anthropometric data (including from female Saudi students) in order to help designers apply ergonomic principles for a better furniture fit. Fidelis et al. [39] reported very high mismatch levels between the anthropometric measurements of 300 Nigerian primary school children aged from 5 to 12 years old and their school’s furniture dimensions. They emphasized that adjustable furniture might be considered a problem instead of a solution if students lacked knowledge regarding the proper settings of any adjustable furniture.
To the best of our knowledge, no study exists in the literature that has evaluated the ergonomic suitability of classroom furniture to Turkish middle school students using anthropometric measures. Also, we have not encountered any study that puts forth design suggestions (in terms of desk and chair measurements) for a fixed-size furniture with the aim of minimizing mismatch probability. Through our work, we believe that the current study fulfills these two gaps in the literature.
Method
Sample and study design
Prior to starting our study, we first obtained ethical approval from Çankaya University, Ankara, Turkey, in order to take students’ anthropometrical measurements. Next, we sought permission from the legal authorities to conduct our study at Maltepe Primary Education School. After receiving written permissions from the Turkish Ministry of National Education’s, Education Directorate of Çankaya District and also from Maltepe Primary Education School Directorate, we asked for the written permission of the middle school students’ parents. In total, 119 parents approved that their children could participate in our study. It should be noted that the sample of 119 volunteer students is a sample of convenience. The numbers of participant students w.r.t. grade and age and gender are given in Table 1.
Number of students w.r.t. grade and age and gender
Number of students w.r.t. grade and age and gender
In the school, two types of desks and three types of chairs are used, which can be seen in Fig. 1. Only four combinations of those types are used, namely D1C1, D1C3, D2C2, and D2C3; where D represents desk and C represents chair. All of the participant students’ furniture type (desk and chair combination) was recorded while taking the measurements.
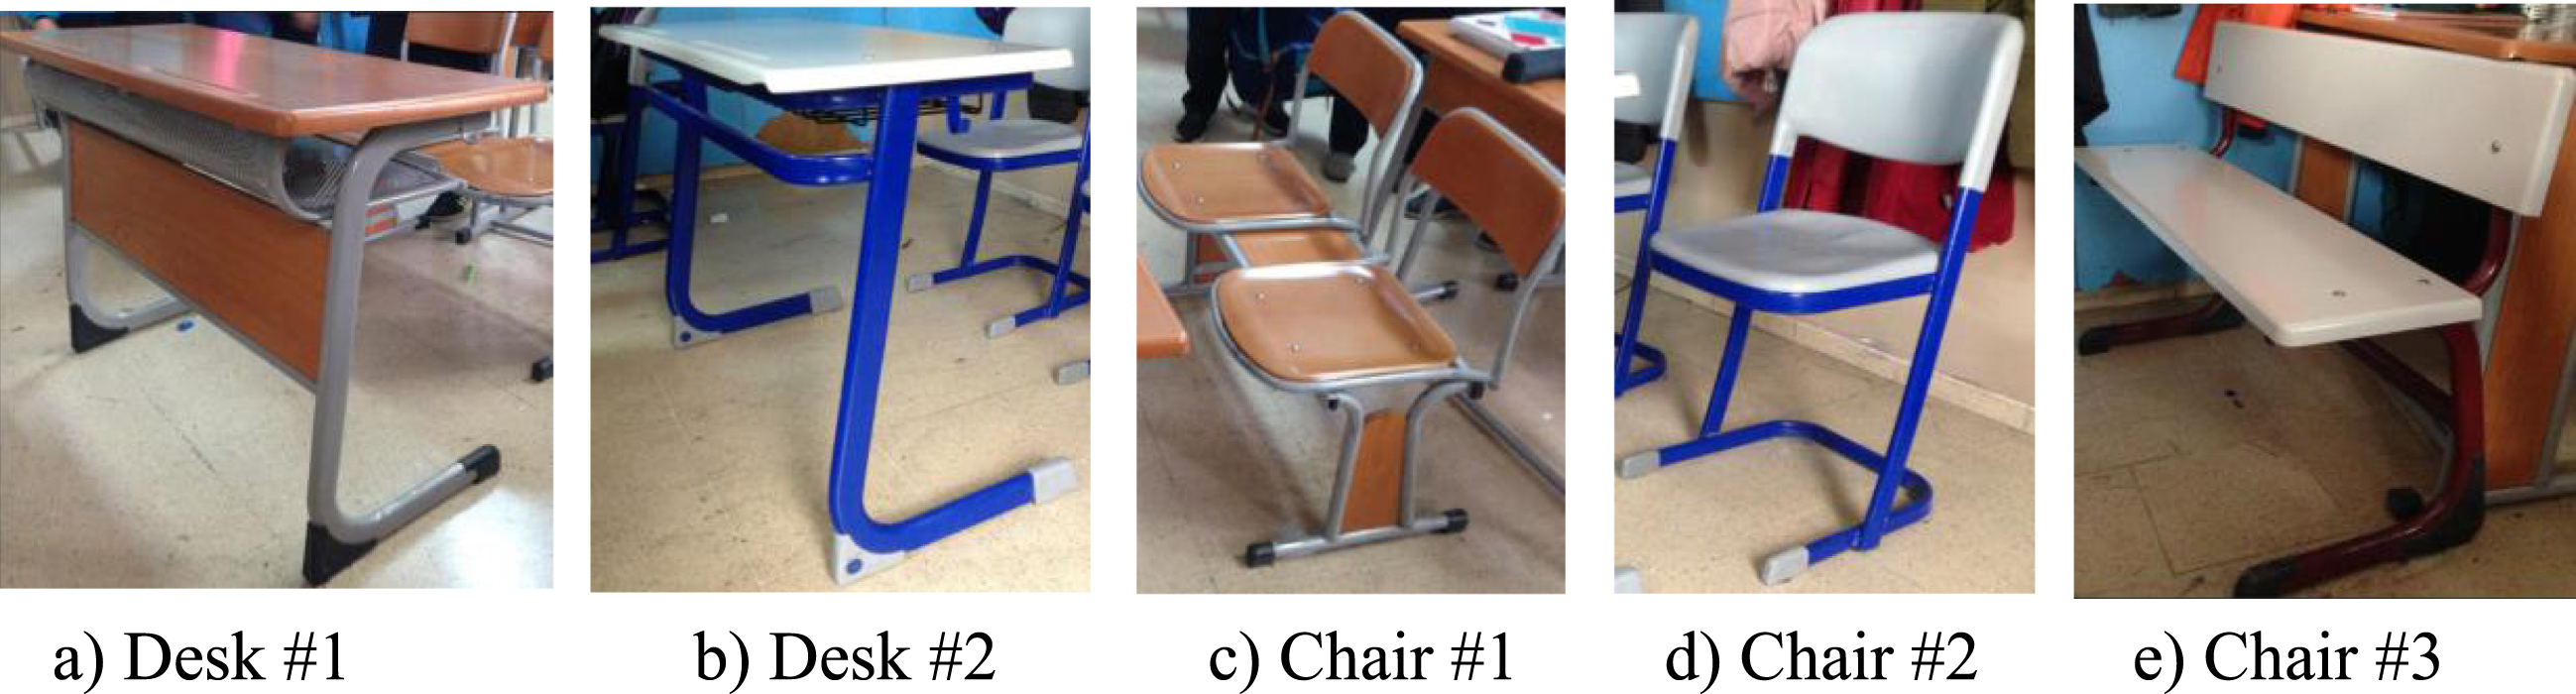
School furniture types.
We measured five separate dimensions of the furniture; as shown in Fig. 2, with the definitions being as follows: Seat-to-Desk Clearance (SDC): Vertical distance from the top of the front edge of the seat to the lowest structure point below the desk. Seat Width (SW): Horizontal distance between the lateral edges of the seat. Seat Height (SH): Vertical distance from the floor to the midpoint of the front edge of the seat. Seat Depth (SD): Distance from the back to the front of the sitting surface. Seat-to-Desk Height (SDH): Vertical distance from the top of the front edge of the seat to the top of the front edge of the desk.
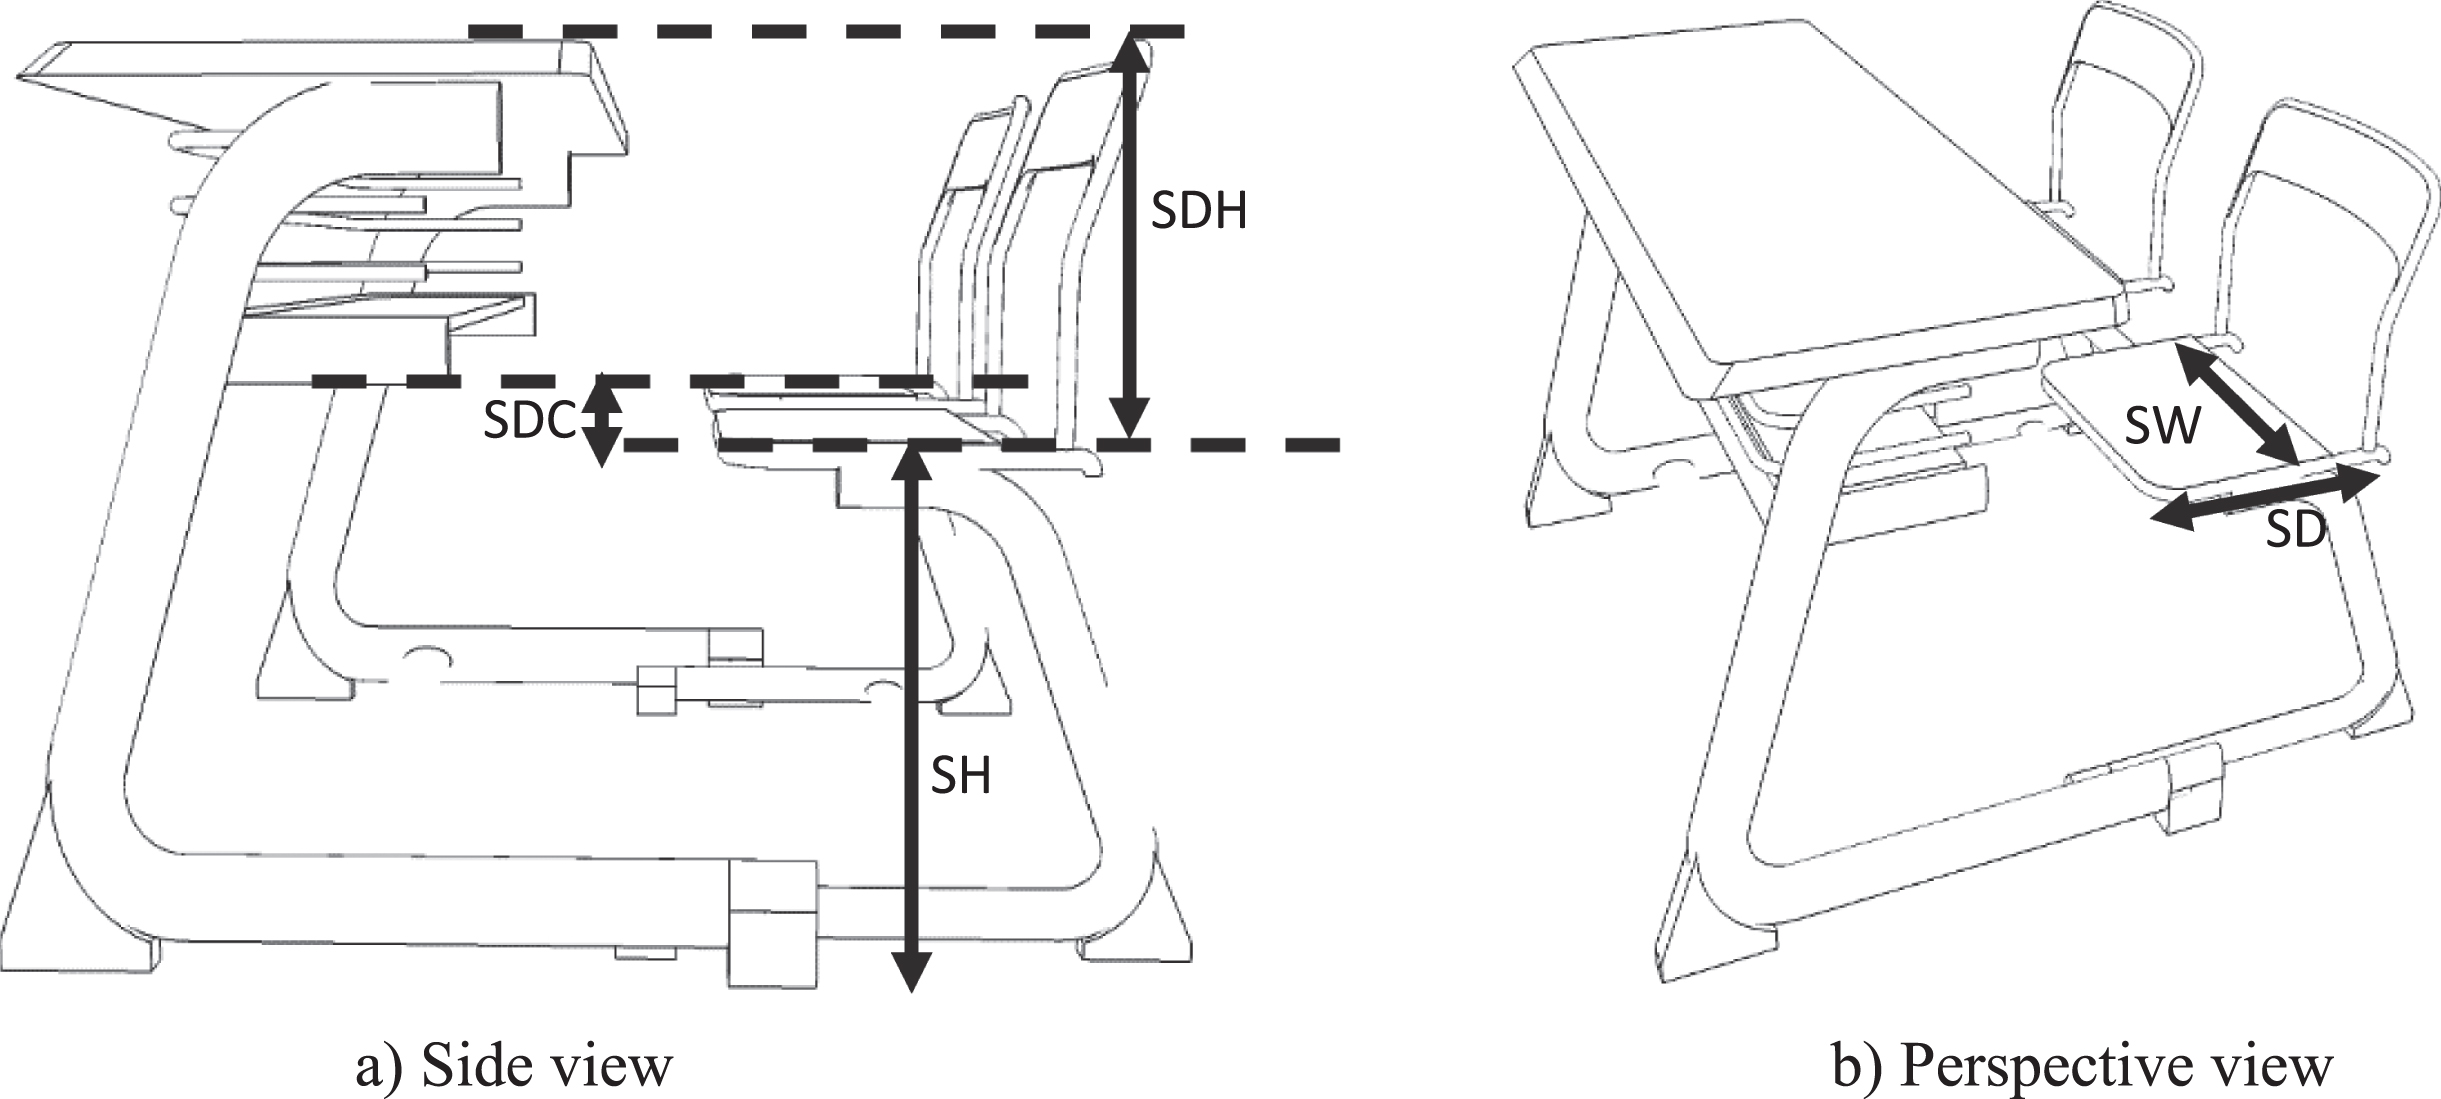
School furniture dimensions.
In a literature review regarding the collecting of anthropometric data on school students, Bravo et al. [40] suggested that researchers use procedures defined in the relevant standards. In our study, we applied seven different anthropometric measurements for each participant student, using definitions of the measures from ISO 7250-1 [41]. The anthropometric measures are as presented in Fig. 3, the definitions of which are as follows: Weight (W): Total mass (weight) of the body. Stature (S): Vertical distance from the floor to the highest point of the head (vertex). Thigh clearance (TC): Vertical distance from the sitting surface to the highest point on the thigh. Hip breadth, sitting (HB): Breadth of the body measured across the widest portion of the hips. Popliteal height, sitting (PH): Vertical distance from the foot-rest surface to the lower surface of the thigh immediately behind the knee, bent at right angles. Buttock-popliteal length (BPL): Horizontal distance from the hollow of the knee to the rearmost point of the buttock. Elbow height, sitting (EHS): Vertical distance from a horizontal sitting surface to the lowest bony point of the elbow bent at a right angle with the forearm horizontal.
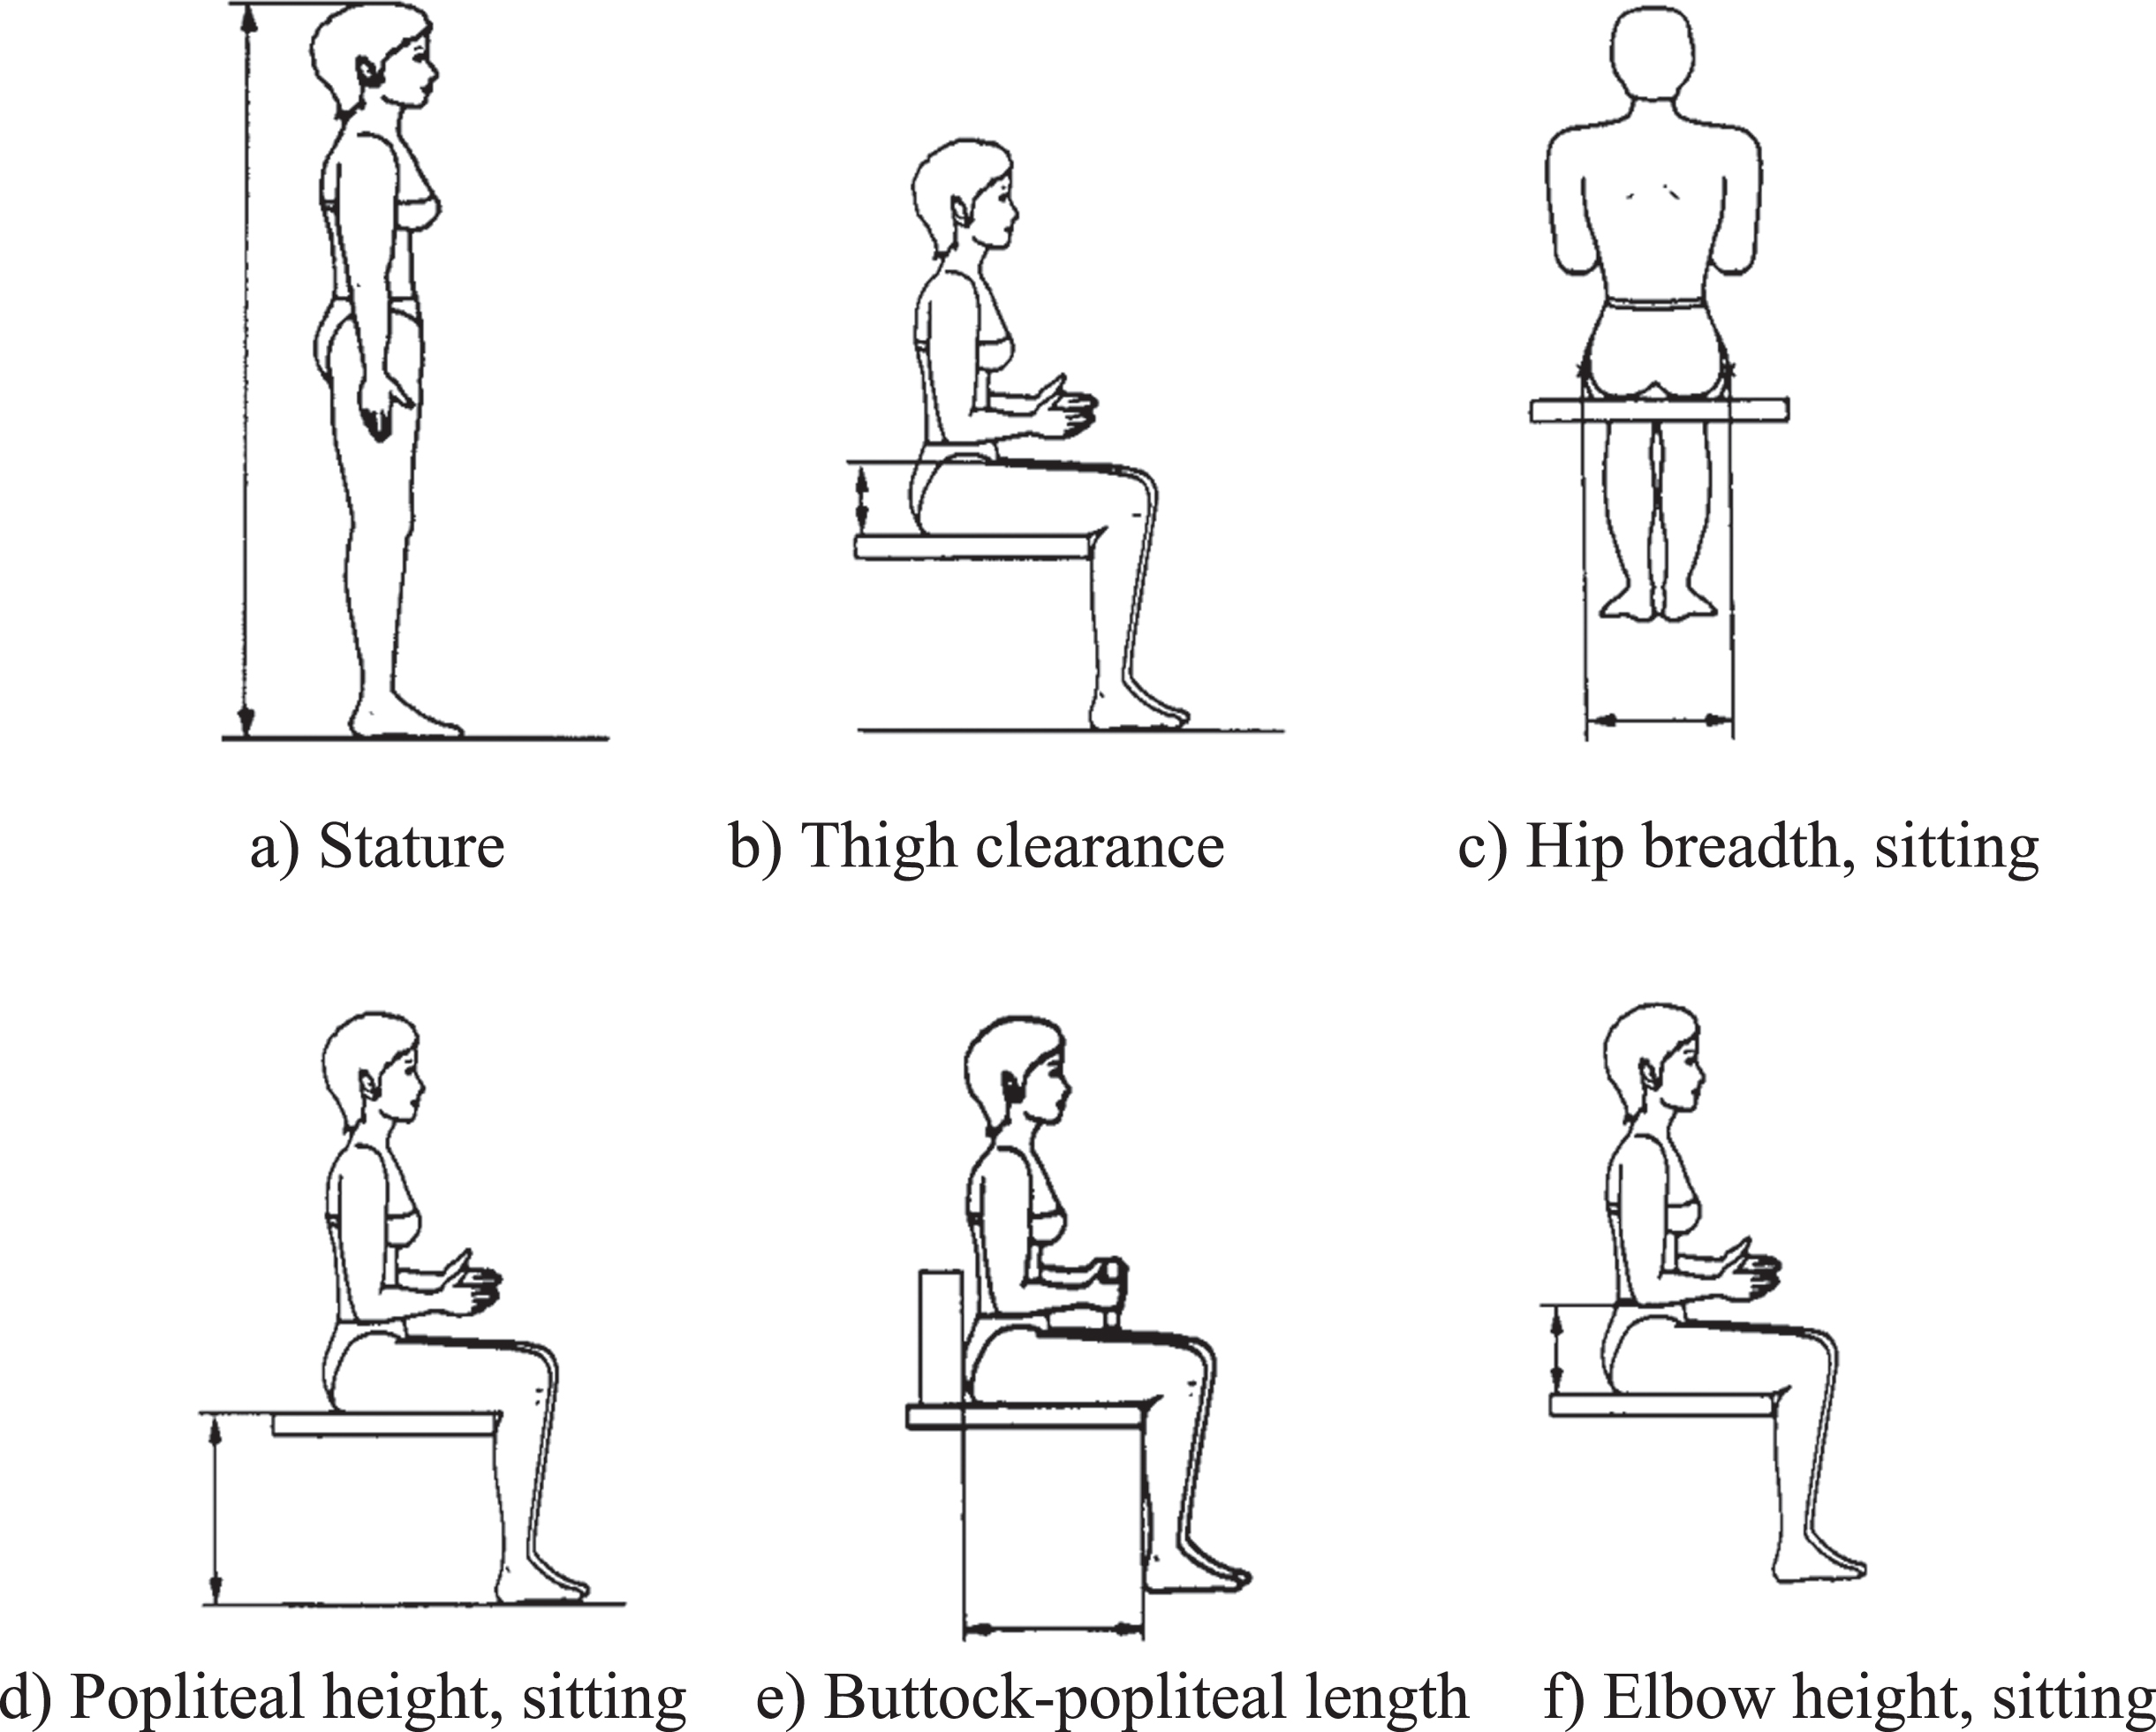
Anthropometric measures.
We use five relations between anthropometric and furniture measures, all of which are in line with the study of Castellucci et al. [14]. In a literature review by Castellucci et al. [42], they provided 21 mismatch equations and tests. We only describe the equations in the following parts and reader may refer to these two papers for details of the relations. In this paper, follow a similar methodology as in [43] and use their data for our numerical study.
Relation #1: Thigh clearance against seat-to-desk clearance
When seat-to-desk clearance is just equal to thigh clearance, whilst a student may fit, it would not be comfortable for them since their leg movement would be limited. Relation #1 defines that the seat-to-desk clearance should be at least 2 centimeters greater than the thigh clearance.
For ergonomic suitability, it is sufficient that the seat width is greater than the hip breadth, which is given in Relation #2.
Popliteal Height should be neither too short nor too long compared to the seat height, else it would result in compression in the buttock region. Relation #3 defines the range for seat height where ergonomically a student is most comfortable.
If the seat depth is too high, it will cause loss of backrest support, and if too low, the student’s thighs would not be sufficiently supported and the knees would tend to bend down. Relation #4 defines the range for seat depth where ergonomically a student is comfortable.
A student may place their elbows on the desk when the seat-to-desk height is equal to the elbow height whilst sitting, or may be greater to some extent, but their arms would not be able to rest on the desk if the seat-to-desk height was lower than their elbow height whilst seated. Relation #5 defines that the seat-to-desk height should be at least elbow height whilst sitting, and at most 5 centimeters greater.
Furniture measurements
Furniture measurements w.r.t. furniture types are given in Table 2.
Furniture measurements
Furniture measurements
Descriptive statistics of anthropometric measurements are given in Table 3.
Descriptive statistics of anthropometric measurements
Descriptive statistics of anthropometric measurements
More than half of the students expressed having not been comfortable sat with their legs inside the space between the desk and the chair. It is expected that with each increasing school grade (and therefore age), the mismatch rate would increase. Figure 4 shows almost the reverse of that, where the lowest mismatch is for Grade 8 and the highest is for Grade 6. The allocation of furniture types to students according to their grade explains this contrariety.
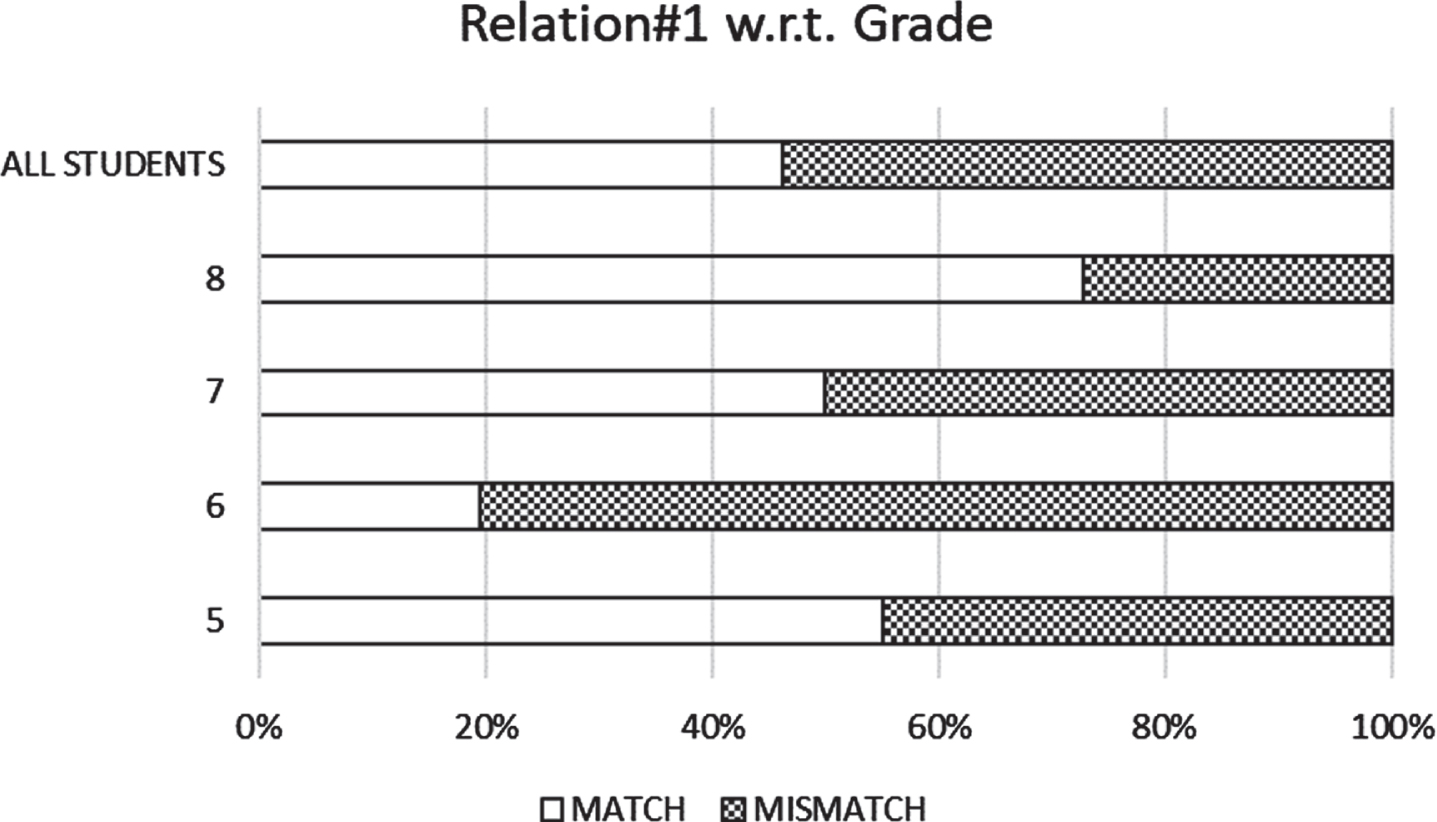
Mismatch rates of relation #1.
Naturally, the lower the seat-to-desk clearance, the higher the mismatch rate for Relation #1. From Table 2, it can be seen that D1C3 has the lowest SDC followed by D1C1. In Table 4, all D1C3 were used by Grade 6 students, whilst the other Grade 6 students used D1C1. On the other hand, the largest SDC-measured furniture, D2C2, was used by Grade 8 students. This caused a high level of mismatch for the Grade 6 students and a low mismatch rate for the Grade 8 students.
Furniture type allocation to grades
For a sufficiently large seat width, naturally Relation #2 does not show any mismatch. As can be seen in Fig. 5, the mismatch rate of Relation #2 was approximately 17%, which was the best among the five relations. The mismatch rate was the greatest for the Grade 5 students, although their hip breadth was the smallest w.r.t. their grade, as opposed to the expectation of Relation #1. Again the allocation of furniture types according to student grade explains this contrariety. All of the Grade 5 students used D1C1 (see Table 4), which has the smallest SW value.
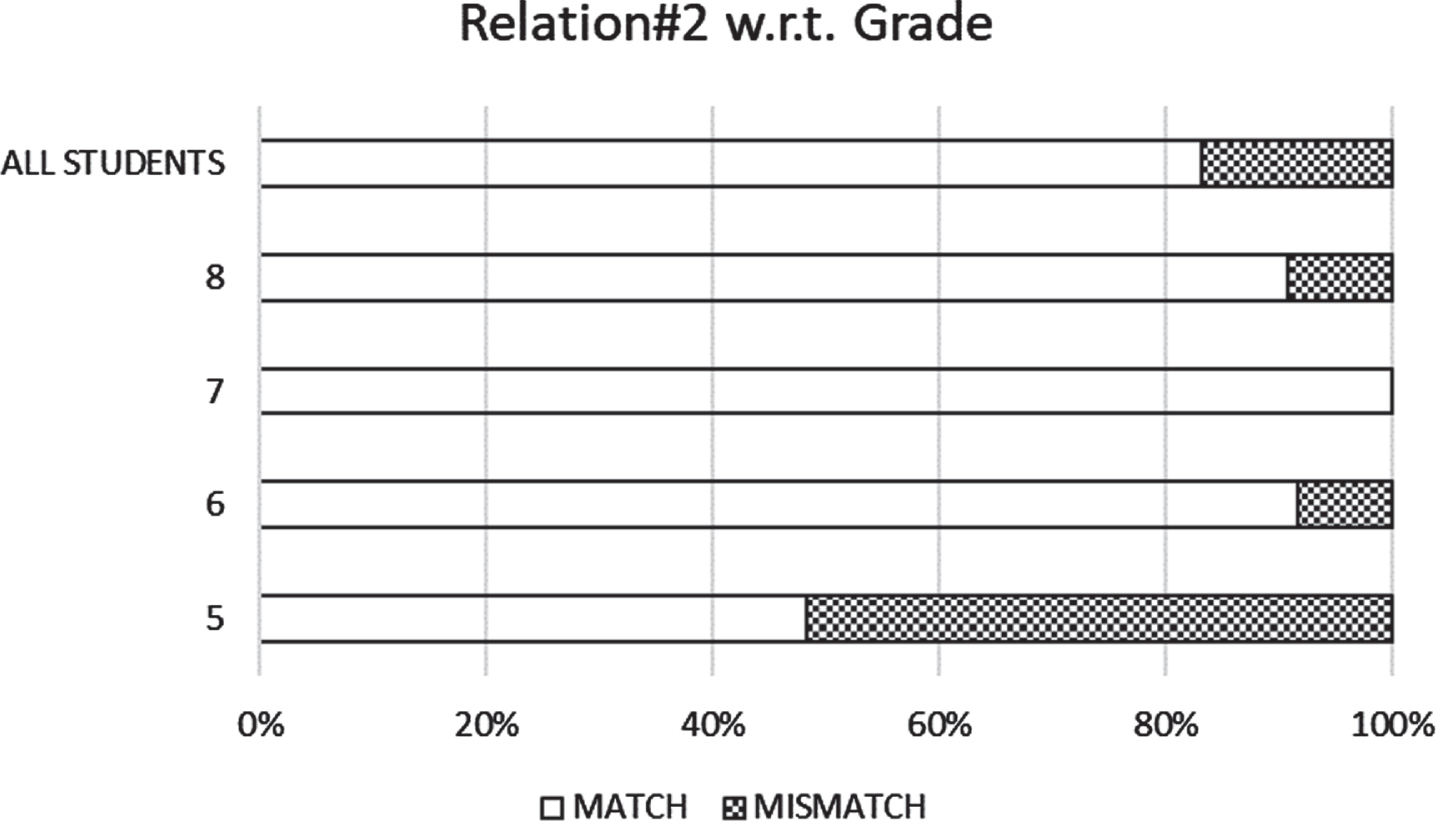
Mismatch rates of relation #2.
Relation #3 is a two-sided relation, where the left side and right side of the relation termed as lower-bound (LB) and upper-bound (UB), respectively. For example, LB defines the maximum value of popliteal height w.r.t. seat height; where, if PH≤SH / cos30° –3, then the student is deemed to be comfortable. Figure 6-a shows that LB does not indicate any mismatch, which means that the seat heights were sufficient for the students. For UB, the mismatch rate was found to be very high, as can be seen in Fig. 6-b. When there is a mismatch w.r.t. LB or UB for a student, it is counted in the overall mismatch rate. Since there was no mismatch w.r.t. LB, the overall mismatch rate was identical with the UB mismatch rate. Overall, the mismatch rate was 71.4%for all students, and the worst rate was for students in Grade 5, as seen in Fig. 6-c. naturally, fifth-grade students are smaller in stature, but they are generally given the lowest seat height desk and chair combination (D1C1), which results in the largest UB mismatch rate (and consequently largest overall mismatch rate).
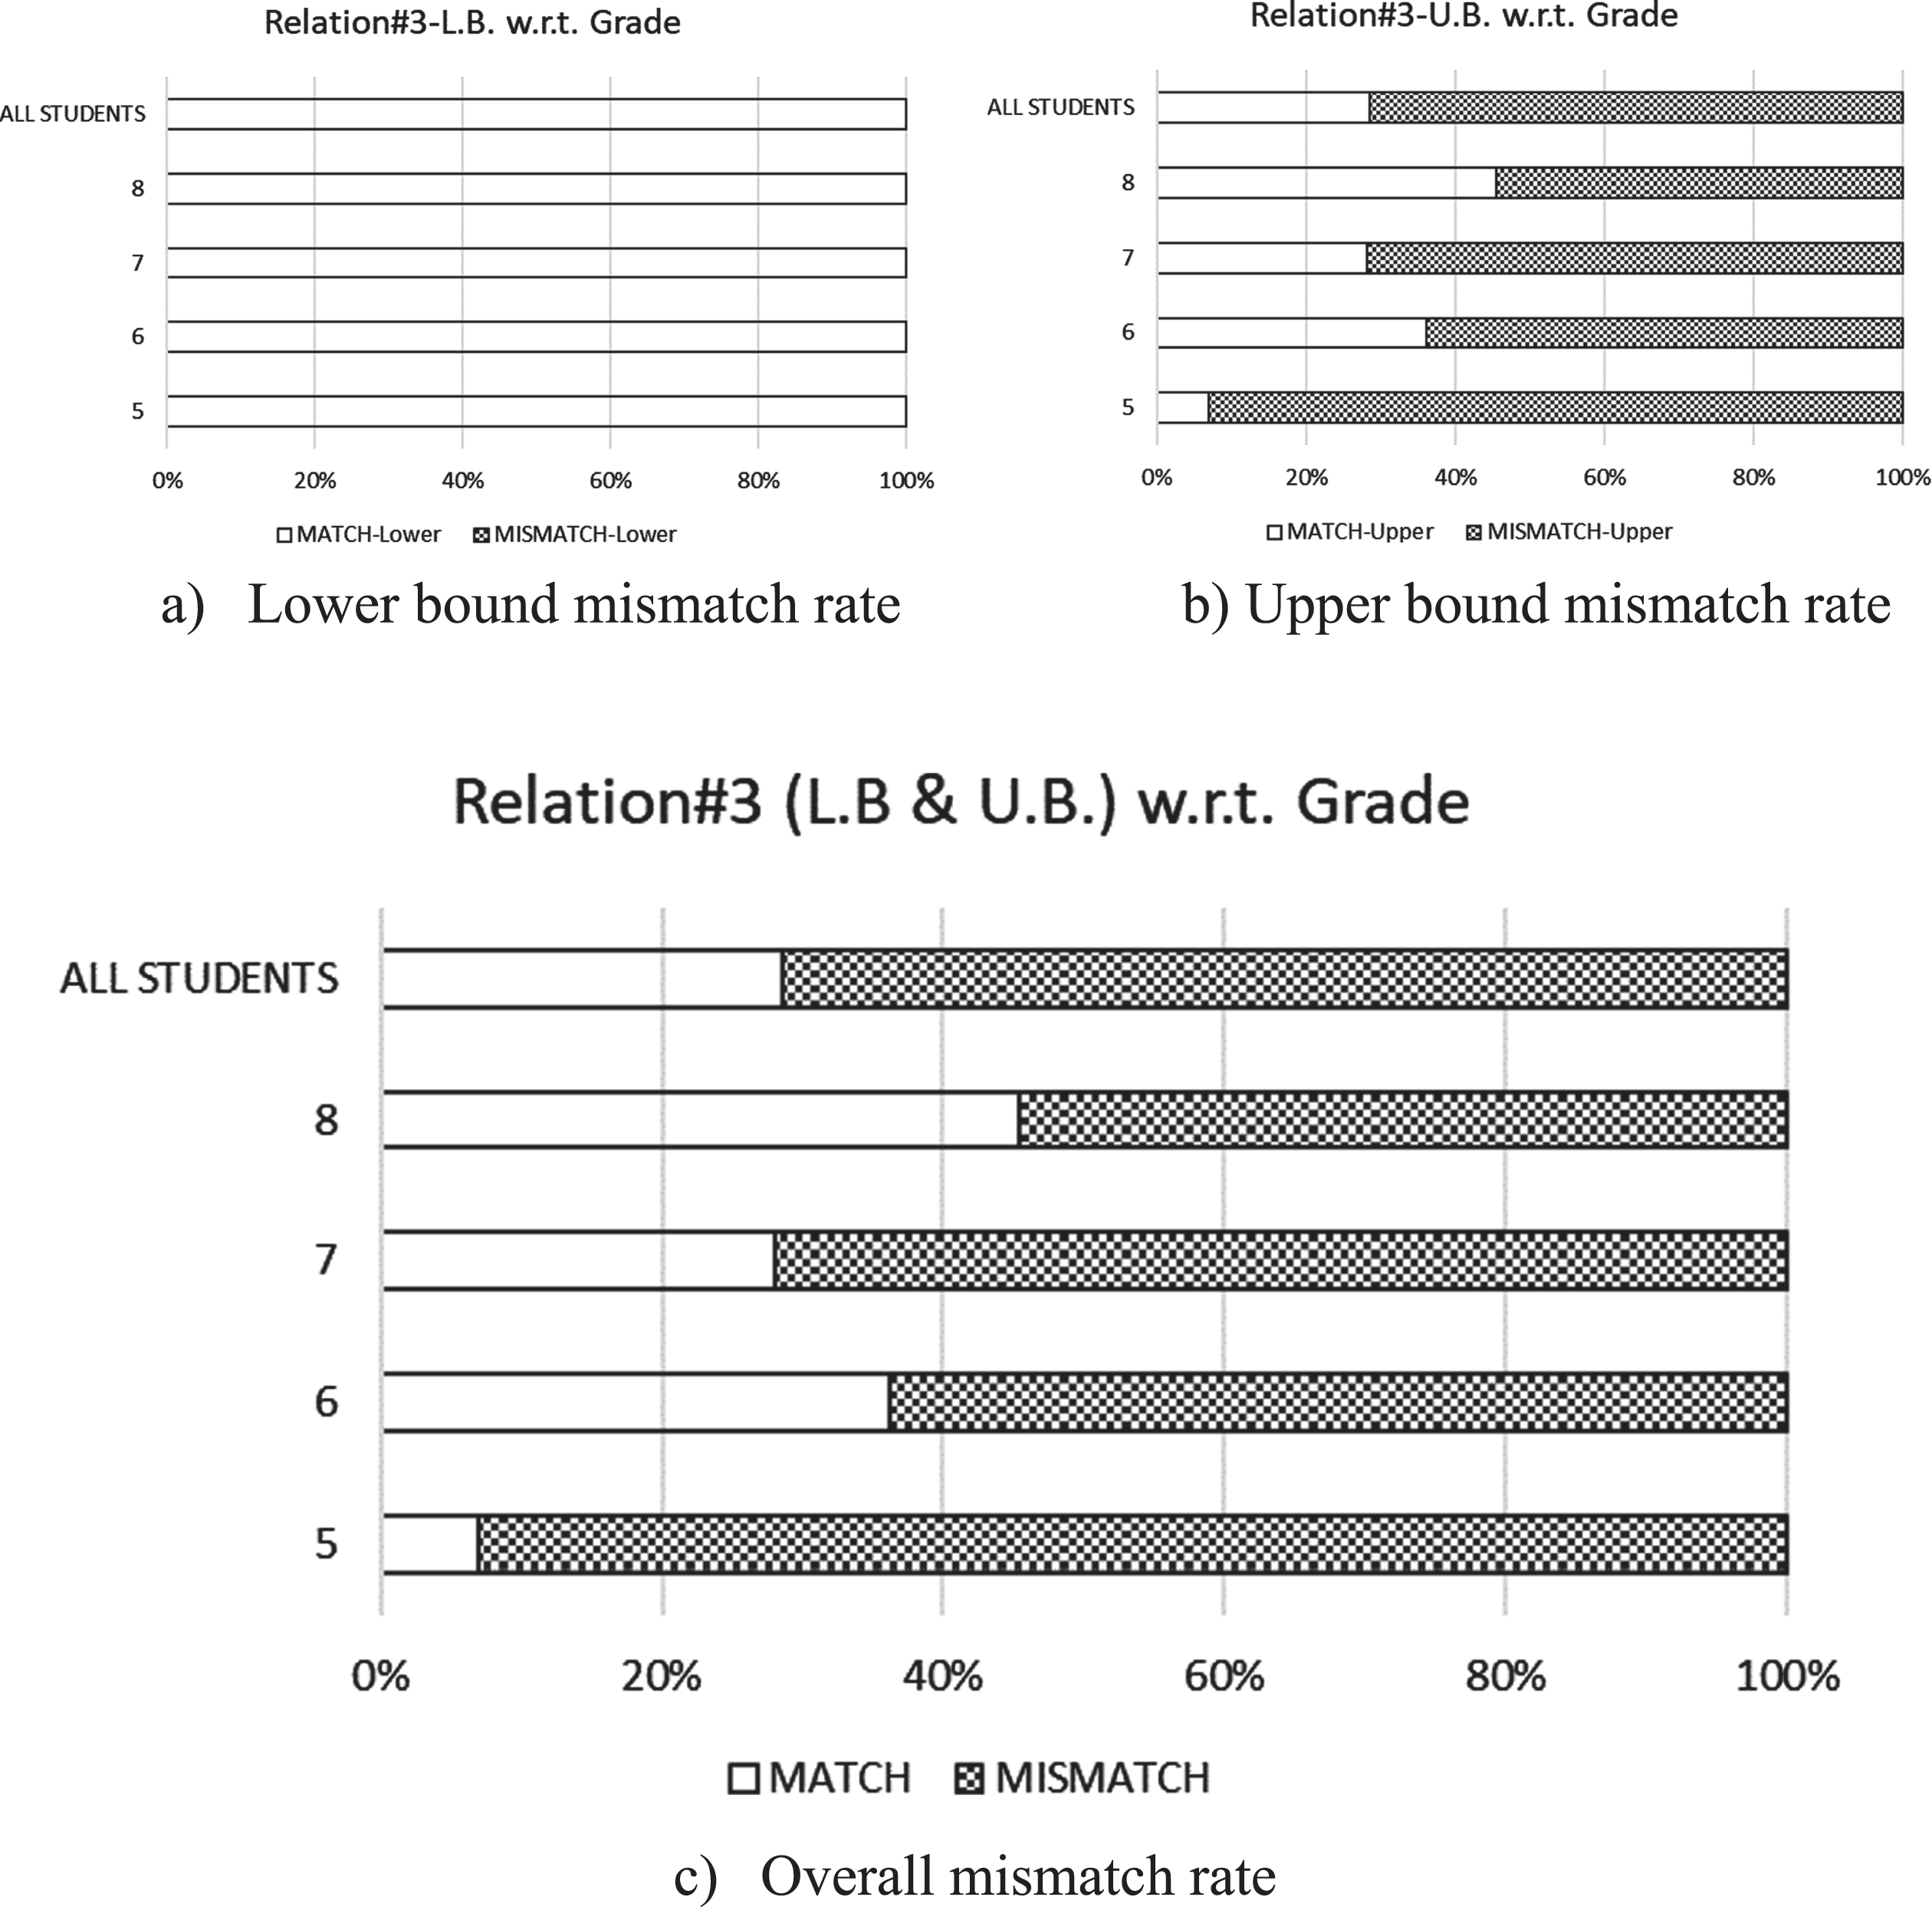
Mismatch rates of relation #3.
Relation #4 is also a two-sided equation, and which defines the maximum (SD / 0.80) and minimum (SD / 0.95) values for buttock-popliteal length w.r.t. seat depth. As can be seen in Fig. 7-a and Fig. 7-b, the mismatch rates were about half for both LB and UB, but the overall mismatch rate was extremely high (95.8%), as can be seen in Fig. 7-c. Considering the two extreme cases of Grade 5 and Grade 7. All of the fifth-grade students were given D1C1 desk and chair combination, which has the largest SD value, resulting in zero LB mismatch rate, but 100%UB mismatch rate. Just the opposite, all students in Grade 7 were given the D2C3 combination, which has the smallest SD value, resulting in zero UB mismatch rate but 100%LB mismatch rate. As a consequence, both Grade 5 and Grade 7 students have 100%overall mismatch rates.
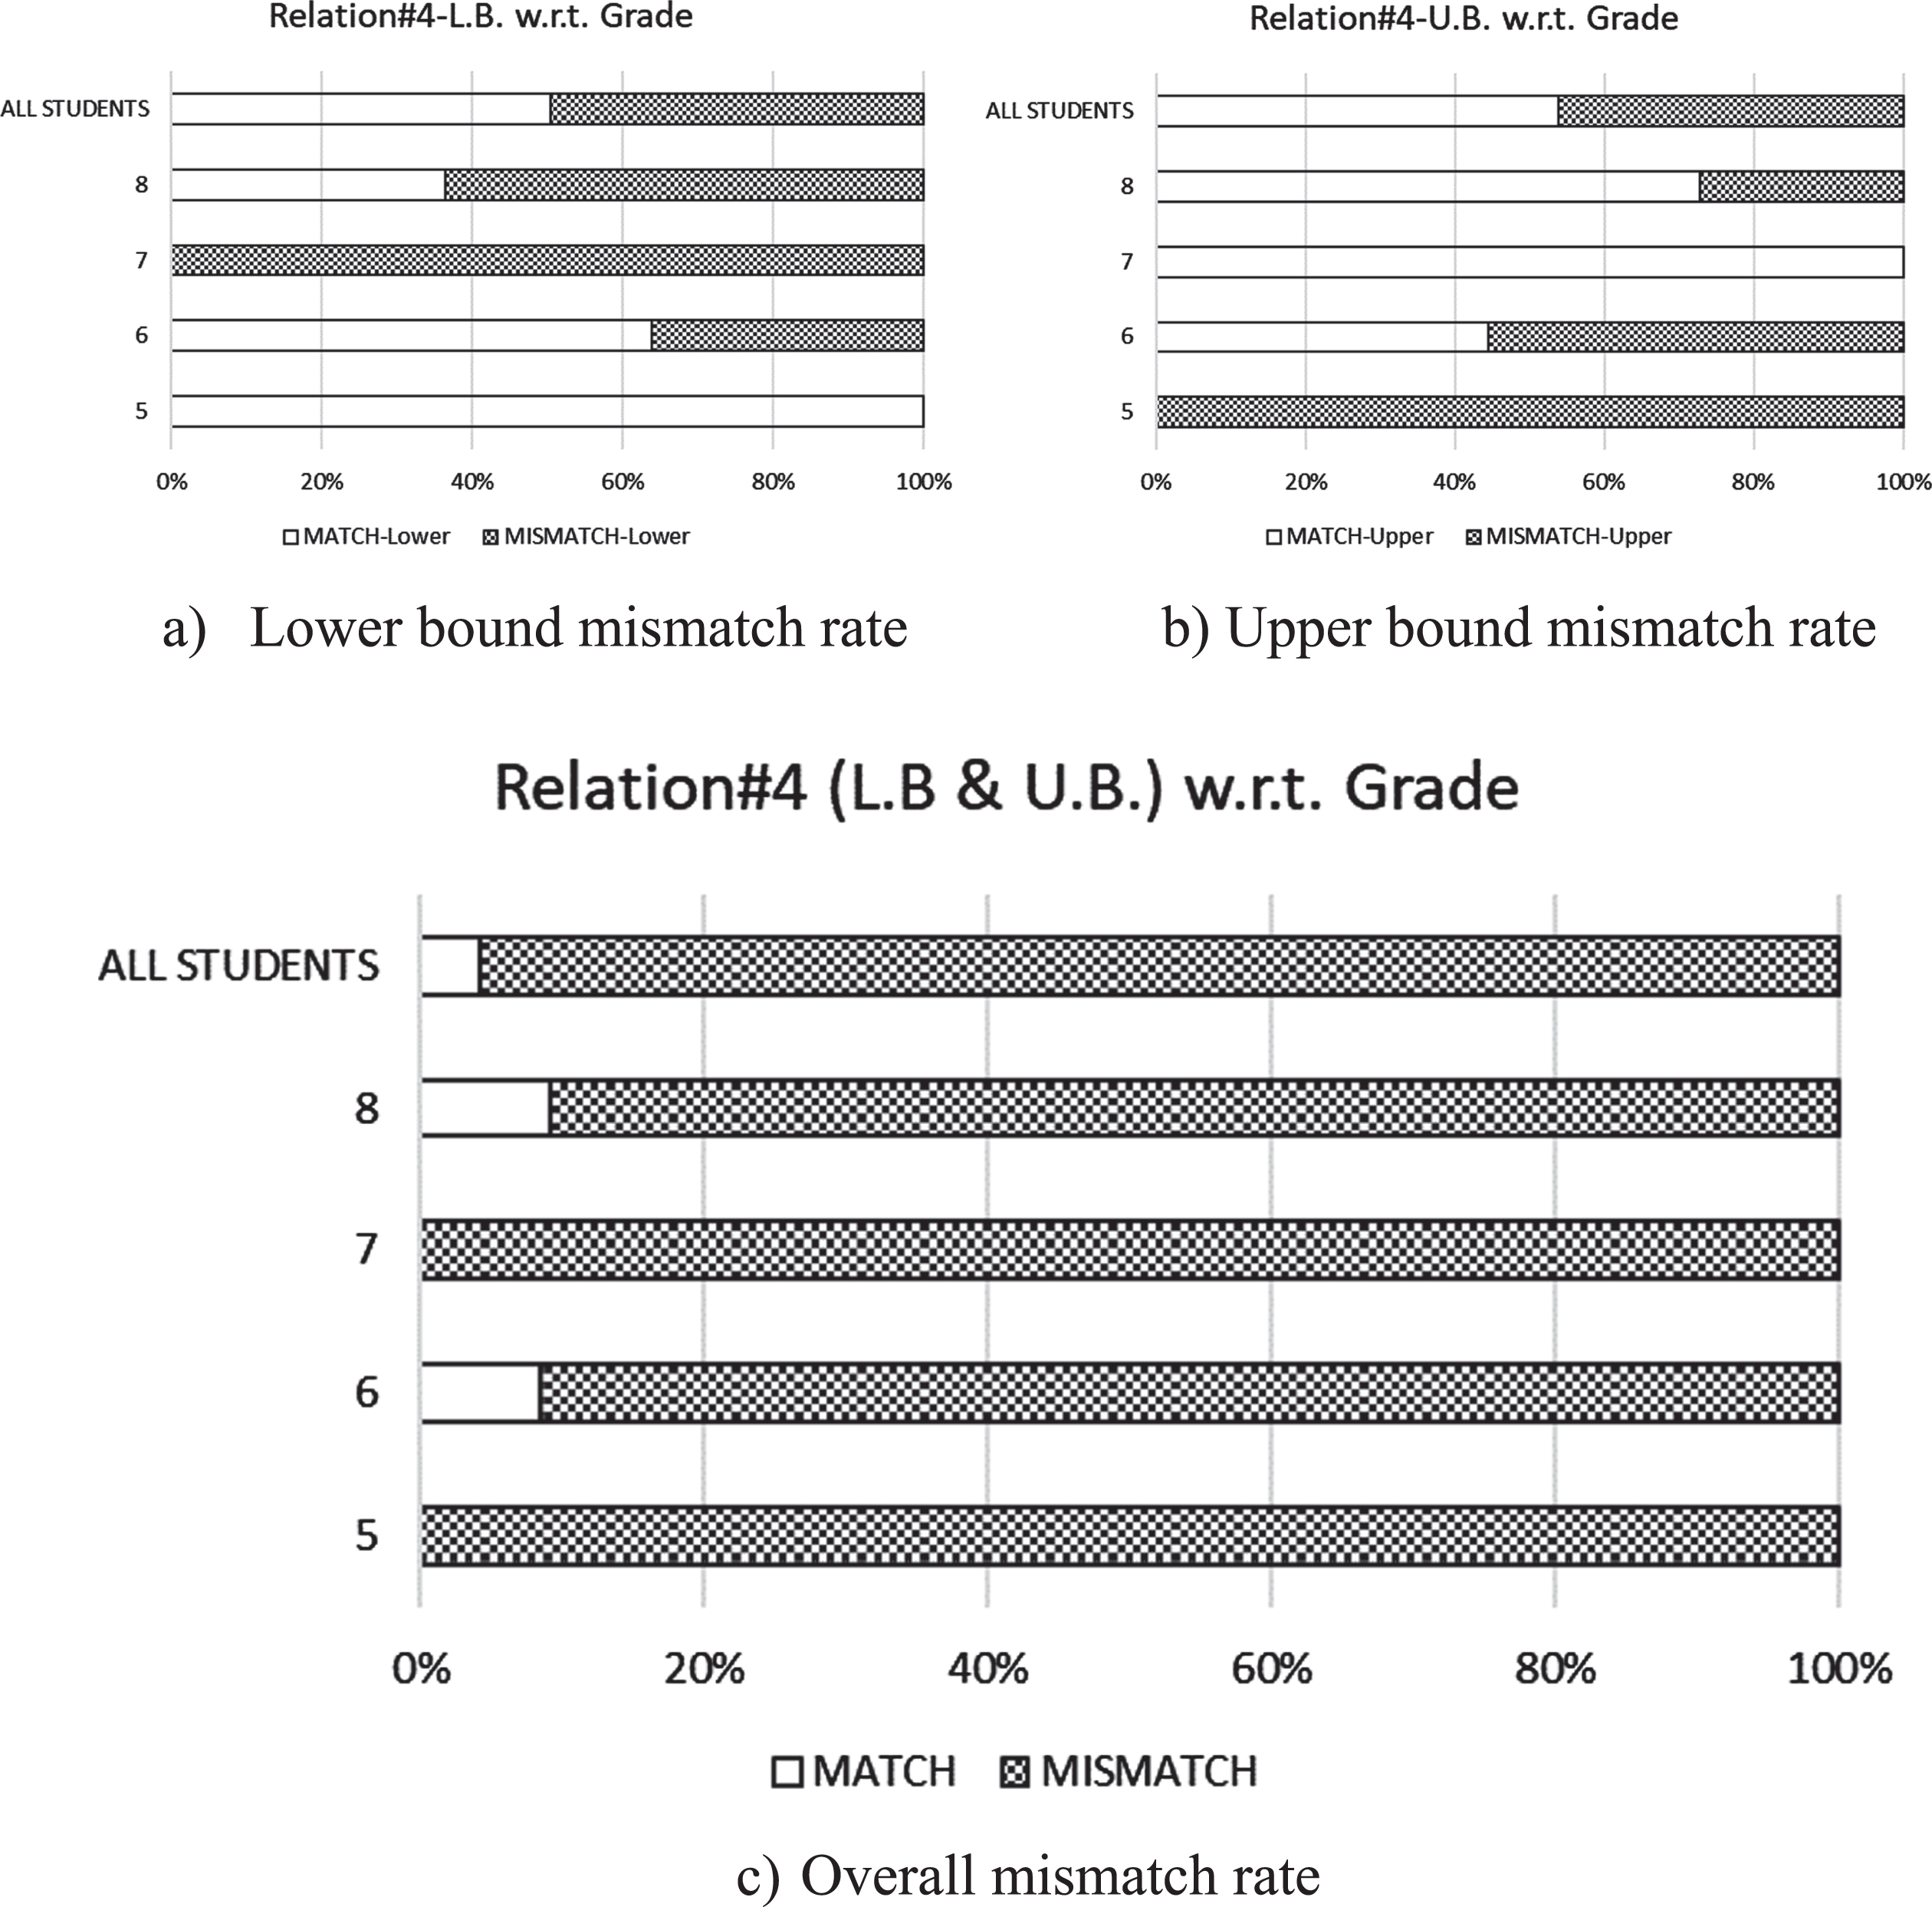
Mismatch rates of relation #4.
The LB of Relation #5 requires that the elbow height should be at most the seat-to-desk height, whilst the UB of Relation #5 requires that the elbow height should be at least 5 centimeters less than seat-to-desk height. As for Relation #3, the LB mismatch rate is zero and overall mismatch rate is defined by the UB mismatch rate (see Figs. 8-a, 8-b, and 8-c). For all grades, the UB mismatch rates were found to be extremely high, which portrays a serious design error for all desk and chair combinations in that the seat-to-desk heights are unnecessarily large.

Mismatch rates of relation #5.
The mismatch rates were found to very high for all relations, except for between hip breadth and seat width. Furniture with extreme measurements are being improperly allocated to student grades with extreme anthropometric measures, such as giving the smallest furniture to the largest student. Therefore, there is significant room to reduce the mismatch rates by reallocating furniture according to the students’ grades (or even further, to individual students). But what if we can redesign the furniture? What should be the correct dimensions? In order to answer this question, we must first analyze the probability distribution of anthropometric measures. We first checked Normal Distribution for the data since anthropometric measures are expected to obey this principle. The results are as presented in Table 5. As can be seen, except for thigh clearance, there is insufficient evidence to state that measures are not normally distributed according to a 5%level of significance.
Shapiro-Wilk normality test results of anthropometric measures
Shapiro-Wilk normality test results of anthropometric measures
For thigh clearance, we used natural logarithm transformation and checked ln (thigh clearance) for normal distribution. Table 6 shows that the natural logarithm of thigh clearance is normally distributed within 5%level of significance.
Shapiro-Wilk normality test results of natural logarithm of thigh clearance
Except for thigh clearance, the mean and standard deviation values presented in Table 3 are within the parameters of Normal Distribution for anthropometric measures. The natural logarithm of thigh clearance is normally distributed as ln(TC)∼N(2.63; 0.152).
Considering a student’s anthropometric measurement, which is a Random Variable, and denote it by X, then X is normally distributed with mean μ and variance σ2. If we consider a two-sided confidence interval (CI) with 1-α significance level, then CI is μ ± Z(1-α/2)
σ. Since we estimate μ by
In considering Relation #1 as TC < SDC-2, using natural logarithm on both sides gives ln(TC) < ln(SDC-2). Using ln(TC) ∼N(2.63; 0.152) in one-sided 95%CI
Calculations for Relation #2 are similar to Relation #1, but much more straightforward. Using Normal Distribution parameters of hip breadth, one-sided 95%CI becomes 33.3 + Z(0.95)4.4 and results in a 40.6 centimeters seat width. In the current study, 61 furniture sets (total number of all D1C3 and D2C3, which constitutes 51%of all the furniture) have larger SW values than 40.6 centimeters, since seat type three has no limit on seat width. As a result, the mismatch rate for Relation #2 is the smallest amongst all the relations.
The upper and lower sides of Relation #3 are considered separately. Considering the lower side as an equality, i.e., (PH + 3) cos30°=SH, seat height is 42.9 centimeters for the popliteal height of 46.5 centimeters. For this value, 97.5%of the students conformed to the lower side of Relation #3. In other words, 2.5%(i.e., α/ 2) of the students were found to violate the lower side of the relation and thereby cause a mismatch. For this value, 45.1%conformed to the upper side of the relation. Together, 54.9%upper side and 2.5%lower-side mismatch rate makes up the 57.4%total overall mismatch rate. Considering the upper side, 35.6 centimeters of seat height will result in α/ 2 = 2.5%of mismatch w.r.t. the upper side, but 76.8%of mismatch w.r.t. lower side, resulting in a 79.3%overall mismatch rate. Both values of seat height give considerably high mismatch rates. Considering the symmetric behavior of the Normal Distribution, the best value for seat height is 39.5 centimeters, giving a 19.9%overall mismatch rate with equal UB and LB mismatch rates. Note that the middle SH value (i.e., the average SH values for 2.5%mismatch rate found w.r.t. lower and upped sides) is 39.2 centimeters, which is close to but different to the aforementioned value. If the value SH = 39.2 were used, this would result in a 22.3%mismatch rate.
Design analysis for Relation #4 is again similar. Considering α/ 2 = 2.5%for upper and lower sides, seat depth was found to be 40.4 and 33.9 centimeters, respectively, with mismatch rates of 44.3%and 57.8%w.r.t. the upper and lower sides of the relation, respectively. With SD = 37.4 centimeters, the minimum overall mismatch rate equals 16.5%. Again, the middle SD value of 37.1 centimeters gives a higher overall mismatch rate (24.0%).
Following the same steps, seat-to-desk height values were found to be 24.8 and 19.6 centimeters, respectively (giving respective overall mismatch rates of 53.7%and 60.3%) for α/ 2 = 2.5%, but differently the middle SDH value of 22.2 centimeters gives the lowest mismatch rate of 16.7%. The reason is that, in Relation #3 and Relation #4, anthropometric measures are multiplied by constants, but in Relation #5, it is summed with a constant. Multiplication disrupts the symmetric behavior of the Normal Distribution w.r.t. the random variable, but addition does not.
Table 7 summarizes the suggestions for furniture dimensions and their effects on mismatch percentages. The improvements in mismatch percentages are quite significant.
Summary of Suggested Dimensions for Furniture Design
In this study, we analyzed the ergonomic suitability of classroom furniture to Turkish students in Grade 5 through to Grade 8, which covers an age range of 10 to 14 years old. For this purpose, we selected a school in the center of Ankara, Turkey’s capital city. We performed the analyses by using relations between furniture dimensions and the anthropometric measurements of students. Where a relation was violated for a specific student, we defined it as a mismatch and calculated mismatch rates for each relation. After obtaining the appropriate ethical approvals for the study, we took measurements of 119 volunteer participant students, once their families and the necessary legal authorities had also given the necessary permission.
Our study found high mismatch rates, just as had been the case for many other similar studies in the literature (e.g., [12, 35]). We found that the minimum mismatch percentage was 16.8%, where the next smallest rate was 53.8%and the average value was 66.6%. Relations for seat depth and seat-to-desk height were the most inferior, with more than 95%mismatch rates. The existing school furniture was clearly not suited to the students that were allocated to using it. The ergonomic effects of discomfort would be more significant considering that these children are at their peak growing age and negative health effects may affect them over their whole lifespan.
In terms of the furniture dimensions, Desk #1-Chair #3 was the worst combination for seat-to-desk clearance (as all 16 D1C3 were found to be incompatible), whilst Desk #1-Chair #1 was especially poor for Grade 6 students. Chair #1 was incompatible for about half of the Grade 5 students for seat width. The upper side of the relation for seat height caused a high instance of mismatch, indicating that about 75%of the Chair #3 and Chair #1 allocations were incompatible, where those two chair types together constituted 92%of all the students’ chairs. For seat depth, all of the Chair #1s were found to be incompatible for upper side, and almost all Chair #3s were incompatible at the lower side of the corresponding relation. Except for a few instances of the Desk #2-Chair #3 combination, all of the furniture was incompatible according to the relation of seat-to-desk height, and that the incompatibility was due to the upper side of the relation.
In the literature, adjustable furniture has been proposed as a solution by many studies, such as [35] and [37], but there have also been studies that have claimed that this was not necessarily true, such as [38] and [39]. Assuming a fixed-size furniture, i.e., furniture that is nonadjustable, we proposed furniture dimensions for decreasing the mismatch rates. For this purpose, we first assigned fit probability distributions to each anthropometric measure, and then found the corresponding furniture dimensions that minimized the probability of mismatch. Our proposed values were found to decrease the mismatch rates by 52.0%on average, with a maximum improvement of 78.3%(reducing the mismatch rate of 95.0%to 16.7%) for the relation between seat-to-desk height and elbow height when seated. The next largest improvement was for the relation having the other extreme mismatch rate, which was between seat depth and buttock-popliteal length, which resulted in a mismatch reduction of 71.8%.
The transition from ergonomically unsuitable classroom furniture to that which is deemed more suitable can be achieved in different ways. In terms of time, the immediate replacement of all furniture with more ergonomically suitable items, or waiting for the end-of-lifetime of the current furniture and replacing it with ergonomically suitable items are two extreme methods; and would only be viable where cost and ergonomic benefits were the highest priority in the first option and lowest in the second. In terms of type, when replacing the furniture on an immediate basis, at the end-of-lifetime, or at any other time, adjustable or fixed-size furniture might be chosen, where the former is more costly compared to the latter. Using adjustable furniture may help to reduce the mismatch rates, provided that both students and educators receive adequate training, and that the adjustments are correctly applied. However, the realization of this option seems unlikely for public schools since they are not expected to be able to fund the acquisition of adjustable furniture. Even with our suggested fixed-size furniture dimensions, significant improvements might be attained in ergonomic suitability without the need to procure more expensive adjustable furniture.
Limiting the option to fixed-size new furniture, especially for public schools, the question that rem-ains to be answered is the timing of the replacement. In any case, the results from our study, as well as that of other researches, are best applied in the procurement of furniture, or even further back in the process, during the manufacturers design and production stages. In order to make our recommendations and results more available for educators and those administering education systems, we shared our study and discussed its findings with the directorate of Maltepe Primary Education School, as well as with those responsible at the Turkish Ministry of National Education, in the hope of increasing awareness with regards to the importance of ergonomic classroom furniture. The school directorate could benefit from our results and recommendations at the next renewal of their school furniture, or perhaps they may request furniture renewal funding from the Turkish Ministry of National Education in order to realize immediate ergonomic improvements, or to start a nongovernmental initiative to fund furniture renewal, or perhaps to come up with some other solution. Such attempts would have a local effect, however, whereas to improve the awareness of those responsible at the Turkish Ministry of National Education could result in a national effect, affecting all public schools (which constitute more than 90%of all middle schools in Turkey) directly and private schools indirectly. The Turkish Ministry of National Education would also be expected to benefit from our results and recommendations in applying improvements to the school furniture procurement process, and by imposing ergonomic suitability constraints on furniture alternatives or through collaboration with school furniture manufacturers at the design and production phases.
There are, however, a number of limitations to be considered to the current study, which we assess under two groups. The first is sample-related. In our study, we used a sample of convenience, where the participating students were not randomly selected, but those students whose parents approved their participation. Selecting the sample from just one school was another limitation; however, the location and large size of the Maltepe Primary Education School was considered to alleviate this limitation to some extent. Although we performed anthropometric measurements with all of the students for whom parental permission was granted, our sample size could be said to be small, which may be another limitation. Lastly, the sample constitutes an unequal distribution of students w.r.t. age, gender and grade.
The second group of limitations is measurement-related. Some degree of measurement error is inev-itable in any measuring exercise, even for school furniture, and becomes more significant when making anthropometric measurements since students represent an additional source of measurement bias [44]. Additionally, we undertook the anthropometric measurements with the participant students being fully-clothed, for ethical considerations, and the varying attire of the students may have affected the accuracy of the measurements. Another factor to consider is the time of day at which the measurements took place. During the morning hours, the students are naturally fresher and their postures more correct and up-right, which generally deteriorates as the day progresses due to tiredness during the afternoon hours. Our measurements were taken at different times of the day, and getting students to remain still at the correct posture became harder the nearer it was to the end of the school day. One of the authors of this paper performed all the measurements after receiving appropriate training, which we believe helped to improve the precision of the measurements taken.
Our current study is data-dependent and due to ethnic, racial, geographic, demographic, etc. factors, generalization of our results to another population would not be feasible or correct. Instead, all the analyses would need to be refreshed for any other population. For example, Cotton et al. [3] found that even within the same country, ethnicity can have a significant effect on the ergonomic matching of school furniture to students. Our study’s results cannot be generalized to the same age range for a different population for these reasons, but the physical size of the students (stature and weight values) might be used for the purposes of generalization to some extent. Wutthisrisatienkul and Puttapanom [45] collected the exact same anthropometric measures as ours, plus one additional measure (shoulder height when seated), from 349 Thai students in Grades 10 to 12, and used the data of 20 randomly-selected students in a simple linear regression in order to obtain anthropometric measurement values over stature and weight. They showed high adjusted coefficient of determination values (between 80.3%and 92.7%) for regressions, and mismatch ratios of school furniture using regression results that differed by 8%or less compared to the use of actual anthropometric measurements. Consequently, using only stature and weight data, a mismatch analysis for school furniture can be performed so as to avoid the difficulties, time-consumption, and expense of anthropometric measurement collection. The COVID-19 pandemic also brought about additional challenges in obtaining anthropometric measurements due to the public health considerations of close-quarter interaction during measurements. For a population having similar stature and weight values/distribution to our measurements, we might have expected similar mismatch ratios by Wutthisrisatienkul and Puttapanom [45], and therefore our results could perhaps be generalizable to some extent, but this should be done cautiously since ethnic, racial, geographic, demographic, and other factors may also affect the quality of regressions of anthropometric values. Additionally, if detailed measurements are not possible for a certain population, using stature and weight measurements with the regression approach of Wutthisrisatienkul and Puttapanom [45], one can replicate our current study’s analyses for regressed anthropometric measurements.
In summary, increasing the sample size and considering all the factors that may affect the anthropometric measurements, and then repeating our analyses would be a possible extension to our current study, but this seems unlikely in this COVID-19 pandemic period. This extension is considered of significant importance if a national policy may then be developed for school furniture by the Turkish Ministry of National Education.
Footnotes
Acknowledgments
The authors would like to thank the Education Directorate of Çankaya District of the Ministry of National Education, Maltepe Primary Education School Directorate and the students who participated in the anthropometric measurements, as well as their parents.
Conflict of interest
None of the authors have any conflicts of interest to report.