



Abstract
BACKGROUND:
In agricultural farming operations, the incompatibility between operators’ physical capability and labor demands in the operation of tools and equipment results in a decreased performance, productivity, and safety related measures.
OBJECTIVE:
The aim of this study was to collect a biomechanical database of push/pull strengths for initiating the development of a human-centered design of equipment that is not available for the intended user group, i.e. Nagaland.
METHODS:
The sample consisted of 399 male and 271 female agricultural workers from the five districts of Nagaland, aged 18 to 65 years, classified into three age groups. In the process of push and pull force measurements, the elbow angle of the participants were set to 30–120°, 120–130°, and 130–180°. All tests were performed in triplicates with a resting period of two minutes between every consequent recording.
RESULTS:
The results showed that isometric push and pull strength values (Mean±SD) for males were 18.91±4.67 kg and 17.98±3.97 kg respectively and 13.07±4.06 kg and 11.98±3.33 kg for females respectively. The results of independent samples from student’s t-test demonstrate that there was a substantial variance in the isometric push and pull strength values (p < 0.05) between the genders across the various age spectrum.
CONCLUSIONS:
With ageing, muscular strength for push-pull strength in males and females reduce. The study reports that the recommended value of male and female isometric push-pull strength for agricultural workers of Nagaland should be 5th percentile of female data i.e. 6.40 and 1.71 kg respectively.
Introduction
Agriculture is the cornerstone of the Indian economy. It shapes the socio-economic circle of the entire country. The Indian agriculture environment is a wide-ranging sector with the stakeholders spread in all corners of the country [1]. Manual materials handling (MMH) tasks are very common both at work and in private activities [2]. However, with a very large and varied demography, one of the limiting factors regarding safety and increased yield is the unavailability of properly designed agricultural tools and equipment for the country’s diverse population. Consequently, various workers have reported that understanding the relationship between the workers’ capabilities and the force required for operating the tools is vital for improving comfort, performance, safety, and productivity [3–6]. Therefore, for the production of small hand-tools and equipment, human factor engineers/ergonomists must first rely on measuring the anthropometric and muscular stre-ngth data [7]. Static muscular force measurement is isometric [8]. Maximum values of push/pull data can be used for workstations improvement and push/pull tools design in production and service industries [9]. One of the convenient means of collecting push and pull strengths data is through isometric force measurement [10–14]. This mode of measurement is preferred as a standard owing to its short testing duration, economic cost and test replication [8, 16]. Badi and Boushaala [17] report that pulling at shoulder height recorded the highest isometric strength (Mean = 27.34 kg, SD = 7.61 kg) while they observed lowest isometric strength pulling at elbow height (Mean = 14.99 kg, SD = 2.98 kg). Therefore, engineering and validating the original formalism of human limb force capabilities can be critical in the field of ergonomics and rehabilitation [18]. Argubi-Wollesen et al. [19] observed that the ideal handle positions were recorded at the hip to shoulder height. Work knowledge and subsequent operations were found to be vital in reducing the strain. To negate disorders of the upper section of the musculoskeletal system in the agricultural workers, caused by excess taxing of the muscles during different operations of tools and equipment, it is vital to understand the static musculoskeletal loads [20]. He also reports that the agricultural production systems in the mountainous region of the northeast region (NER) of the country vary significantly from the type of farming operations in the mainland in terms of farm holdings given the hilly terrain of NER. Cale-Benzoor et al. [21] reports on the need for a proper understanding of work capacity for efficient and safe workstation design. Owing to the lack of a proper assessment of the strength data of the Nagaland population, this survey on the push and pull strength measurement was conducted in the selected sample sites. Different age groups, < 30, 30–40 and > 40, were also selected, keeping in view the relationship between age-related decline in handgrip strength (HGS) and potential future disability [22, 23].
Methods
Selection of study area
The five districts selected in the state of Nagaland for the study were Mokokchung, Dimapur, Kohima, Zunhebhoto and Wokha, respectively, where farming is practiced intensively. From each of the selected districts, five villages were chosen to determine the isometric strength of the farmers.
Selection of subject
To obtain a good correlation, a sample of 670 participants were selected (r > 0.8) with 90%and 95%power and significance level, respectively [24]. All the selected participants (399 males and 271 females) were from the five districts of Nagaland, all between 18 and 65 years. In every village, the information regarding the testing stations was dispatched via the Village Council members. All able agricultural workers willing to participate were then asked to gather at the testing station. A minimum of 20 participants comprising of both genders was requested to participate. Before commencing the test, a consent form and a self-responding short questionnaire related to previous history of any neurological disorder, inflammatory joint diseases, injury to upper limb etc. which would significantly affect hand strength were collected for inclusion/exclusion criteria to ensure that only healthy and fully-abled workers could participate. The experiment was performed on a horizontal plane where the surface was dry and rough, for better friction to avoid slipping during the strength data collection process. On obtaining consent from both the Village Council members and the selected participants for the test, the procedure was described in detail before the onset of the experiment. They were also encouraged to adjust the postures that enabled them to apply maximum force. Participants stood erect, having both feet flat on the floor with the shoulder and forearm straight and relaxed, the wrist without extension and ulnar deviation.
The elbow angle was set to 30–120°, 120–130° and 130–180 for push force, and 30–120°, 120–140° and 140–180° for pull force. Three replications were performed and the subjects were instructed to apply maximum pressure and maintain the pressure for at least 3 seconds after which the score was recorded for each arm angle as mentioned above. Participants were encouraged verbally during the experiment so as to inspire them to apply their maximum force. All tests were performed in triplicates. Every two consequent recordings were intervened by a 2-min rest; while the height of the experimental setup was adjusted as per the requirement of the participants. They were also given a supplementary resting period if requested or appeared worn out. The results were recorded in kg. The maximum of all three values were noted for each instance and used for analysis.
Instrument
Conceptualization
Based on the available information and research inputs gathered, various ideas were hypothesized to explore possible means to measure isometric push-pull strength. Thus, the objectives of the isometric muscular strength measurement in standing posture came up with several tactics to satisfy the parametric requirements. Several sketches explored the concepts/possibilities for product outlook, working principle, manufacturing and assembling feasibilities. Some of the competent thoughts for the pro-posed isometric vertical force measuring device were depicted in Fig. 1.

Schematic diagram of some final concepts for isometric push-pull strength measuring device.
Conceptualizing any device prototype needs consideration of several multidimensional inputs. In addition to the factors like versatility, safety, comfort, use-reuse flexibility, system calibration, accuracy and cost, the feasibility of manufacturing with locally available resources also behold pronounced importance. Taking this into consideration, a push and pull force measuring device was hypothesized to meet the possible needs of every user. The ‘mechanical design’ option in CATIA Software (V R5 17) was used to create a 3D CAD model of hypothesized device as shown in Fig. 2. The push-pull force measuring device comprised of a handle attached with grip at both ends for ease of hand gripping, a base frame to support vertical posts, a middle frame/rod attached for application of force during the experiment. The load cell was bolted between the frame/rod and the vertex of the mainframe. The base frame was thrilled at the edges which can be appended in the ground through nails for the stability of the device. A due effort was put to make the Isometric push and pull force measuring device compact and portable.
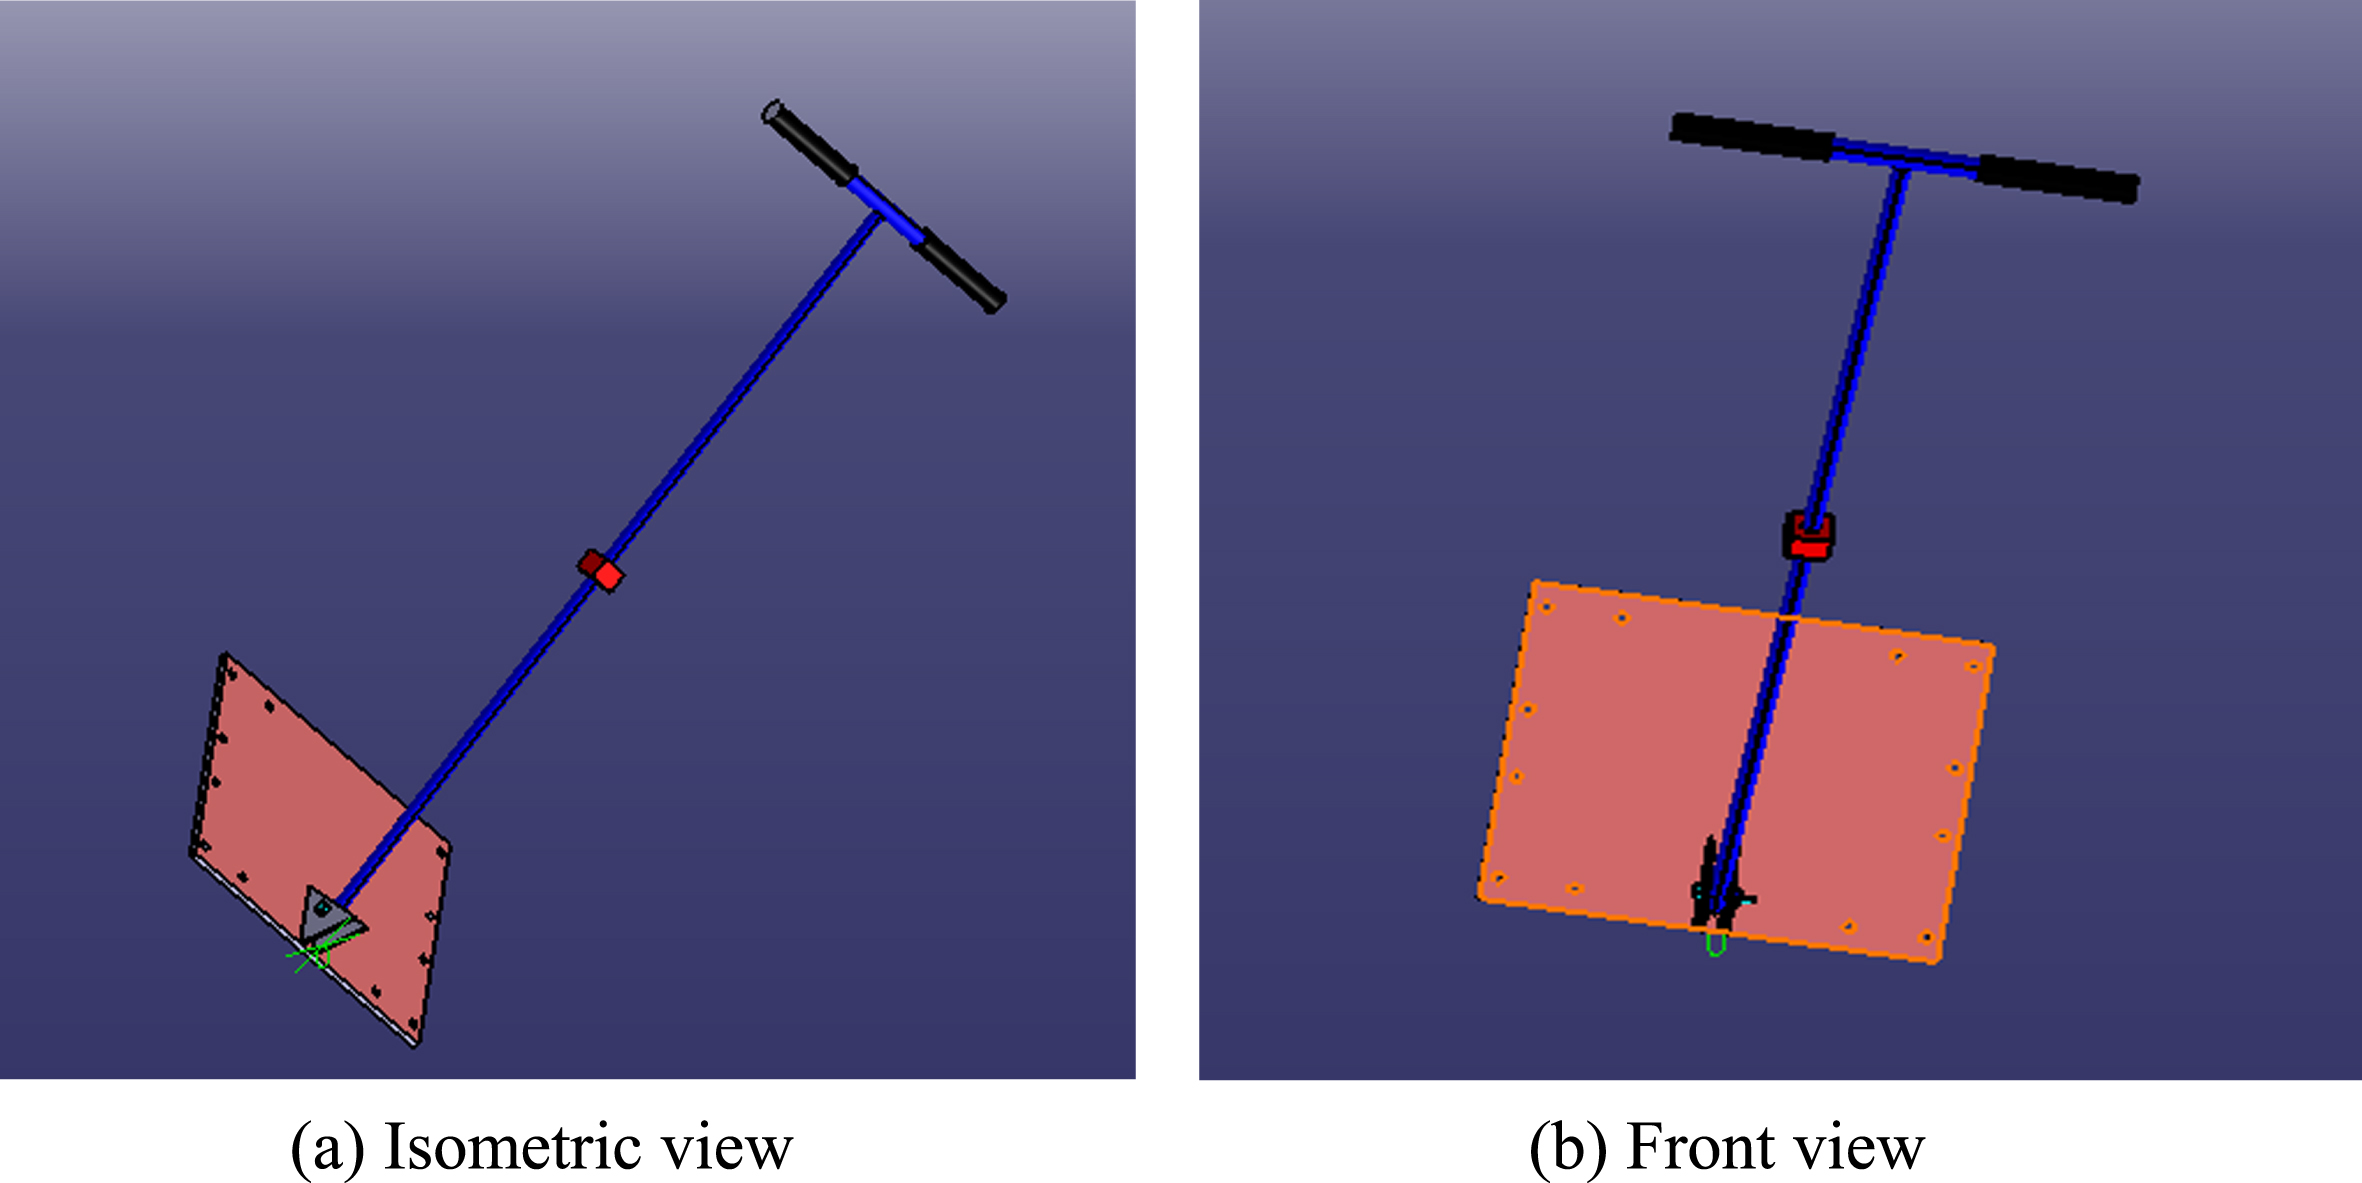
Isometric vertical push-pull force measuring device: A 3D CAD model.
Isometric strength measurement device to measure the maximum Push and pull force of the subject was developed in the North Eastern Regional Institute of Science and Technology. The instrument was designed in the form of a screw arrangement to provide ease in carrying in the field and while traveling to collect data from villages. Axial compensated load cell capacity of 125 kg is attached between the joints of a GI pipe 12 mm diameter, linked to a horizontal handle of 450 mm and provided with a digital display for displaying the readings in kg. The total length of the handle is 1160 mm, with a diameter of the handle as 12 mm along with a metal plate of 450×350 mm weighing 12.5 kg and thrilled on the edges which can be bolted to the ground through nails to give support and to make the set up more stable, while the tip of the handle was made in such a way that the arrangements can be varied with the help of screw joint mechanism.
Push-pull isometric force measurement
The participants were instructed to perform a two-handed push and pull force on a horizontal handlebar attached to a rod fabricated in a ramp arrangement which can be adjusted according to their height requirements until they felt that they had applied the maximum force. They were instructed to apply their maximum force towards the plane while holding the handlebar consistently. Physically demanding tasks involving static muscular contractions can be accessed via Maximum endurance time (MET) [25]. According to the procedure for strength data collection, the participants were tasked to reach their maximum strength within the first two seconds and then maintain it for the following three seconds [26]. The participants were instructed to release the handle gently, as fatigability of the local muscle determines the antifatigue capacity and influences the risk of injury of the workers [27] and hence, indications to cease were given through verbal communication after 5 seconds.
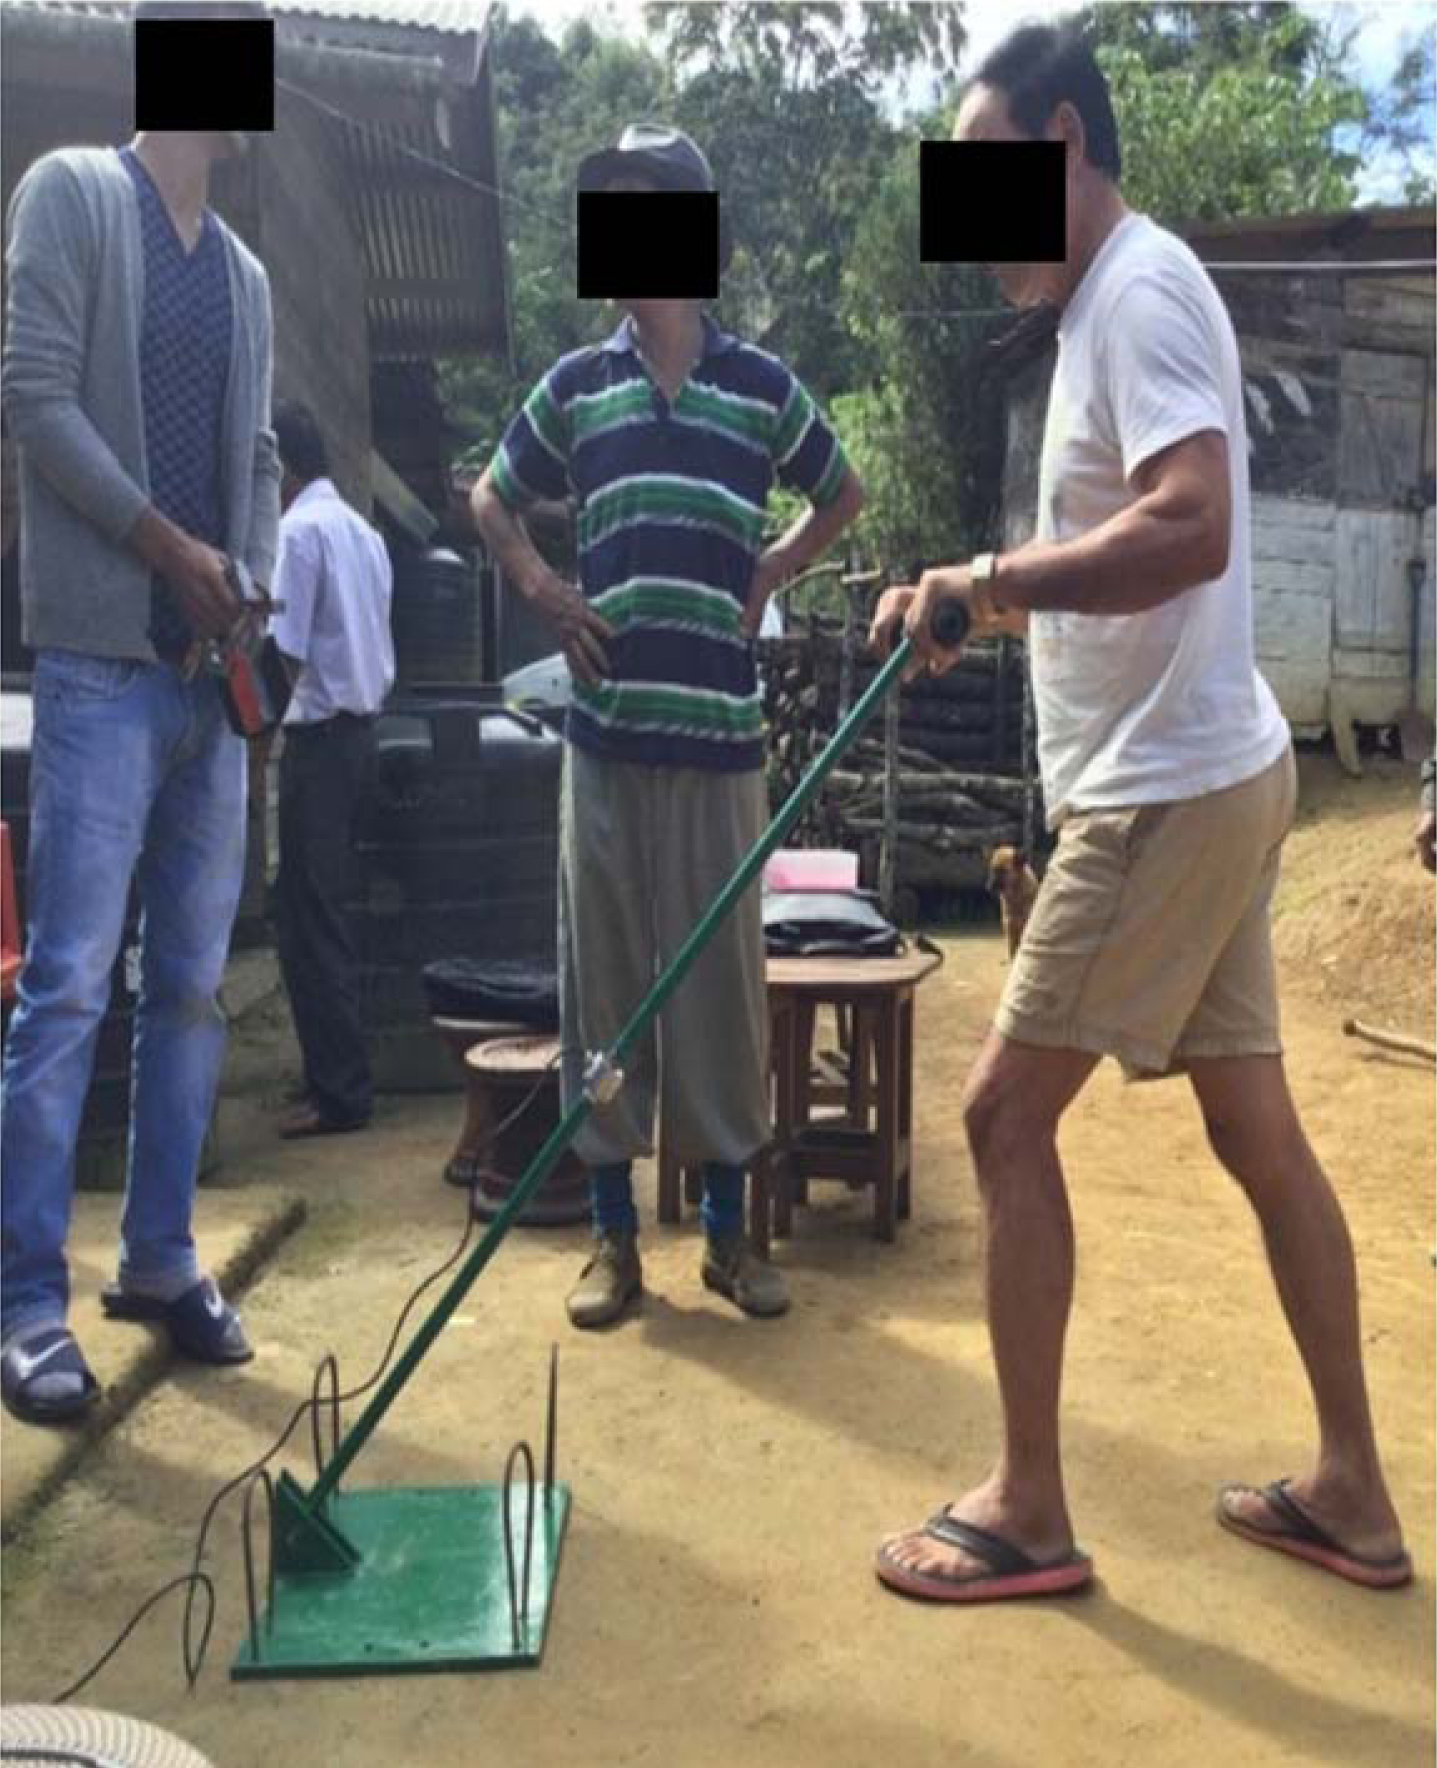
On-site determination of push force.
They were tasked to complete all maximum strengths experiments, which consisted of push and pull tasks, exertion height and horizontal distance with two hands naturally while keeping their balance in check. Throughout the experiment, the subject’s feet were permitted to be placed apart; that is, one foot in front of the other. They were also encouraged to adjust their postures which they believed would enable them to apply the maximum force.
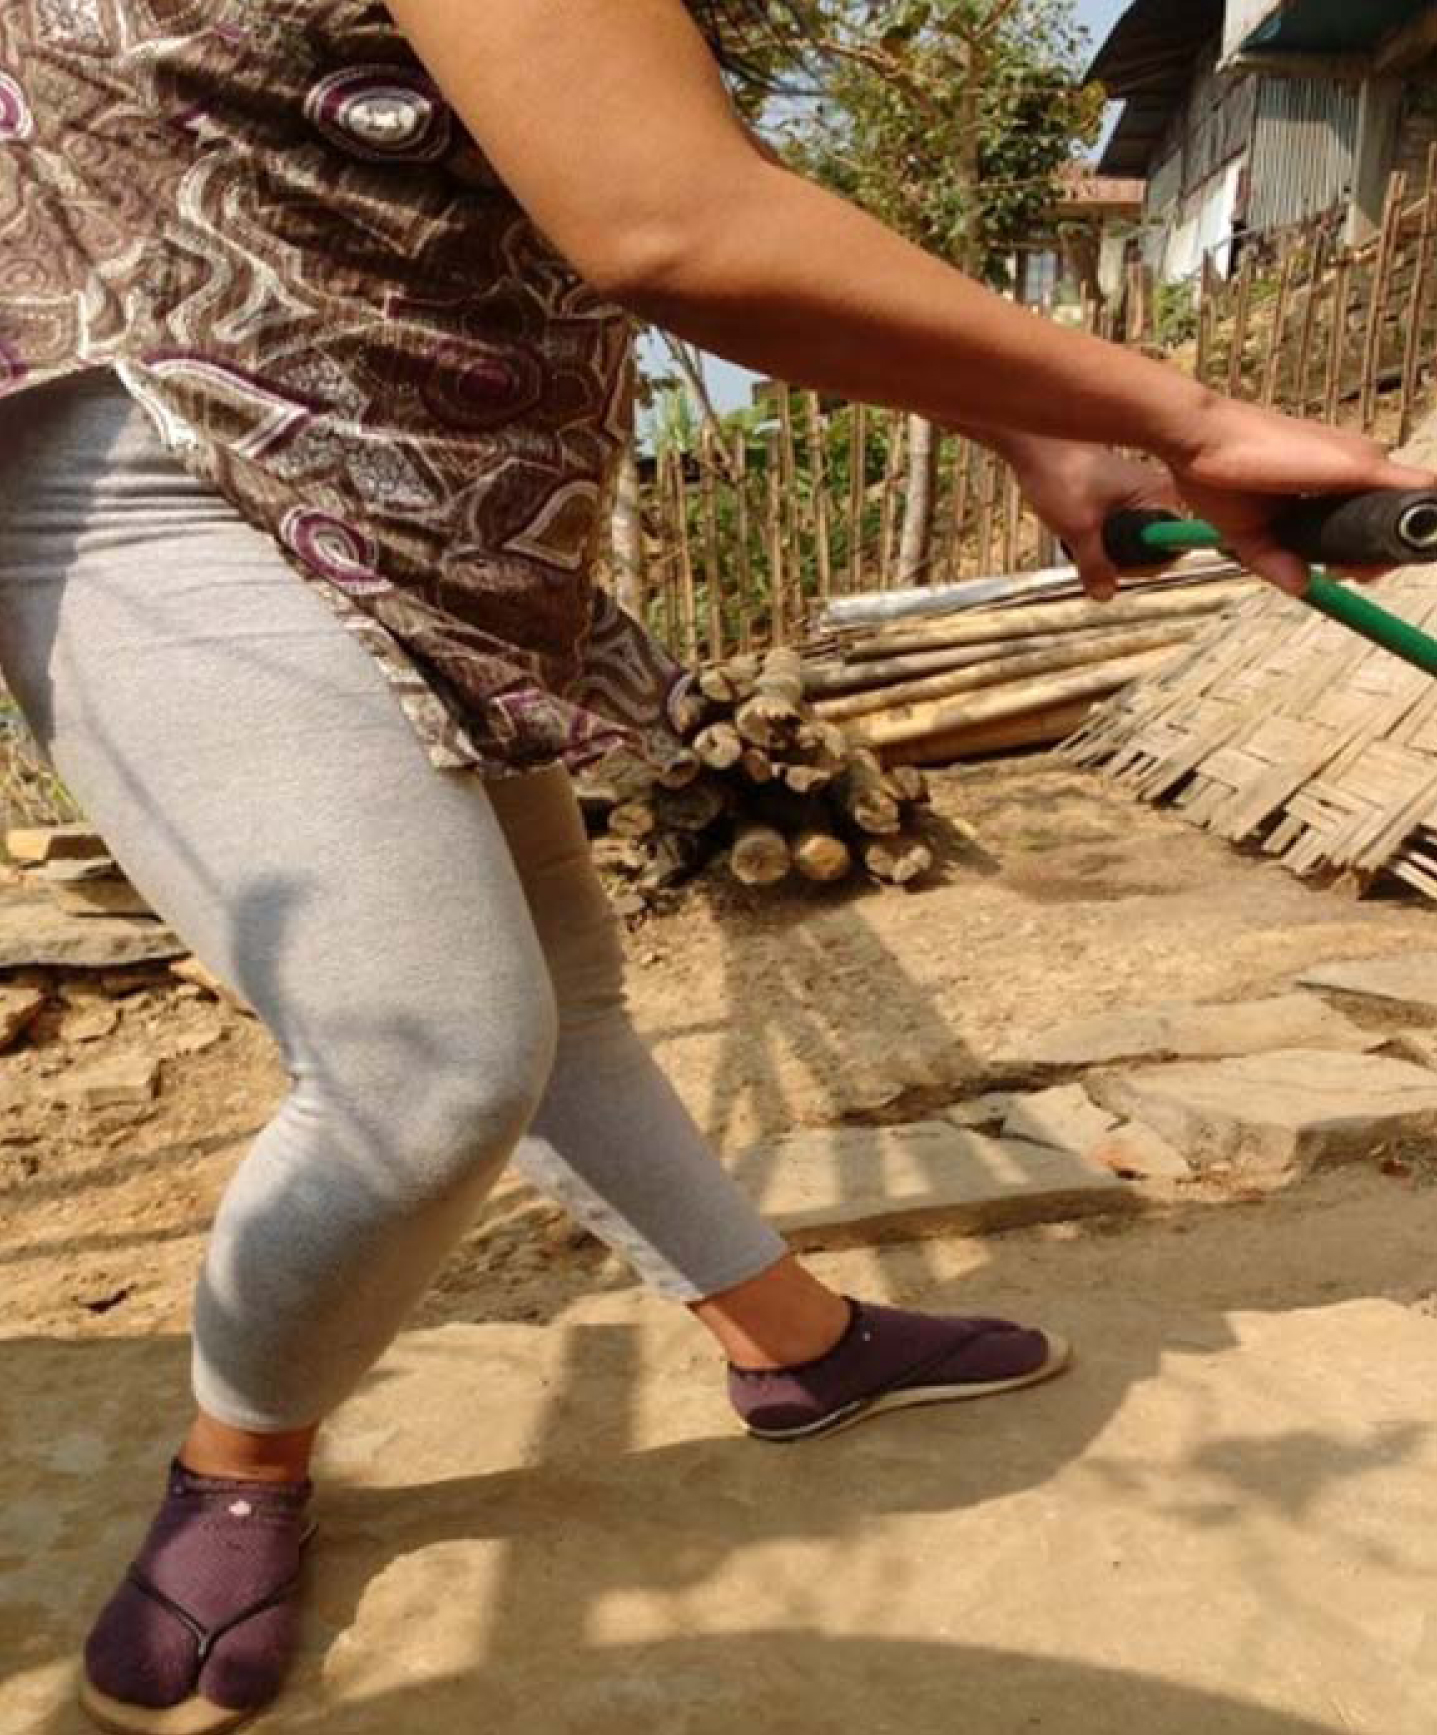
On-site measurement of pull force.
All data collected were analyzed using statistical software, IBM SPSS Statistics for Windows (Version 22; SPSS Inc., Chicago, IL, USA). Shapiro-Wilks test (p > 0.05) and visual inspection (Q-Q plot) were used to determine Normality. The comparisons of push and pull measurement data were represented as mean, minimum, maximum, SD, standard error of the mean, coefficient of variation, percentiles etc. All data were further presented with their mean value±standard deviation. Levene’s test for selecting a suitable t-test was utilized to measure the homogeneity of variances between groups. Statistical significance of differences between groups was determined by Student’s 2-sample independent t-test. The levels of significance i.e. alpha at p < 0.01 and p < 0.05 were deemed statistically significant.
Result
Physical characteristics of participants
The age of the male and female participants ranged between 18 and 65 years for both the genders. The total percentage of participants at three age groups viz., less than 30, 30–40 and more than 40 years were 25%, 26%and 49%for males, while 23%, 32%and 45%for females respectively. Detailed statistics of the participants are presented in Table 1. According to the t-test results, there were significant differences between males and females with respect to height and body weight for various age groups. Conversely, there was no statistically significant difference in the mean age, besides for more than 40 years age group (p < 0.05) Body Mass Index (BMI) was recorded to be statistically insignificant between male and female groups except for age group between 30–40 years and whole age group i.e. (p < 0.01) and (p < 0.05) respectively.
Overall summary of the physical characteristics of the participants
Overall summary of the physical characteristics of the participants
Note: n: sample size, SD: standard deviation; * mean difference between male and female workers of a group significant at (p < 0.05); ** mean difference between male and female workers of a group significant at (p < 0.01).
Effect of elbow angle on isometric push-pull strength
The push and pull peak strength of various angles for the males and females were tabulated (Table 2). The average peak push strength 17.93±3.62 kg for male was found for arm angles at 120–130° and for female, it was 11.57±3.75 kg, respectively. Corresponding average peak values for the pull strength for the male group was 15.23±3.80 kg and for the female group was 9.88±2.19 kg, respectively.
Isometric push and pull strength data of agricultural workers (n = 40)
Isometric push and pull strength data of agricultural workers (n = 40)
The descriptive statistics including mean, minima, maxima, SD, COV (%), SEM, 95%confidence lower and upper limits, 5th and 95th percentile values of the male and female farmworkers were presented in Table 3.
Comparisons of isometric push and pull strengths of male and female agricultural workers (n = 670)
Comparisons of isometric push and pull strengths of male and female agricultural workers (n = 670)
Measurement unit –kg; SEM-Standard error of the mean; COV- Coefficient of variation; #-95%confidence interval for the mean.
The isometric strength values (Mean±SD) for push and pull strengths were 18.91±4.67 kg and 17.98±3.97 kg for male farmers respectively where-as, for female farmers, they amounted to be 13.07±4.06 kg and 11.98±3.33 kg respectively. The coefficients of variation for push and pull strength was recorded to be higher in the female participants with contrast to the male participants, similar to that shown in earlier instances.
The isometric push strength database of three age groups for male and female agricultural workers as shown in Fig. 5 the isometric push and pull strength (kg; Mean±SD) was found to be 18.87±3.99 and 20.95±4.33; 17.85±4.82 and 15.15±3.65; 15.91±3.46 and 14.39±4.28 for male workers of age groups of < 30 years, 30–40 years and > 40 years respectively. Similarly for female workers, the isometric push and pull strength (kg; Mean±SD) were found to be 11.70±3.65 and 14.21±3.50; 12.97±4.41 and 10.59±2.95; 12.22±3.2 and 10.76±3.44 for < 30 years, 30–40 years and > 40 years respectively. Progressive with ageing, muscular strength for push-pull in males and females reduces, as could be observed from the graph.
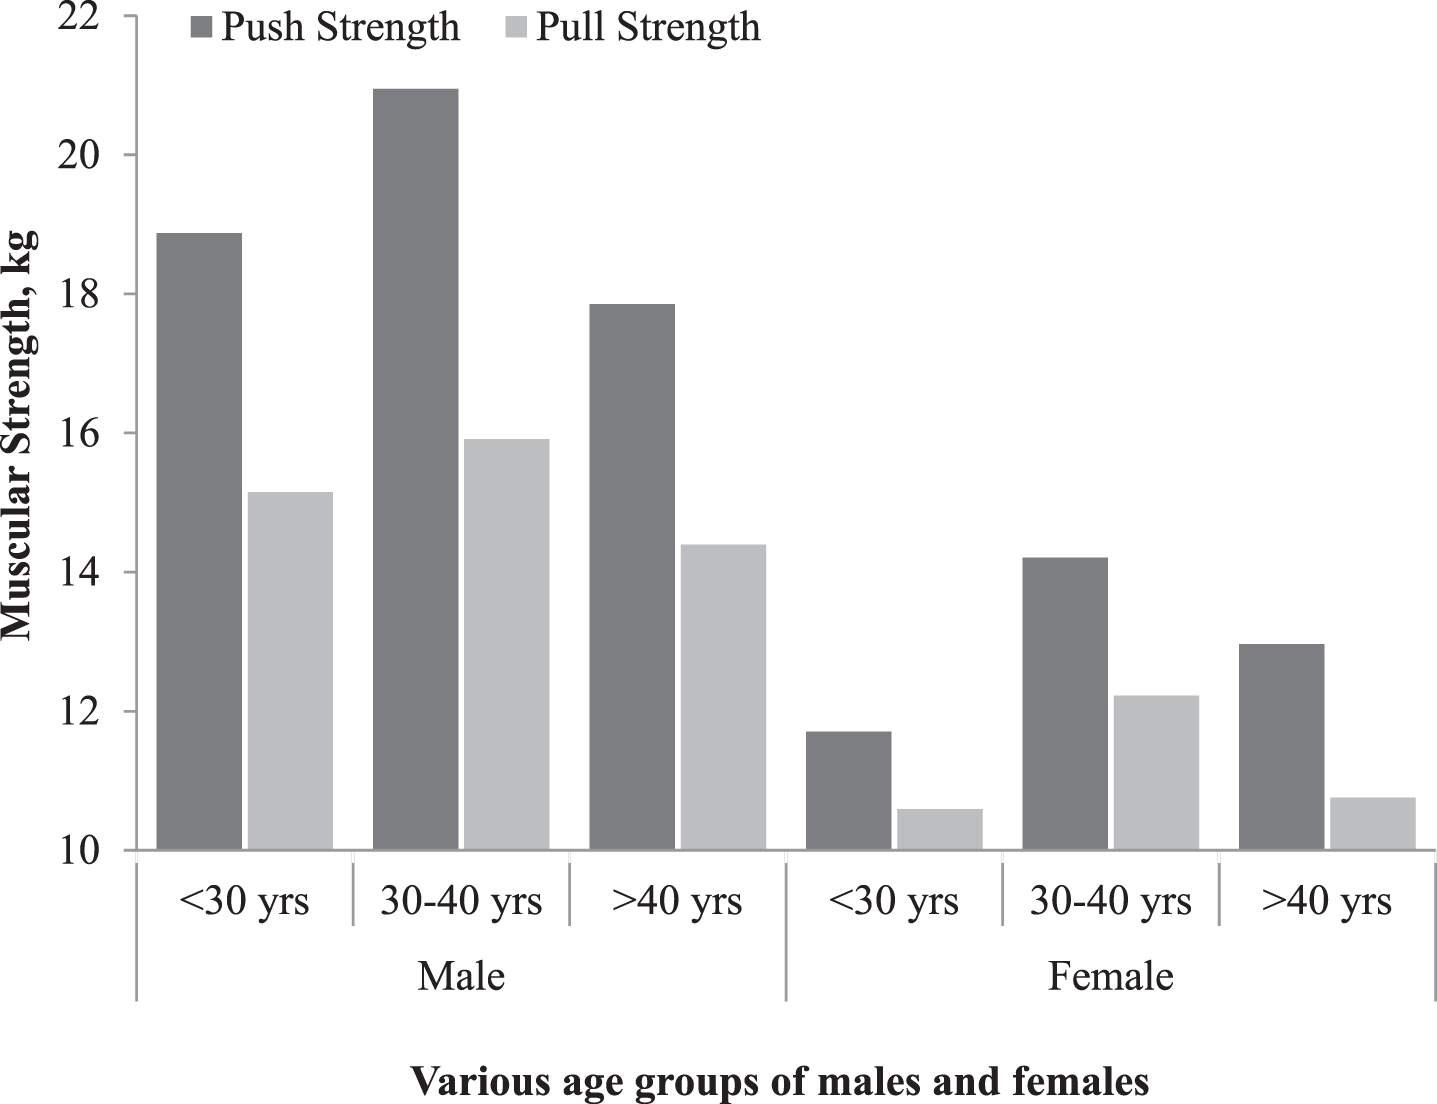
Mean value of isometric push-pull strengths for both males and females, presented age group-wise.
The results of independent samples Student’s t-test demonstrates that there was a substantial variance in the isometric push and pull strength values (p < 0.05) between the genders across the various age spectrum. Furthermore, the shared strength database of both genders across the age spectrum showed that competency of push strengths considerably higher (p < 0.05) than the pull strength. The differences in strength between male and female participants probably due to greater build muscle mass in males [28]. Several researchers have suggested that male muscular strength is commonly more than their female counterpart [29–31]. Subsequently, the muscular strength of the push force is relatively higher than the pull force.
As expected conventionally, at 95%probability, common zones or ‘overlaps’ for male and female isometric push and pull strength values demonstrated an inability to accommodate a wider array of muscular strength values of both males and females, as shown in Fig. 6.
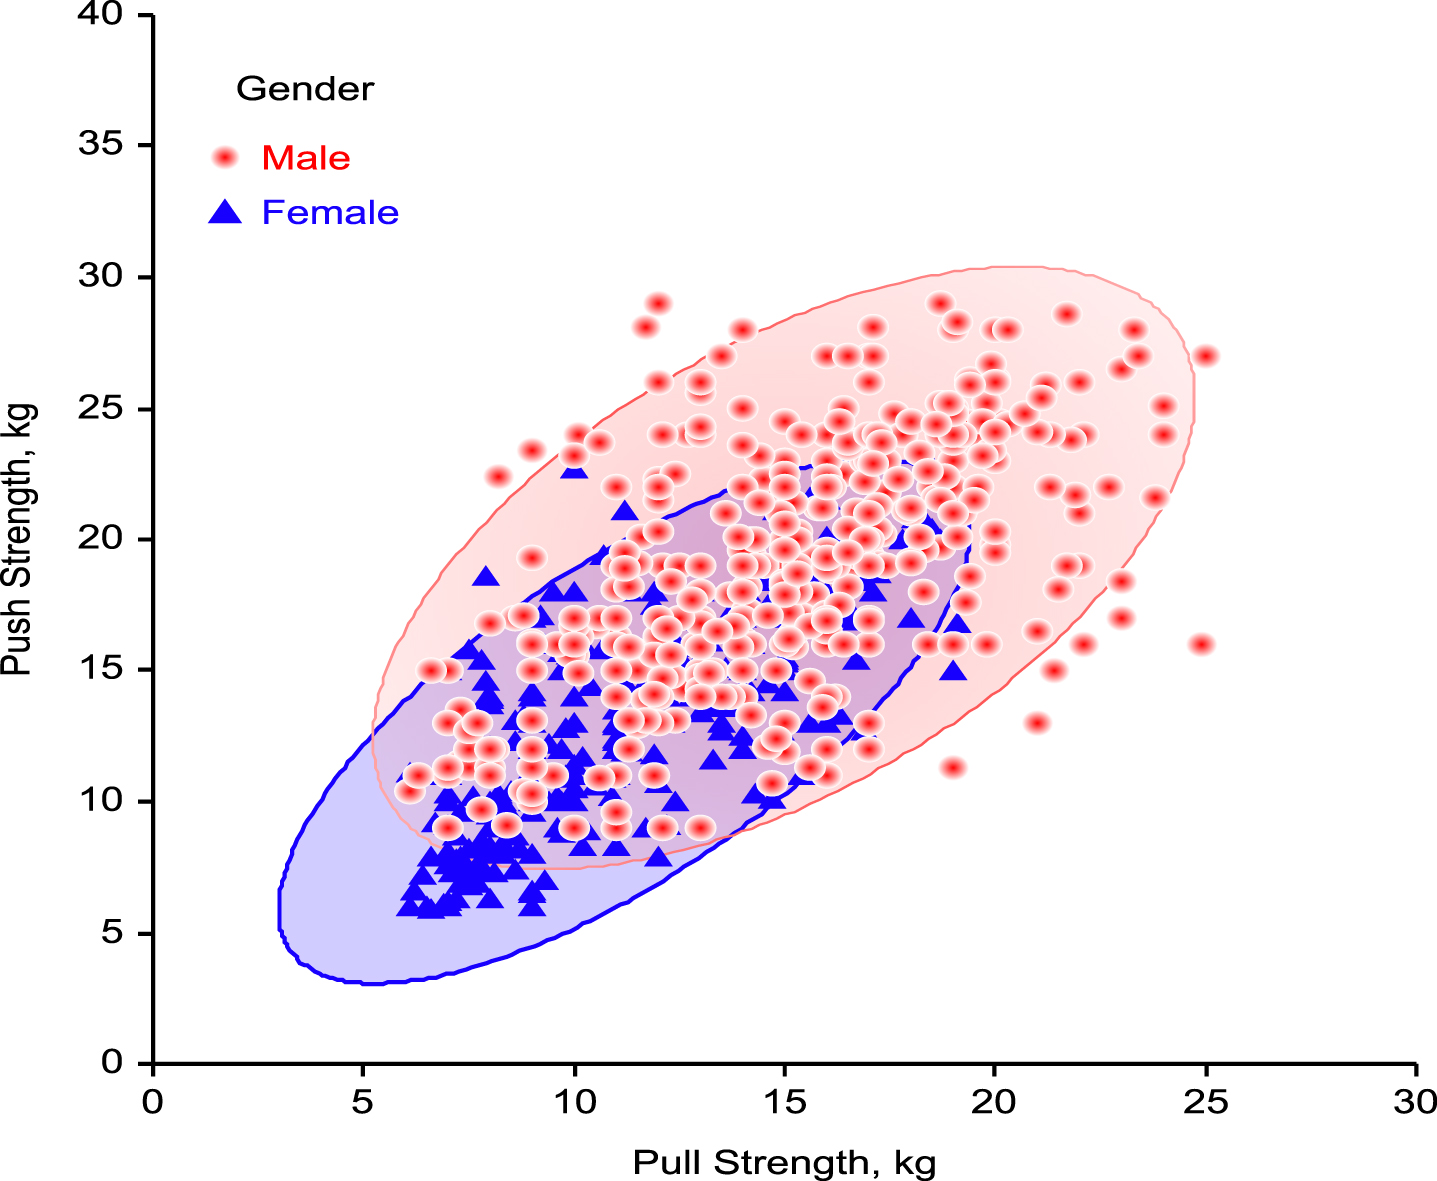
Probability plots of isometric push-pull strength.
Therefore, any agricultural activity which is monotonous in nature and executed commonly by both male and females should be so engineered that the requisite force would not exceed 30%of the 5th percentile of the maximum strength capacity of the female farmer. This ensures force requirements within the safety limits. In some cases, the force exertion may even rise up to 50%and under such circumstances, force, as mentioned above, applied is not more than five minutes [25, 28]. As such, the optimal value for both the male and female agricultural workers of Nagaland ought to be 5th percentile of female data which were 6.40 kg for push strength and 1.71 kg for pull strength. However, for the tools and equipment to be used solely by male workers, optimal values for strength should be 5th percentile value of male workers which was 3.37 kg and 2.45 kg for push and pull strength respectively. During some operational process where the gears for agricultural operations are engineered as per the 5th percentile mean values of both genders, then a sufficient period of rest should be provided to the female worker to minimize musculoskeletal problems.
The cumulative percentage distribution of isometric push-pull strength for male and female participants respectively is shown in Fig. 7. From the graph, it was observed that a cumulative percentage of 90%push and pull strength of males and females were about 25 kg and 20 kg; 18.4 kg and 15.5 respectively. For engineering or adjustment of tools and equipment to be operated by both the genders, the requisite force must not exceed 30%of the 5th percentile value of the maximum strength capacity of female workers to ensure broader range utilization and increased efficiency. However, the minimum force requirement should not be so low that even for a moderately strong person, it becomes difficult to control. The over-flexibility to accommodate the widest range of population may also be a deterrent to the existing design problems. In such circumstances, the design should emphasize separate standards for both male and female workers.
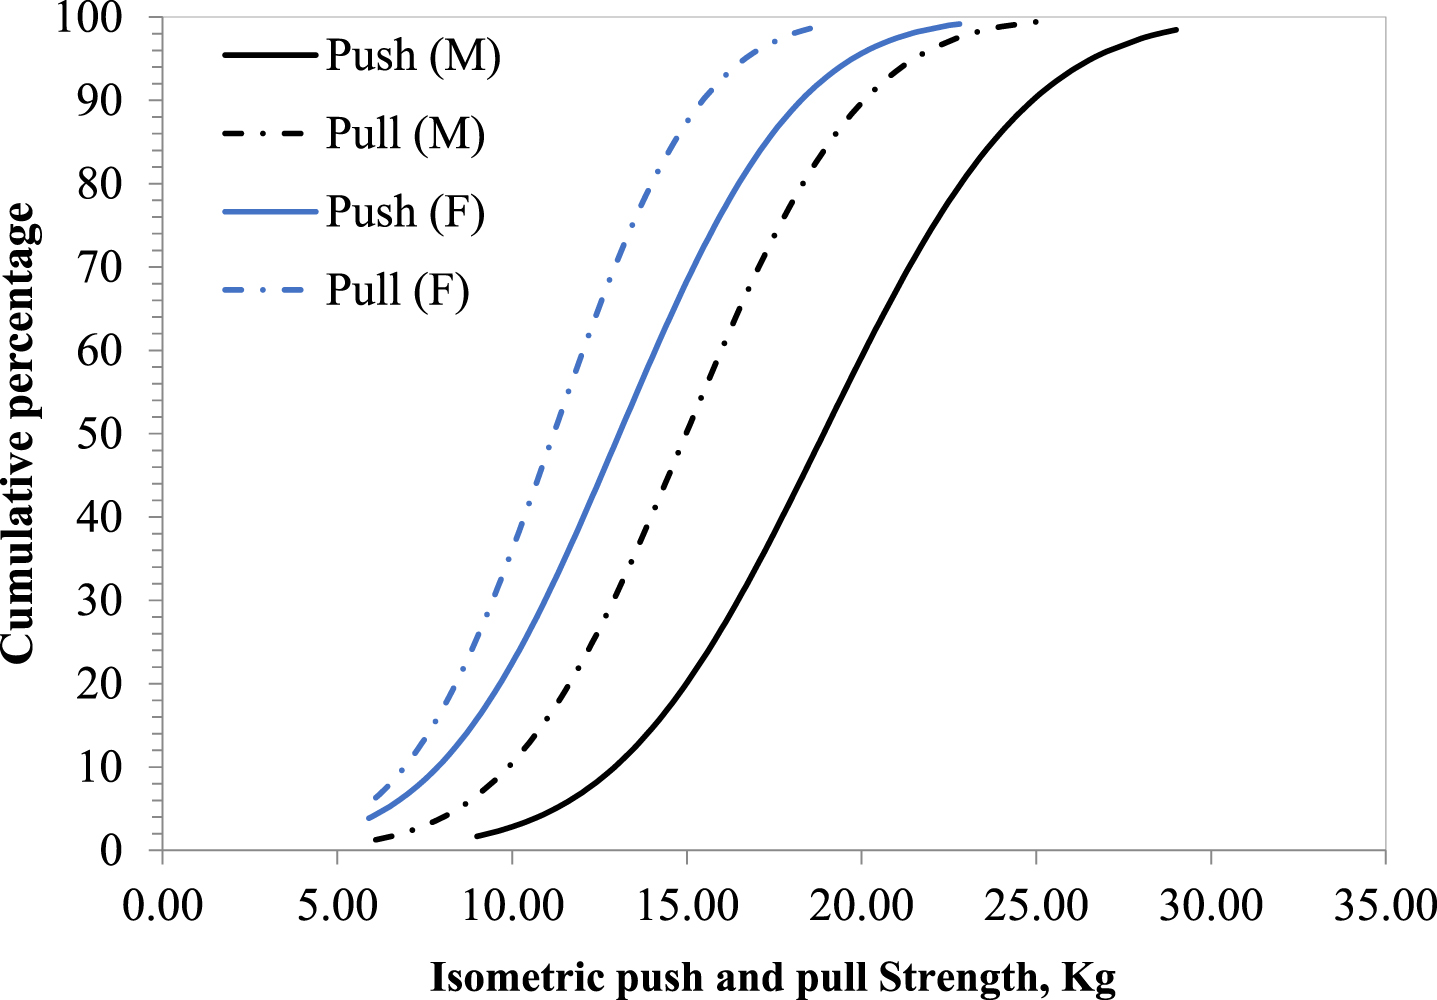
The cumulative percentage distribution of isometric push-pull strength for males and females.
Isometric push and pull strengths were limited to the agricultural workers only. The present study was conducted to one state in the northeast India, i.e., Nagaland with a limited number of subjects/participants. No attempt was made to assess the nutritional level of the participants which might influence their physical strength. The outcome of the present study might not be representative of agricultural workers of whole northeast India.
Conclusions
From the collected data and statistical analysis, it was observed that the combined strength database of both genders across the age groups showed that the capability of push strengths was significantly higher. With ageing, muscular strength for push-pull strength in males and females tend to reduce. Further, the coefficients of variation for push and pull muscular strength were found to be higher for female participants compared to male participants. It was observed that the requirement of any agricultural activity of repetitive in-nature performed generally by both genders would not exceed 30%of the 5th percentile of the maximum strength capacity of female workers. Therefore, the optimal values for male and female agricultural workers of Nagaland should be the 5th percentile of female data, which were 6.40 kgs for push strength and 1.71 kgs for pull strength. The recommended values for the tools and equipment to be used exclusively by male agricultural workers under the 5th percentile value was 3.37 kgs and 2.45 kgs for push and pull strength, respectively. The collected data in the present study would help in designing of tools/equipment which would be better suited to the local population of the selected region.
Conflict of interest
None to report.