
Abstract
BACKGROUND:
Work-related low back pain (LBP) increases the workforce disability and healthcare costs. This study evaluated the LBD risk level associated with handling the ACGIH TLVs in lifting tasks corresponding to various horizontal and vertical zones.
OBJECTIVE:
The aim of this study was to compare the low-risk ACGIH TLV to risk outcomes from various validated lifting assessment methods, including the OSU LBD Risk Model, NIOSH Lifting Equation, and LiFFT.
METHODS:
Twenty-four subjects were recruited for this study to perform various lifting conditions. The various ergonomic assessment methods were then used to obtain the risk assessment outcomes.
RESULTS:
The selected assessment methods showed that the ACGIH-defined TLVs are associated with less than high-risk for LBD for all the assessed tasks. The findings showed a moderate agreement (Kendall’s W = 0.477) among the various assessment methods risk outcomes. The highest correlation (ρ= 0.886) was observed between the NIOSH Lifting Equation and LiFFT methods risk assessment outcomes.
CONCLUSION:
The findings showed that ACGIH-defined TLVs possesses less than high-risk for LBD. The outcomes of the selected ergonomic assessment methods moderately agree to each other.
Introduction
Low back pain (LBP) continues to rank high in terms of prevalence, disability and healthcare costs. World-wide, LBP ranks the highest among medical conditions in terms of disability and has caused more disability globally than any other medical condition [1]. In the United States, the 12-month prevalence of low back pain lasting 7 days, seeking medical care, and lost time due to LBP were 25%, 14% and 10%, respectively [2], whereas the U.S. Bureau of Labor Statistics Annual Survey of Occupational Injuries and Illnesses reported the median number of days away from work for musculoskeletal disorders to the back of 9.0 days and an incidence rate of 9.8 cases per 10,000 full time equivalent workers in 2020 [3]. From a cost perspective, LBP combined with neck pain accounted for the third-highest amount spent on health care in the U.S., behind diabetes and ischemic heart disease [4]. Direct costs for LBP ranged from $12.2B to $90.6B and indirect costs ranged from $7.4B to $28.2B from 1997–2007 [5]. Among workers compensation claims for work-related musculoskeletal disorders (WMSDs), claims for the lumbar spine ranked first for total costs [6].
Given the elevated lost-time and high healthcare-related costs associated with LBP it is imperative that contributors to LBP be identified such that effective interventions can be developed and implemented. Several systematic literature reviews and meta-analyses of the work-related musculoskeletal epidemiological research literature have found significant associations between LBP and the manual material handling (MMH) activity of lifting [7–10] and exposure factors related to MMH such as awkward postures [8, 9] and frequency of lifting [7, 8]. Several MMH assessment methods have been developed over the past three decades in an effort to identify aspects of jobs that involve lifting and lowering, assess exposure to risk factors for LBP as well as assist in developing interventions to reduce the risk of LBP from lifting and lowering. Some of these methods include the NIOSH Lifting Equation [11], psychophysical tables for manual handling [12], the Ohio Bureau of Workers Compensation Lift Guidelines [13], the Ohio State University (OSU) Low Back Disorder (LBD) Risk Model [14], and the University of Michigan’s 3D Static Strength Prediction Program (3DSSPP, University of Michigan, Ann Arbor, MI, USA) to name a few. The American Conference of Governmental Industrial Hygienists (ACGIH) released a lifting assessment method in 2004, referred to as the ACGIH Threshold Limit Values (TLVs) for Lifting [15]. The ACGIH TLV for Lifting consists of a set of three tables for assessing two-handed mono-lifting tasks within 30 degrees of the sagittal plane of torso asymmetry. Each table takes into account the horizontal and vertical location of the object being lifted at the origin (and destination if the load is placed in a controlled manner), and the frequency and duration of the lifting task. In each table there are four zones for the vertical location of the object being lifted (floor to mid-shin, mid-shin to knuckle, knuckle to shoulder, and shoulder to reach limit) and three horizontal distance zones measured from the mid-point of the ankles to the object in the hands (close: 0–30 cm; intermediate: 30–60 cm; extended: 60–80 cm). The TLV in each of the horizontal and vertical zones represent the weight of an object which is believed that nearly all workers may be repeatedly exposed, day after day, without developing work-related low back disorders associated with repetitive lifting tasks [16]. If the weight of the object lifted exceeds the TLV, changes in the work design should be applied such that the load weight falls below the TLV weight.
Since its release in 2004 the ACGIH TLV for Lifting has been utilized for various ergonomics assessment and research activities. The ACGIH TLV for Lifting has reportedly been utilized by more than half of practitioners surveyed in the US (55.9%) and Canada (66.0%), and its frequency of use by certified ergonomics practitioners was third among methods utilized to assess manual handling tasks, behind the NIOSH Lifting Equation and psychophysical tables for manual handling [17]. The ACGIH TLV for Lifting has also been used for assessment of lifting risk factor exposures in automobile manufacturing tasks [18], changes to lifting risk factor exposures related to intervention prototypes for courier delivery vehicles [19], and exposure assessment and quantification in epidemiological studies [20, 21].
Some of the strengths of the ACGIH TLV for Lifting include that it’s able to be administered quickly and easily, and that its format translates relative complex data into a quick and easy to use assessment and interpretation of the results. However relatively little is known about how the results of the ACGIH TLV compare to other assessment methods, especially other validated methods for assessing lifting. A study [22] reported that, when assessing musculoskeletal exposures for the same lifting tasks, the NIOSH Lifting Equation, ACGIH TLV for Lifting and psychophysical manual handling tables provide similar risk level results. However, the 3DSSPP biomechanical assessment resulted in lower risk values for the same lifting task [22]. Another investigation utilizing the 3DSSPP biomechanical model reported estimated L4/L5 compression and Anterior/Posterior (A/P) shear forces when lifting ACGIH TLV defined weights from various horizontal and vertical locations [23]. Here investigators report estimated L4/L5 compression forces to be greater than an assumed injury threshold of 3400 N, concluding that the ACGIH TLVs overstate lifting safety for the majority of conditions at and below torso height [23].
While the ACGIH TLV for Lifting appears to be a widely utilized exposure assessment method for practitioners and researchers, there is limited evidence with respect to validation of this method, specifically the relationship between the TLVs and their association with actual rates of LBD or actual risk levels. Lifting assessment methods that have had validation efforts performed include the OSU LBD Risk Model [24], the NIOSH Lifting Equation [25, 26], and the Lifting Fatigue Failure Tool (LiFFT; [27]), where significant associations were found between the assessment method outcomes and rates of LBP. While [22] did show that the ACGIH TLV for Lifting method produced similar results as the NIOSH Lifting Equation in terms of risk level (e.g., elevated risk), other validated LBP risk assessment methods also exist for comparison purposes. Thus, the objective of this research was to compare ACGIH defined TLVs (which are considered safe weights for repetitive lifting) at different horizontal and vertical locations to risk outcomes from different validated lifting risk assessment methods, specifically the OSU LBD Risk Model, NIOSH Lifting Equation, and LiFFT.
Methods
Approach
This study assessed the LBD risk level associated with ACGIH TLVs for the frequent, long-duration lifting tasks corresponding to two horizontal and vertical zones. Two horizontal distances were tested in each horizontal zone including 45 cm and 55 cm for the intermediate horizontal zone and 65 cm and 75 cm for the extended horizontal zone. The vertical height zones included the mid-shin to knuckle zone and knuckle to shoulder zone. Three validated risk assessment methods were used to examine the TLVs including OSU LBD Risk Model, the NIOSH Lifting Equation, and LiFFT.
Subjects
Twenty-four (12 males and 12 females) subjects — college students — were recruited for this study. Anthropometric data for these subjects are shown in Table 1. All subjects were free from low back pain for at least six months prior to the experiment and had little to no industrial MMH experience.
Anthropometric data for the 24 subjects
Anthropometric data for the 24 subjects
The experimental design consisted of a repeated measures factorial design. The independent variables consisted of the four-level horizontal zone (intermediate-45 cm, intermediate-55 cm, extended-65 cm, extended-75 cm) and the two-level vertical zone (mid-shin to knuckle; knuckle to shoulder). All subjects were exposed to all combinations, including each independent variable at each level. The dependent variable consisted of the output of the OSU Risk Model’s probability of high-risk group membership, the NIOSH Lifting Equation Lift Index (LI) values, and the LiFFT high-risk probability.
Equipment
A Lumbar Motion Monitor (LMM; Nexgen Ergonomics, Pointe Claire, Quebec, Canada), which is a three-dimensional electrogoniometer, was used to record the three-dimensional torso kinematics. A box with handles was loaded with weights and used as the object to be handled from chosen locations. Two platforms were used as surfaces to lift the loaded box from and place it on one of the platforms. The first platform (origin) was positioned within two vertical zones and four horizontal distances from the midpoint between the subject’s inner ankles. The other platform (destination) was positioned in front of the subject and fixed at the subject-specific waist height. A tape measure was utilized to manually measure the horizontal moment arm distance between the subject’s approximate location of the L5/S1 intervertebral disc and middle-knuckle (3rd metacarpal-phalangeal joint) while lifting the box from the origin location.
Experimental Protocol
Figure 1 illustrates a flowchart of the experimental procedures. Upon the arrival of each subject to the lab, study procedures and objectives were explained. Prior to participation subjects were asked to read and sign an informed consent form approved by the Wichita State University Institutional Review Board for Human Subjects Research (IRB# 1757). Afterward, anthropometric measures (e.g., body mass, height, waist height, and elbow height) were collected. The subjects were then fitted with the LMM which was attached to the upper torso by a waist harness and a chest harness. Next, the subject performed multiple lifting trials for familiarization purposes. The experimental task consisted of lifting a box from a height-adjustable wooden shelf (see Fig. 2), fixed at two vertical zones (mid-shin to knuckle; knuckle to shoulder) and four horizontal distances (45 cm; 55 cm; 65 cm; 75 cm) from the midpoint between the subject’s inner ankles to a common destination in front of the subject adjusted to the waist height. For the mid-shin to knuckle vertical zone, the shelf height was fixed so that the box handle height was 66 cm above the floor for all subjects. For the knuckle to shoulder vertical zone, the shelf height was adjusted so that the height of the box handles was equal to each subject’s elbow height. Using the tape measure, the investigator measured at the beginning of each lift the horizontal external moment arm distance between the approximate location of the L5/S1 intervertebral disc and the hands grasping the box handles. For each vertical zone and horizontal distance combination subjects performed four lifting trials at a lifting frequency of four lifts per minute.
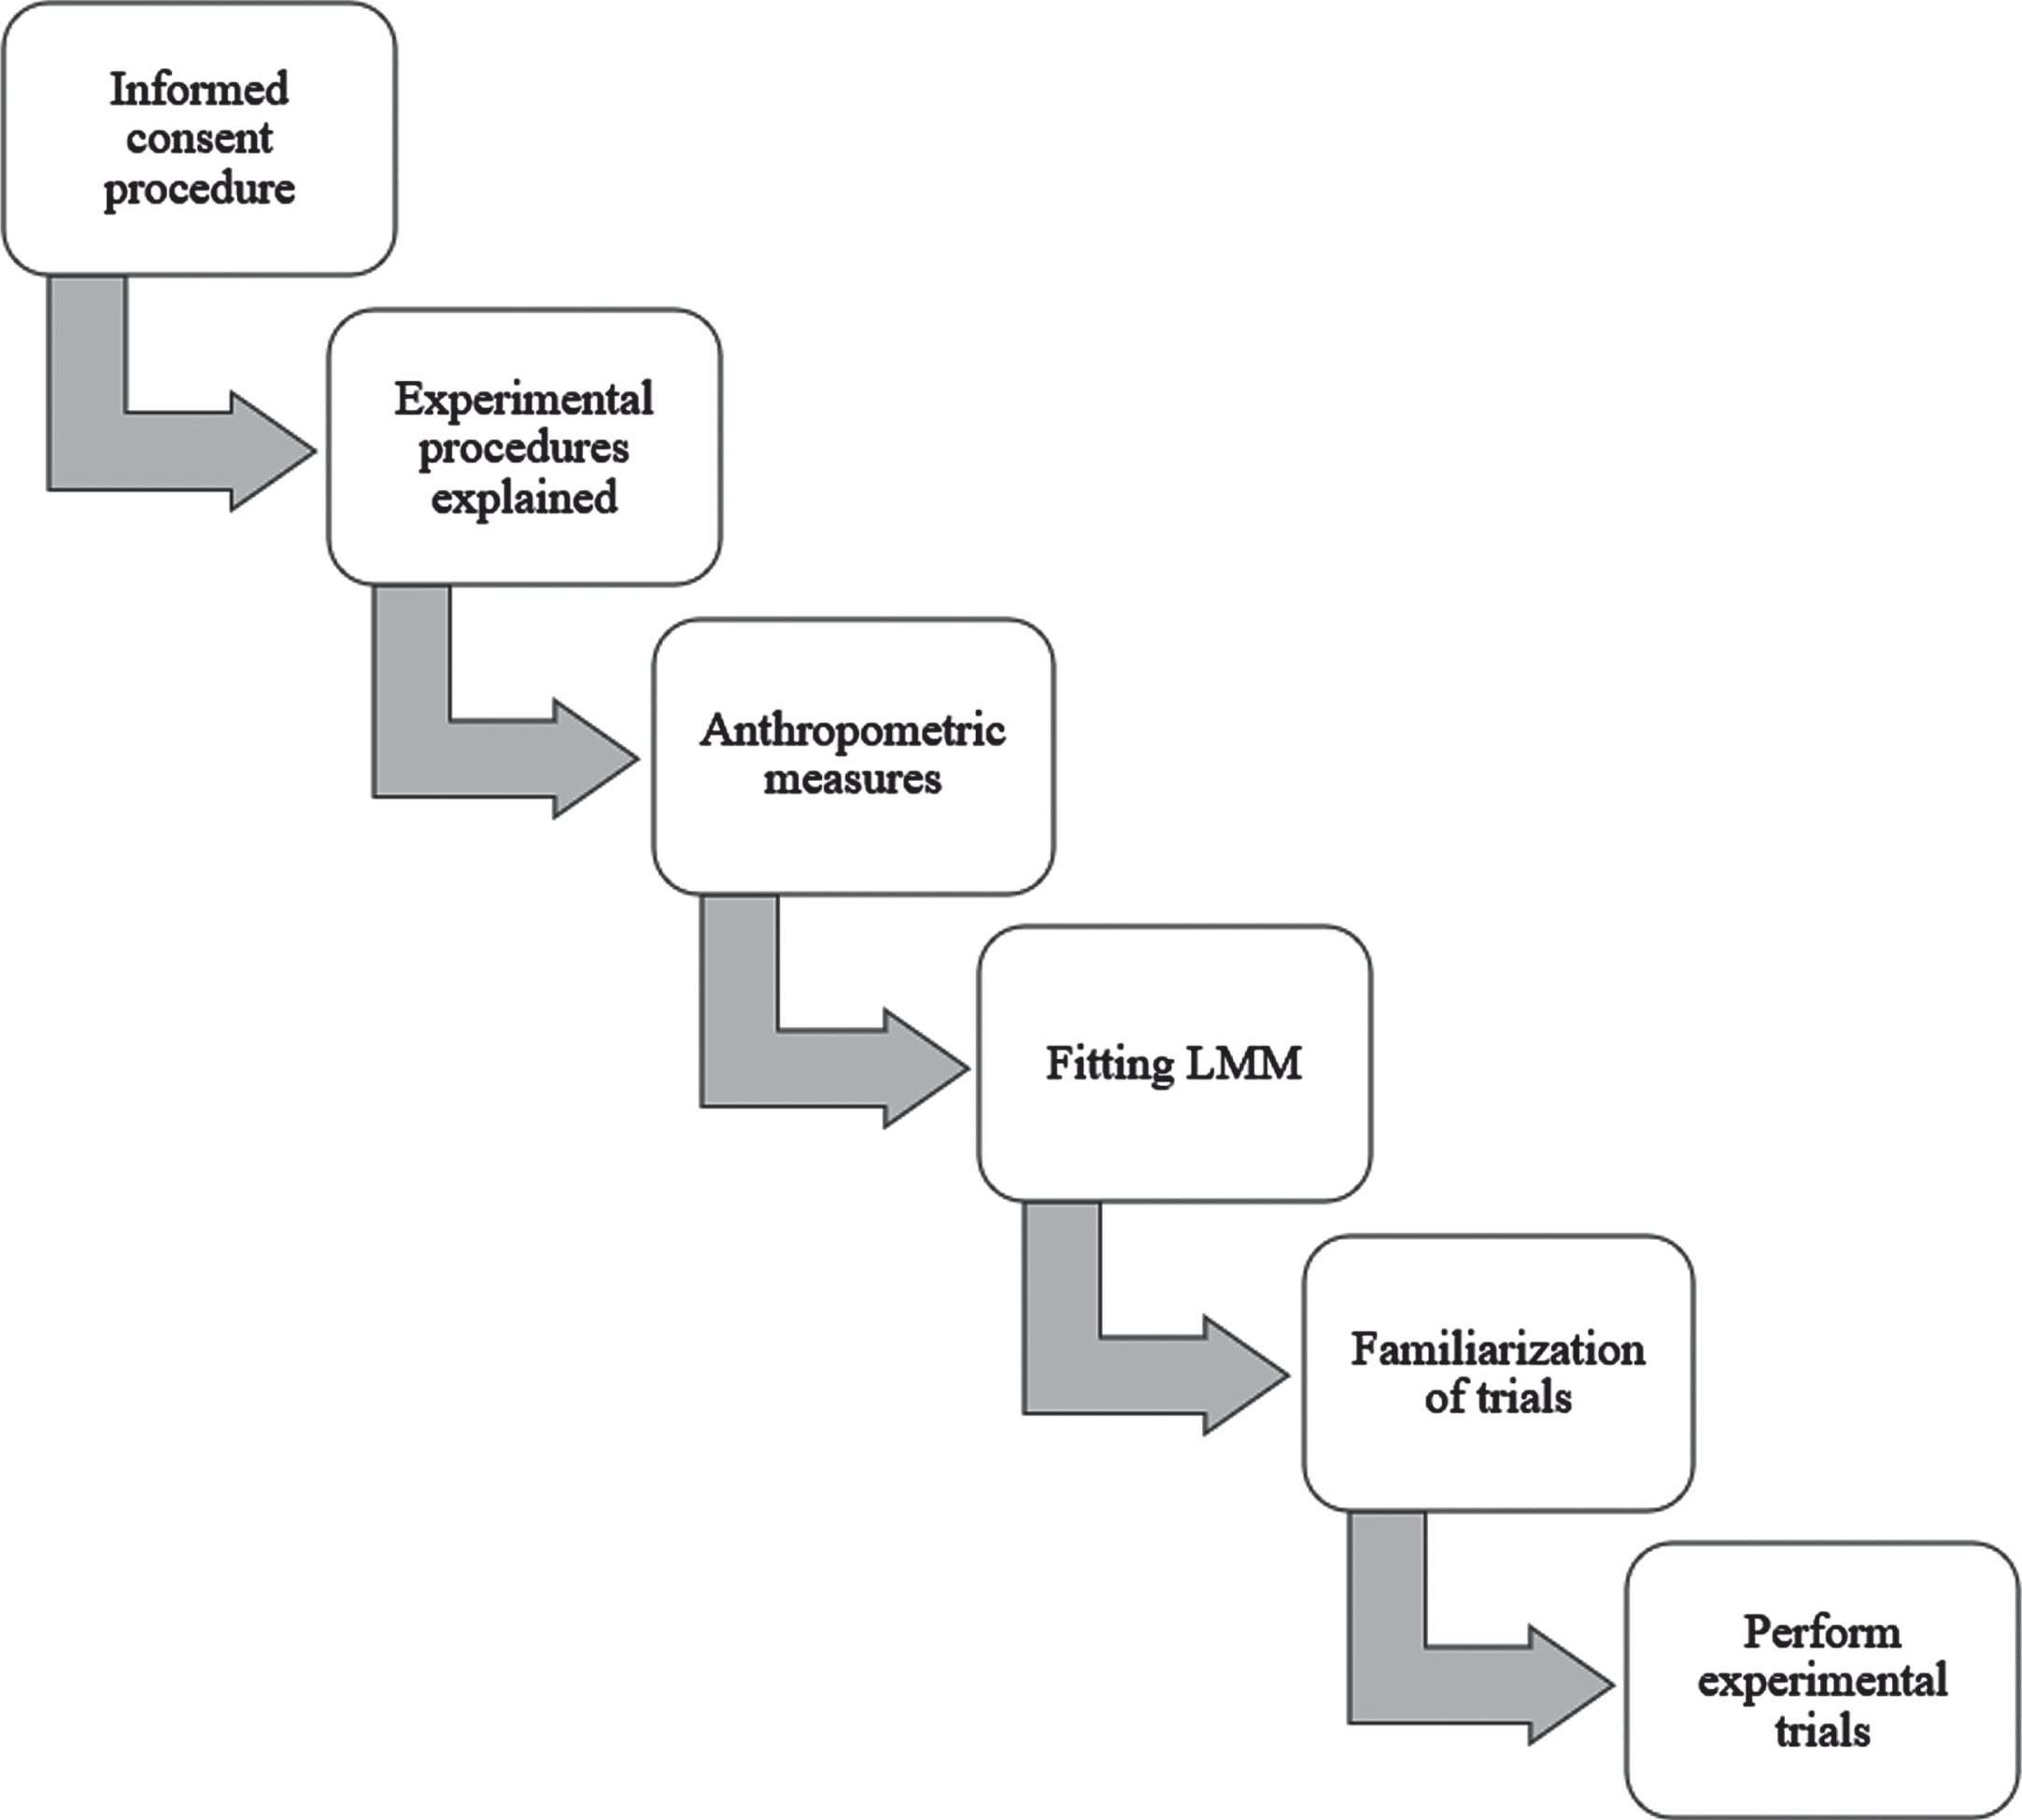
Flowchart of the experimental procedures.
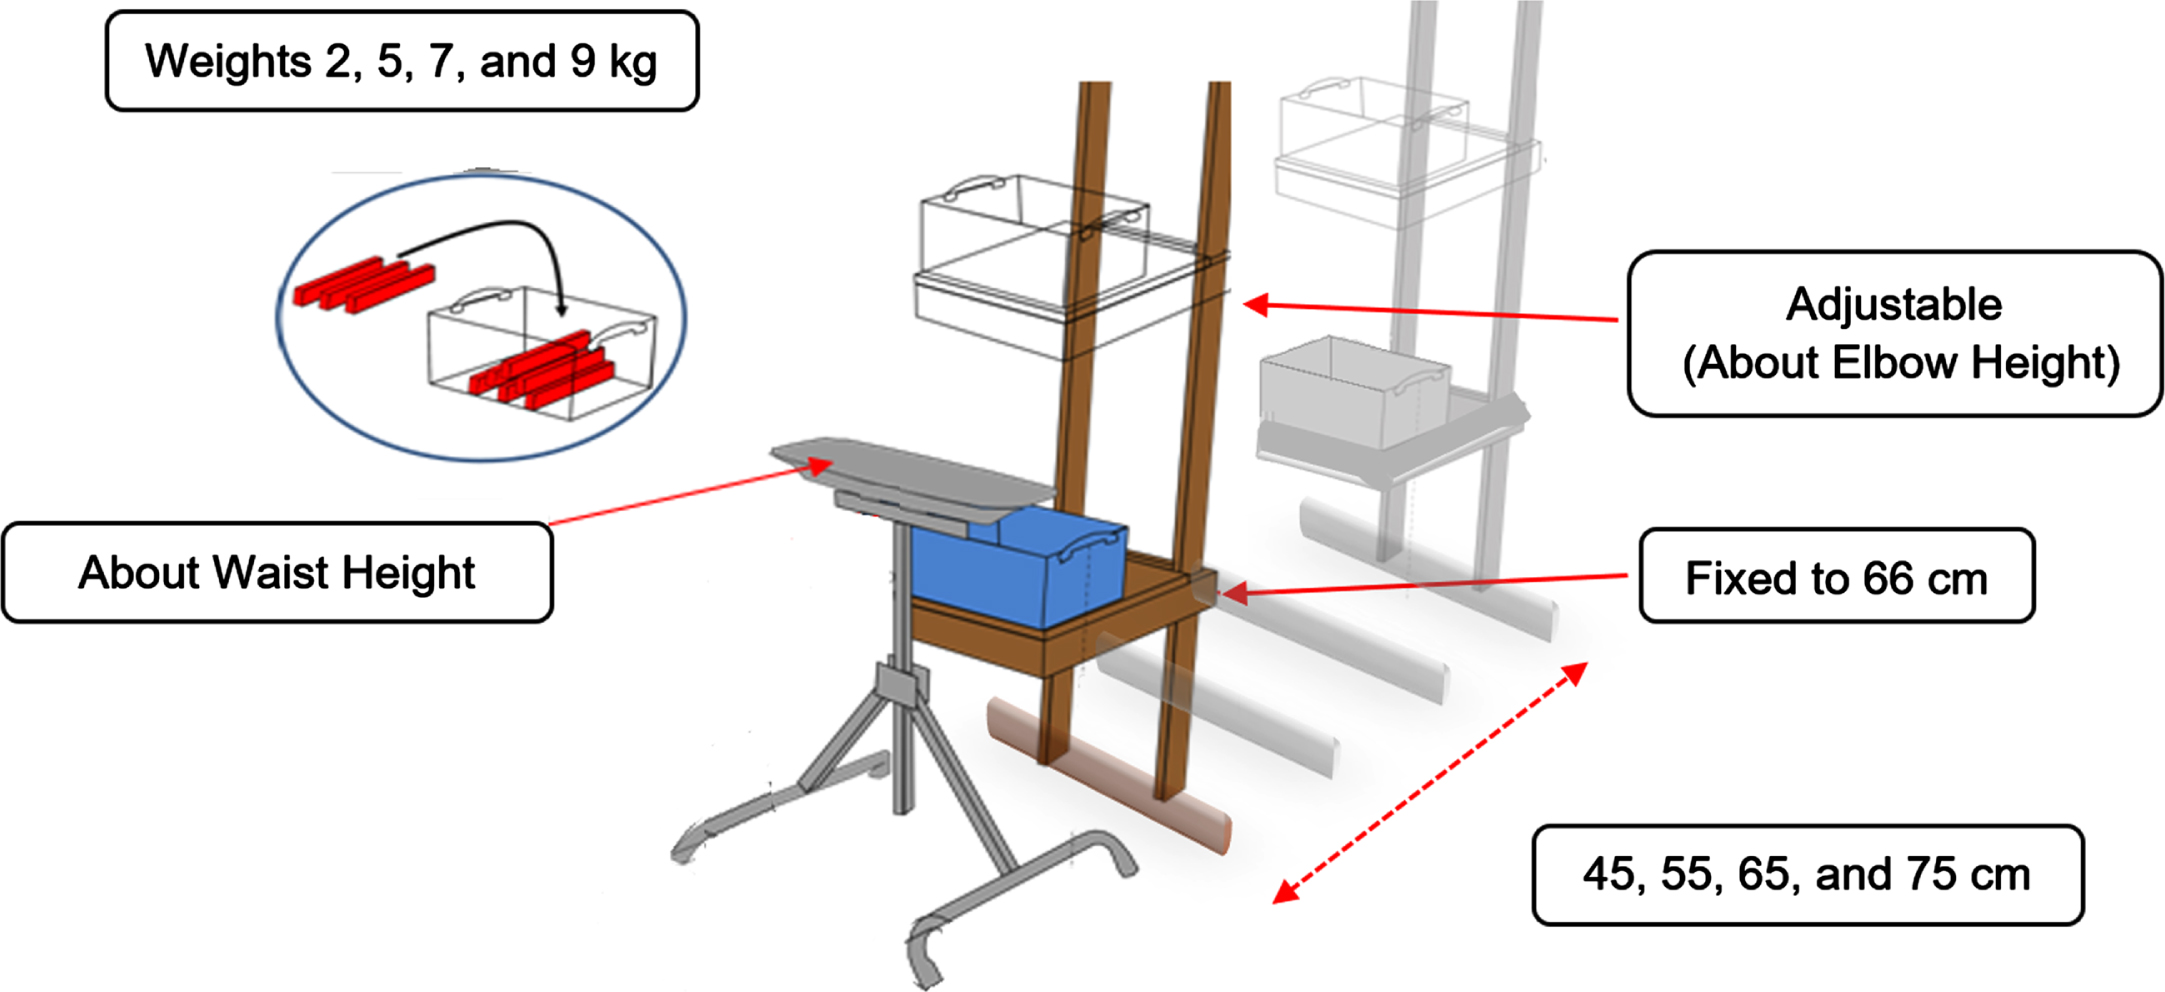
Experimental equipment setup.
For each horizontal zone-distance and vertical zone combination, a load was placed in the box producing a weight equivalent to the TLVs recommended in Table 3 of the ACGIH TLV for Lifting for frequent and prolonged lifting tasks [16]. For the combination of mid-shin to knuckle vertical zone with the intermediate horizontal distances (i.e., 45 cm; 55 cm), the box weight totaled 7 kg. For the combination of the same vertical zone (i.e., mid-shin to knuckle) with the extended horizontal distances (65 cm; 75 cm), the box weight totaled 2 kg. For the knuckle to shoulder vertical zone with the intermediate horizontal distances investigated (45 cm; 55 cm), the box weight totaled 9 kg. For the combination of the same previously mentioned vertical zone (i.e., knuckle to shoulder) with the extended horizontal distances (65 cm; 75 cm), the box weight totaled 5 kg (see Fig. 3). Two minutes were given as a timeframe between conditions to allow rest and to set up for the next experimental condition.
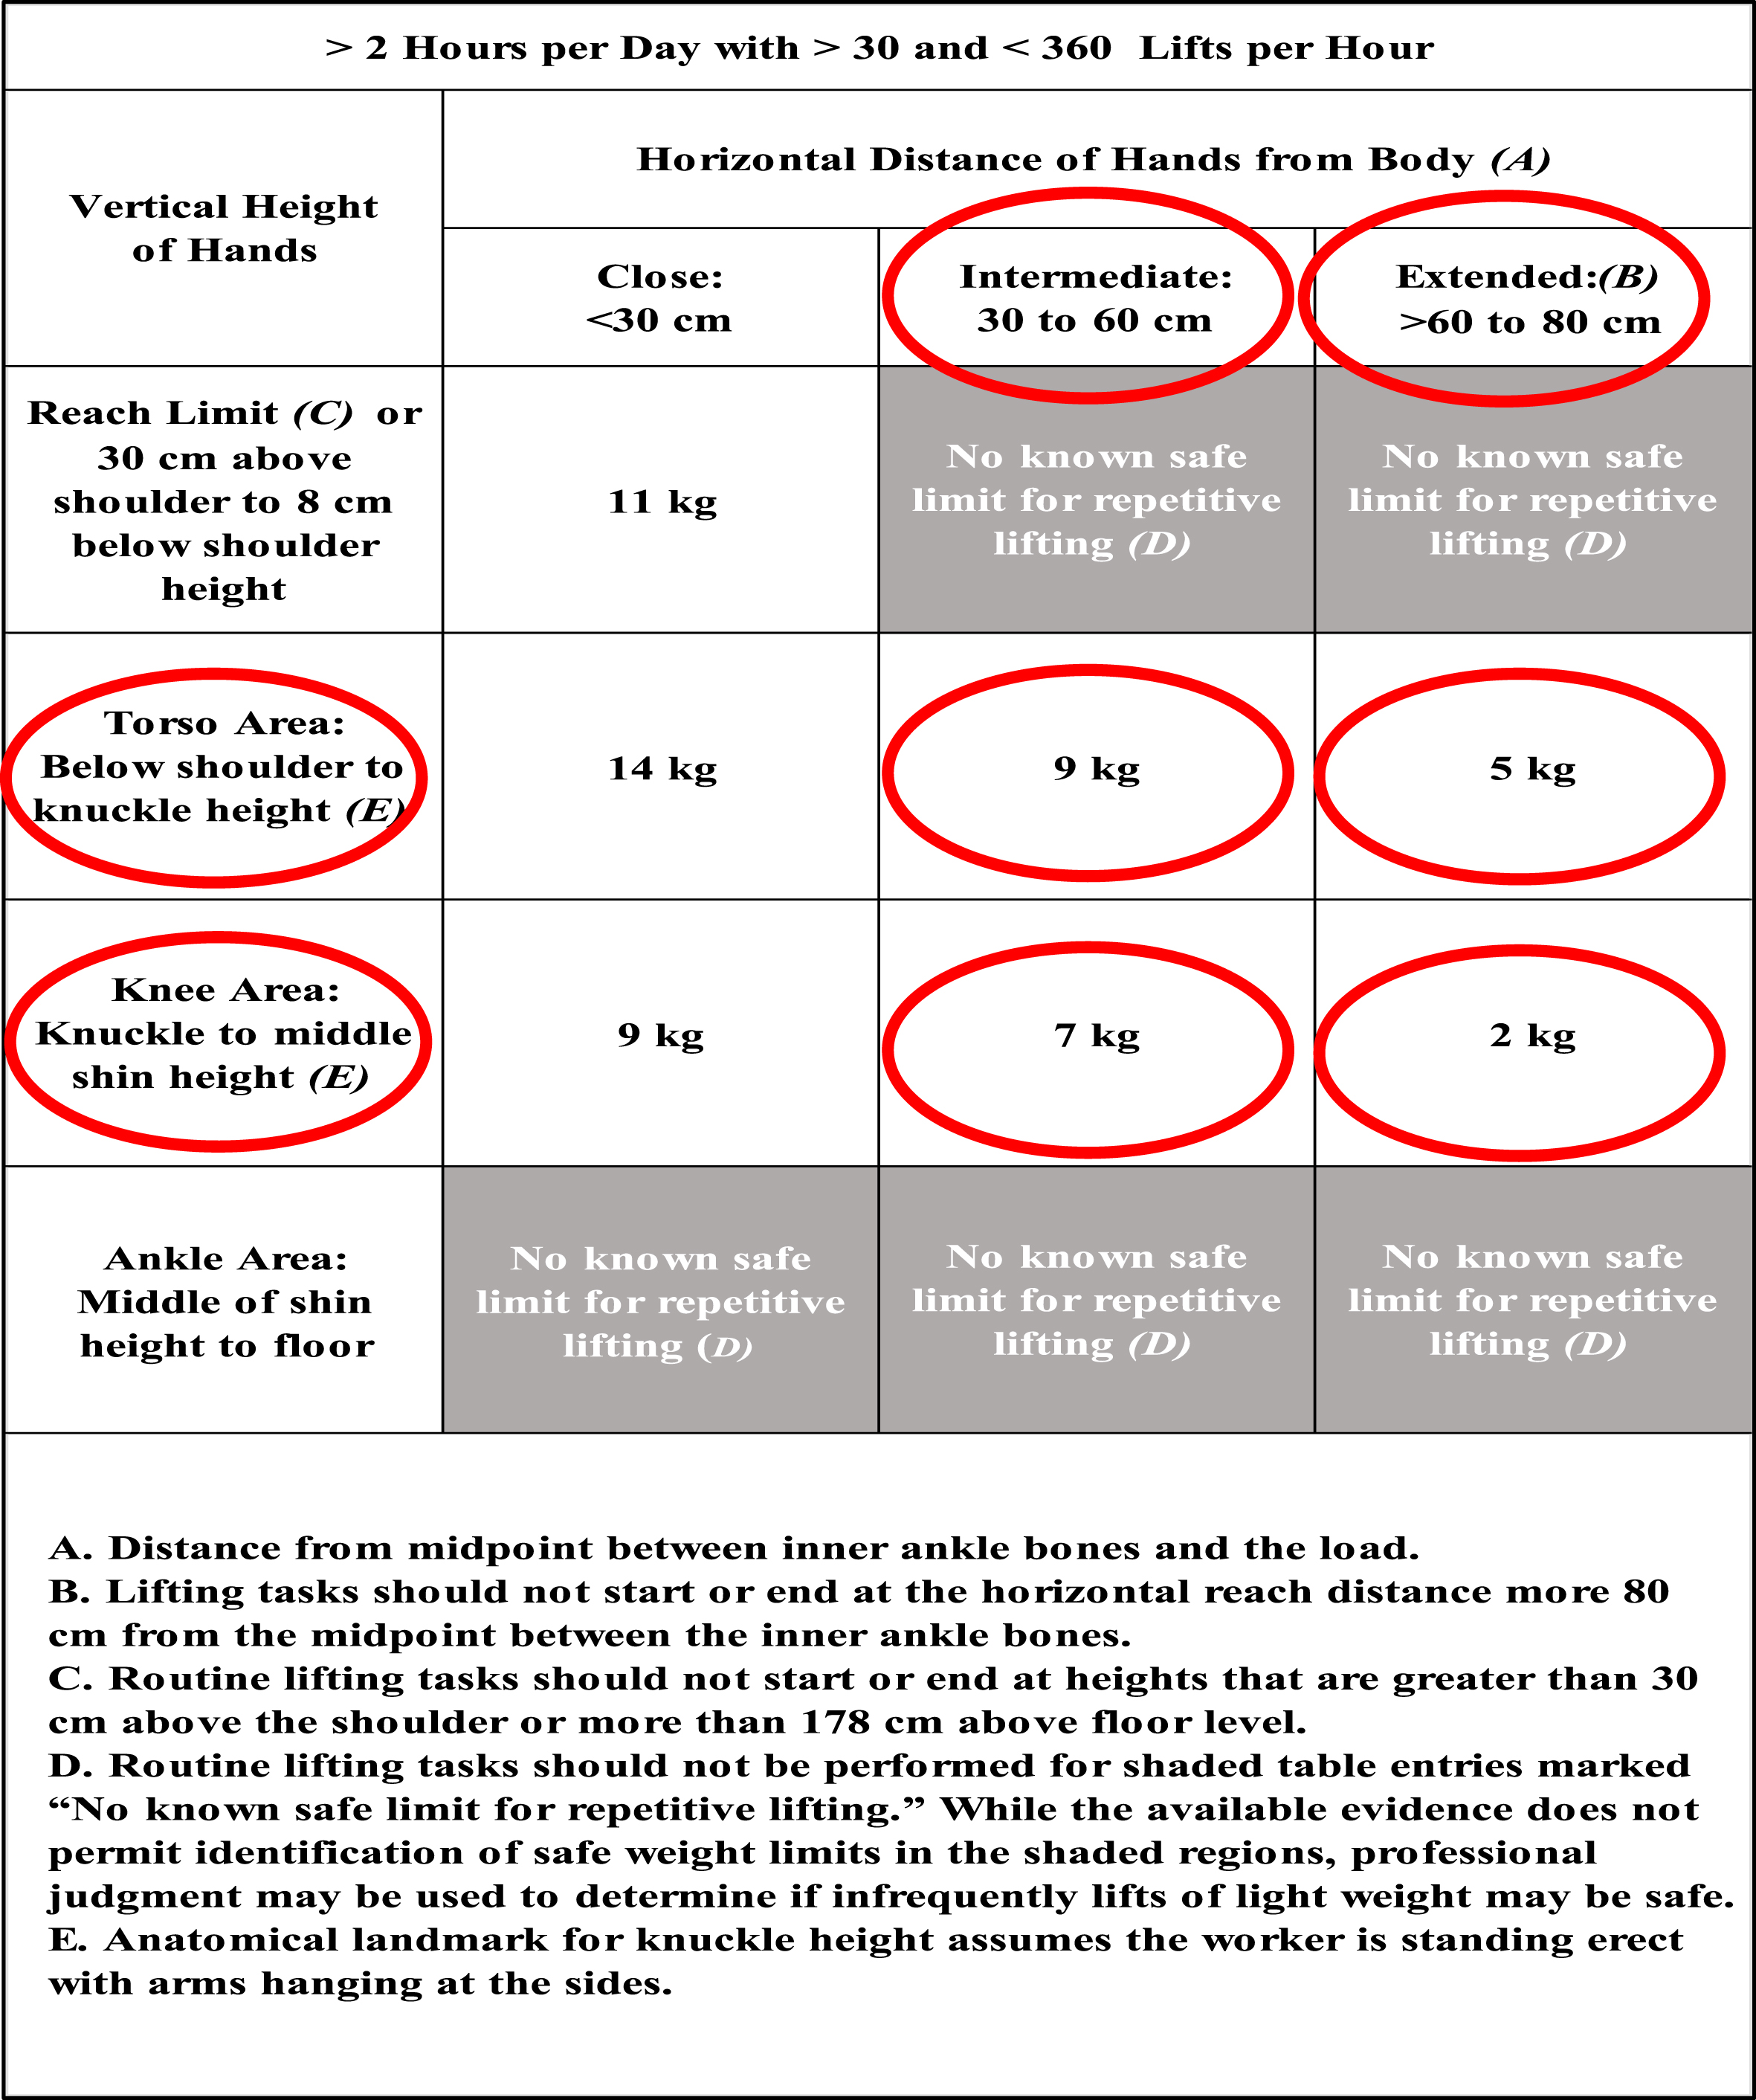
Threshold limit values for the investigated horizontal and vertical lifting zones (circled in red) [15].
The LMM data (i.e., maximum sagittal position, maximum lateral velocity, and average twist velocity) along with other inputs (i.e., external horizontal moment arm and lift rate) were used to determine the probability of high-risk group membership for LBD using the OSU LBD Risk Model [14]. The LBD risk probability is interpreted as low-risk: LBD risk < 30%; medium-risk: 30% ≤LBD risk≤70%; high-risk: LBD risk > 70%.
The NIOSH Lifting Equation LI value is the ratio of the load weight (i.e., TLV in this study) and the recommended weight limit (RWL) (see Equation 1). The RWL is the product of the load constant (i.e., 23 kg) and various multipliers including the horizontal multiplier (HM), vertical multiplier (VM), distance multiplier (DM), asymmetry multiplier (AM), frequency multiplier (FM), and coupling multiplier (CM) (see Equation 2). Since the box has handles the “CM” was equal 1.0, and the “AM” was also 1.0 as the lifting tasks were sagittally symmetric. The LI values are interpreted as low-risk: LI≤1; moderate-risk: 1 < LI≤3; and high-risk: LI > 3. The details of estimating the NIOSH Lifting Equation LI values are explained in [11].
The LiFFT low back risk assessment tool [27] uses three variables as inputs to determine the probability of a high-risk task. These variables include the load weight (TLV in this study), maximum horizontal moment arm between the approximate L5/S1 intervertebral disc and the hands grasping the load, and lifting repetitions per work day. The LiFFT risk probabilities are interpreted as low-risk:<25%; moderate-risk: 25% to 50%; and high-risk:>50%.
The OSU LBD Risk Model and LiFFT assessment methods both utilize the peak external load moment to assess each lifting condition (the largest external moment from either the lift origin or lift destination). Thus, for the NIOSH Lifting Equation, this study utilized only the maximum LI values, which were the LI values for lift origin since the lift origin for the four different horizontal distances were all farther from the subject (i.e., larger external moment) compared to the lift destination which was positioned directly in front of the subject.
Descriptive statistics were derived for each assessment method outcome as a function of vertical zone and horizontal zone-distance. To compare the differences between outcomes from the three assessment methods (i.e., OSU LBD Risk Model, NIOSH Lifting Equation, and LiFFT) it was necessary to normalize the outcomes as the outcomes of the three risk assessment methods are based on different scales. For each assessment method the outcome values from all subjects were normalized to score values ranging from 0.0 to 1.0, using Equation 3.
A three-way repeated-measures Analysis of Variance (ANOVA) was utilized to determine if the dependent variable (i.e., normalized scores of the LBD risk outcomes) is sensitive to the independent variables. The independent variables included assessment method (i.e., OSU LBD Risk Model, NIOSH Lifting Equation, and LiFFT), vertical zone, and horizontal zone-distance. Partial eta squared (ηp2) values were determined with the ANOVA to determine the effect size of each independent variable and their interactions upon the changes in the dependent variable. Tukey Honestly Significant Difference follow-up post-hoc tests were carried out on significant main effects and significant interactions to determine the differences between the levels of each independent variable.
Kendall’s Coefficient of Concordance (Kendall’s W) was utilized to measure the normalized risk score agreement among the assessment methods. Kendall’s Coefficient W values range from 0.0 to 1.0. Kendall’s W of 0.0 showing perfect disagreement, and Kendall’s W of 1.0 showing perfect agree-ment.
The Spearman rank-order correlation coefficient was utilized to measure the strength and direction of association that exists between the normalized LBD risk scores between the different assessment methods. The Spearman correlation coefficient ρ values range from +1.0 to –1.0 where a ρ value of –1.0 implies a perfect negative association of ranks, a ρ value of 0.0 implies no association between ranks, and a ρ value of +1.0 implies a perfect positive association ofranks.
All statistical analyses were performed utilizing IBM SPSS Statistics (Version 28) predictive analytics software.
Descriptive statistics (mean, standard deviation) of the three assessment method outcomes (i.e., OSU LBD Risk probability, NIOSH Lift Index, LiFFT Risk probability) as a function of the horizontal zone and vertical zone are shown in Table 2.
Mean (standard deviation) low back disorder assessment outcomes as a function of horizontal zone– distance and vertical zone.
Mean (standard deviation) low back disorder assessment outcomes as a function of horizontal zone– distance and vertical zone.
Figure 4 shows the mean OSU LBD Risk probability values as a function of horizontal zone– distance and vertical zone. The horizontal red line represents risk probability threshold between low risk (≤30%) and moderate risk (>30% to 70%). The mean LBD Risk probabilities at the ACGIH TLV weights for the knuckle to shoulder zone were in the low-risk category. For the mid-shin to knuckle vertical zone both extended horizontal zone distances were also in the low-risk category whereas the mean LBD Risk probabilities for the intermediate horizontal zone distances were slightly above the low-risk threshold of 30%.
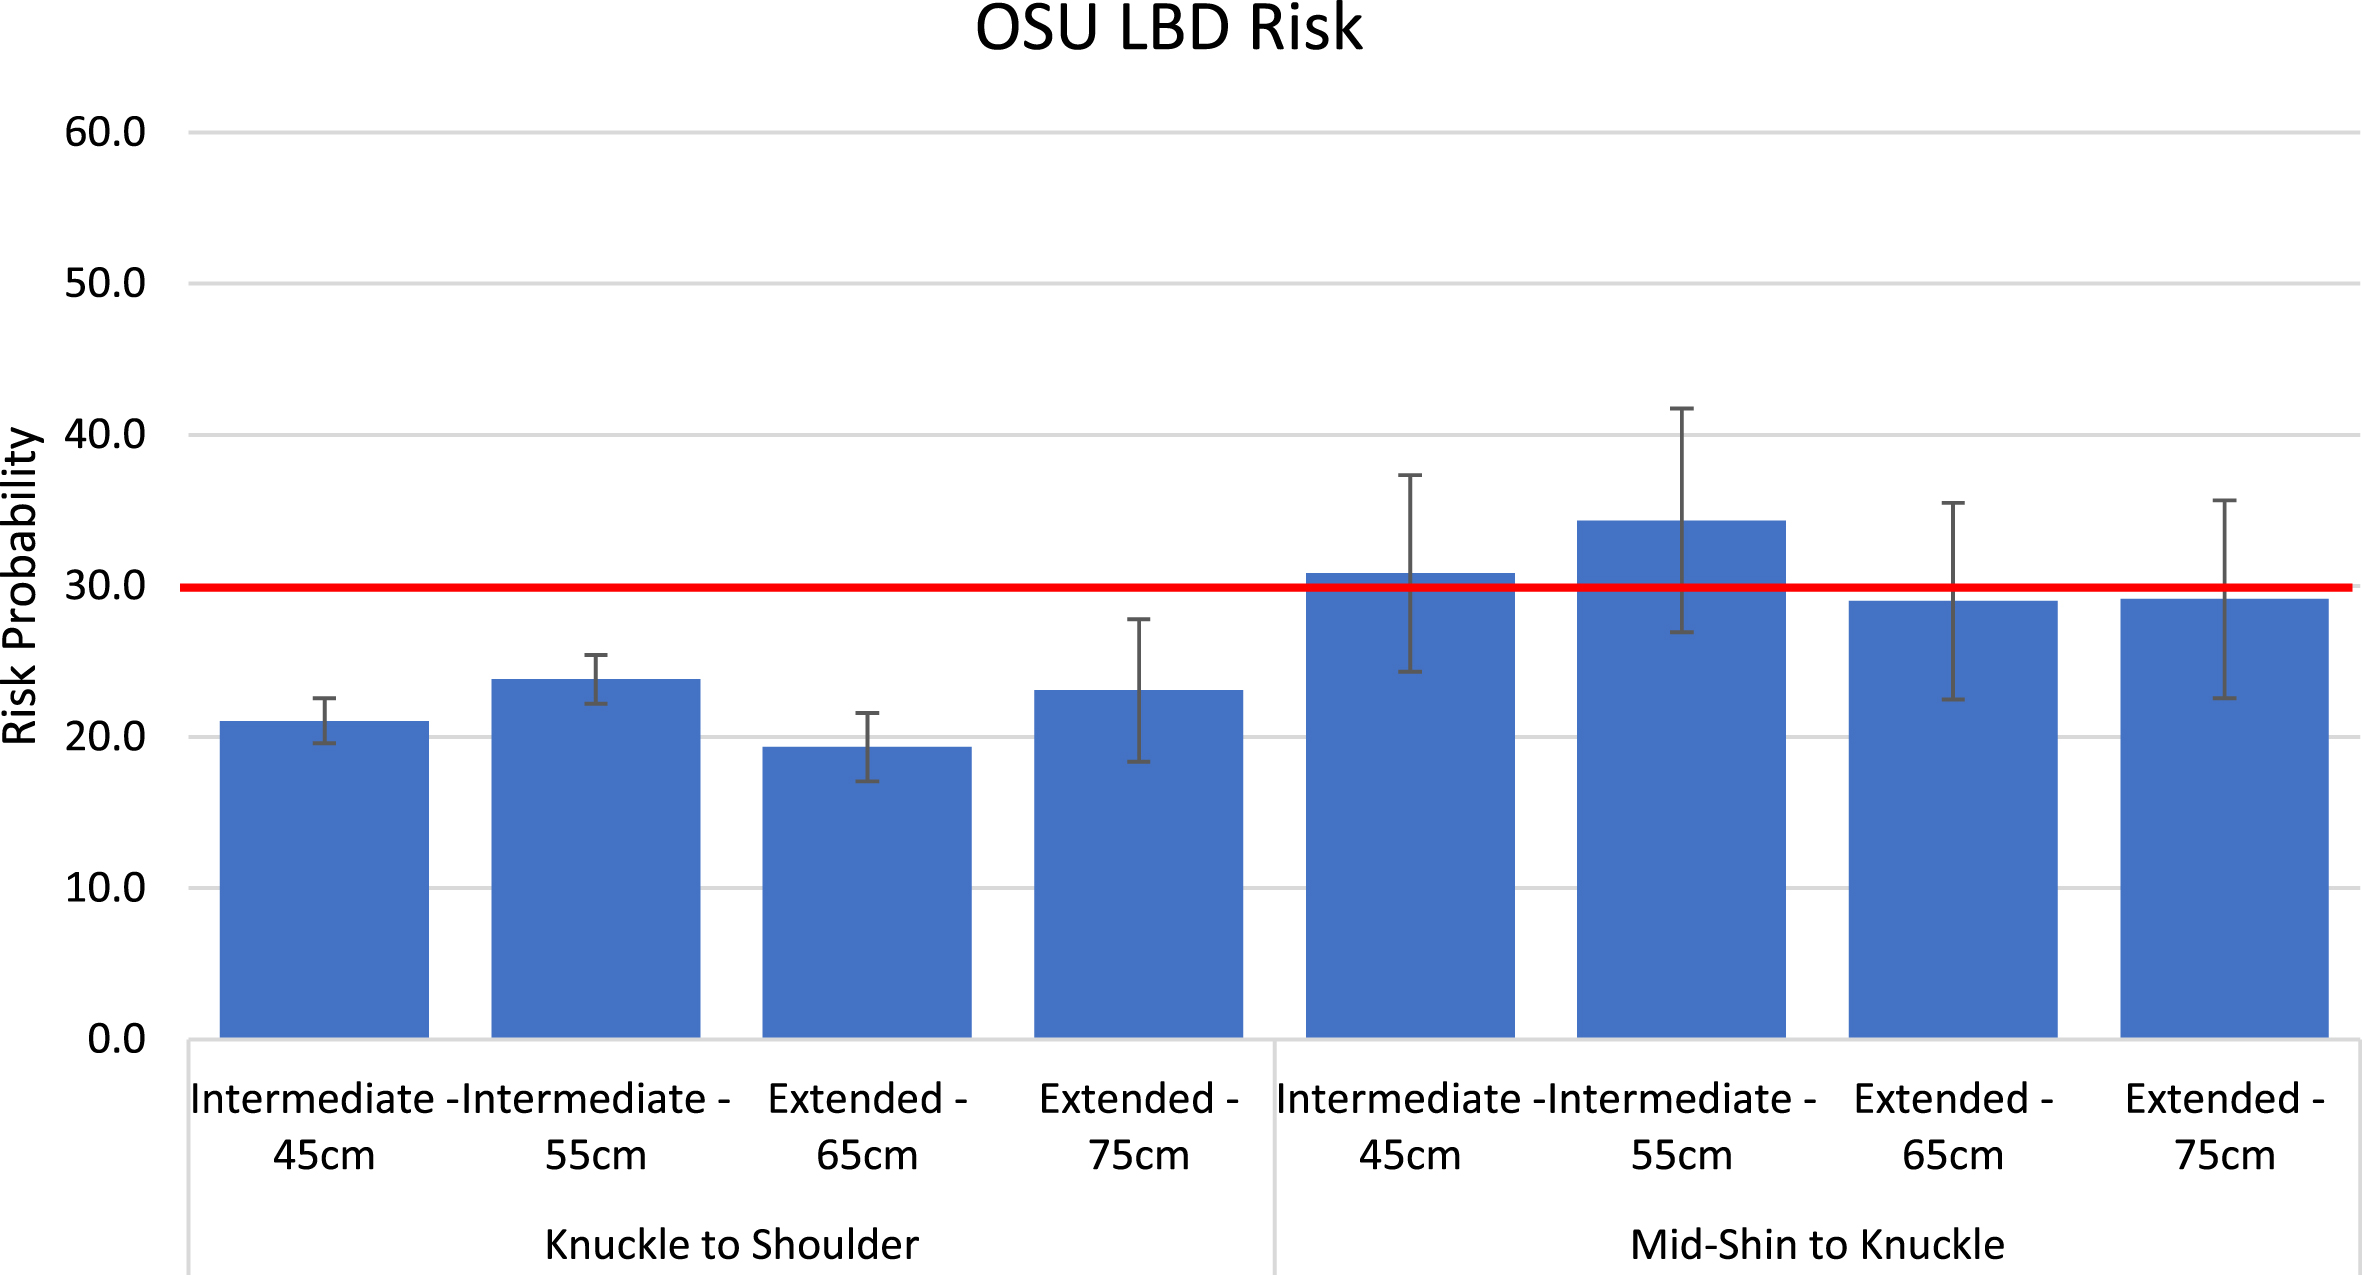
Mean OSU LBD Risk probability values as a function of vertical zone and horizontal zone– distance (error bars represent±1.0 standard deviation).
Figure 5 shows the mean NIOSH Lifting Equation Lift Index as a function of horizontal zone– distance and vertical zone. The horizontal red line represents Lift Index threshold between low risk (≤1.0) and moderate risk (>1.0 to 3.0). The mean Lift Index values at the ACGIH TLV weights for the knuckle to shoulder zone were in the moderate risk category for all horizontal distance locations (LI’s ranging from 1.41 to 2.14) as well as the intermediate horizontal distance locations (LI’s of 1.31 and 1.6) in the mid-shin to knuckle vertical zones. Only the extended horizontal distance in the mid-shin to knuckle vertical zone resulted in low-risk Lift Index’s (0.52 and 0.64).
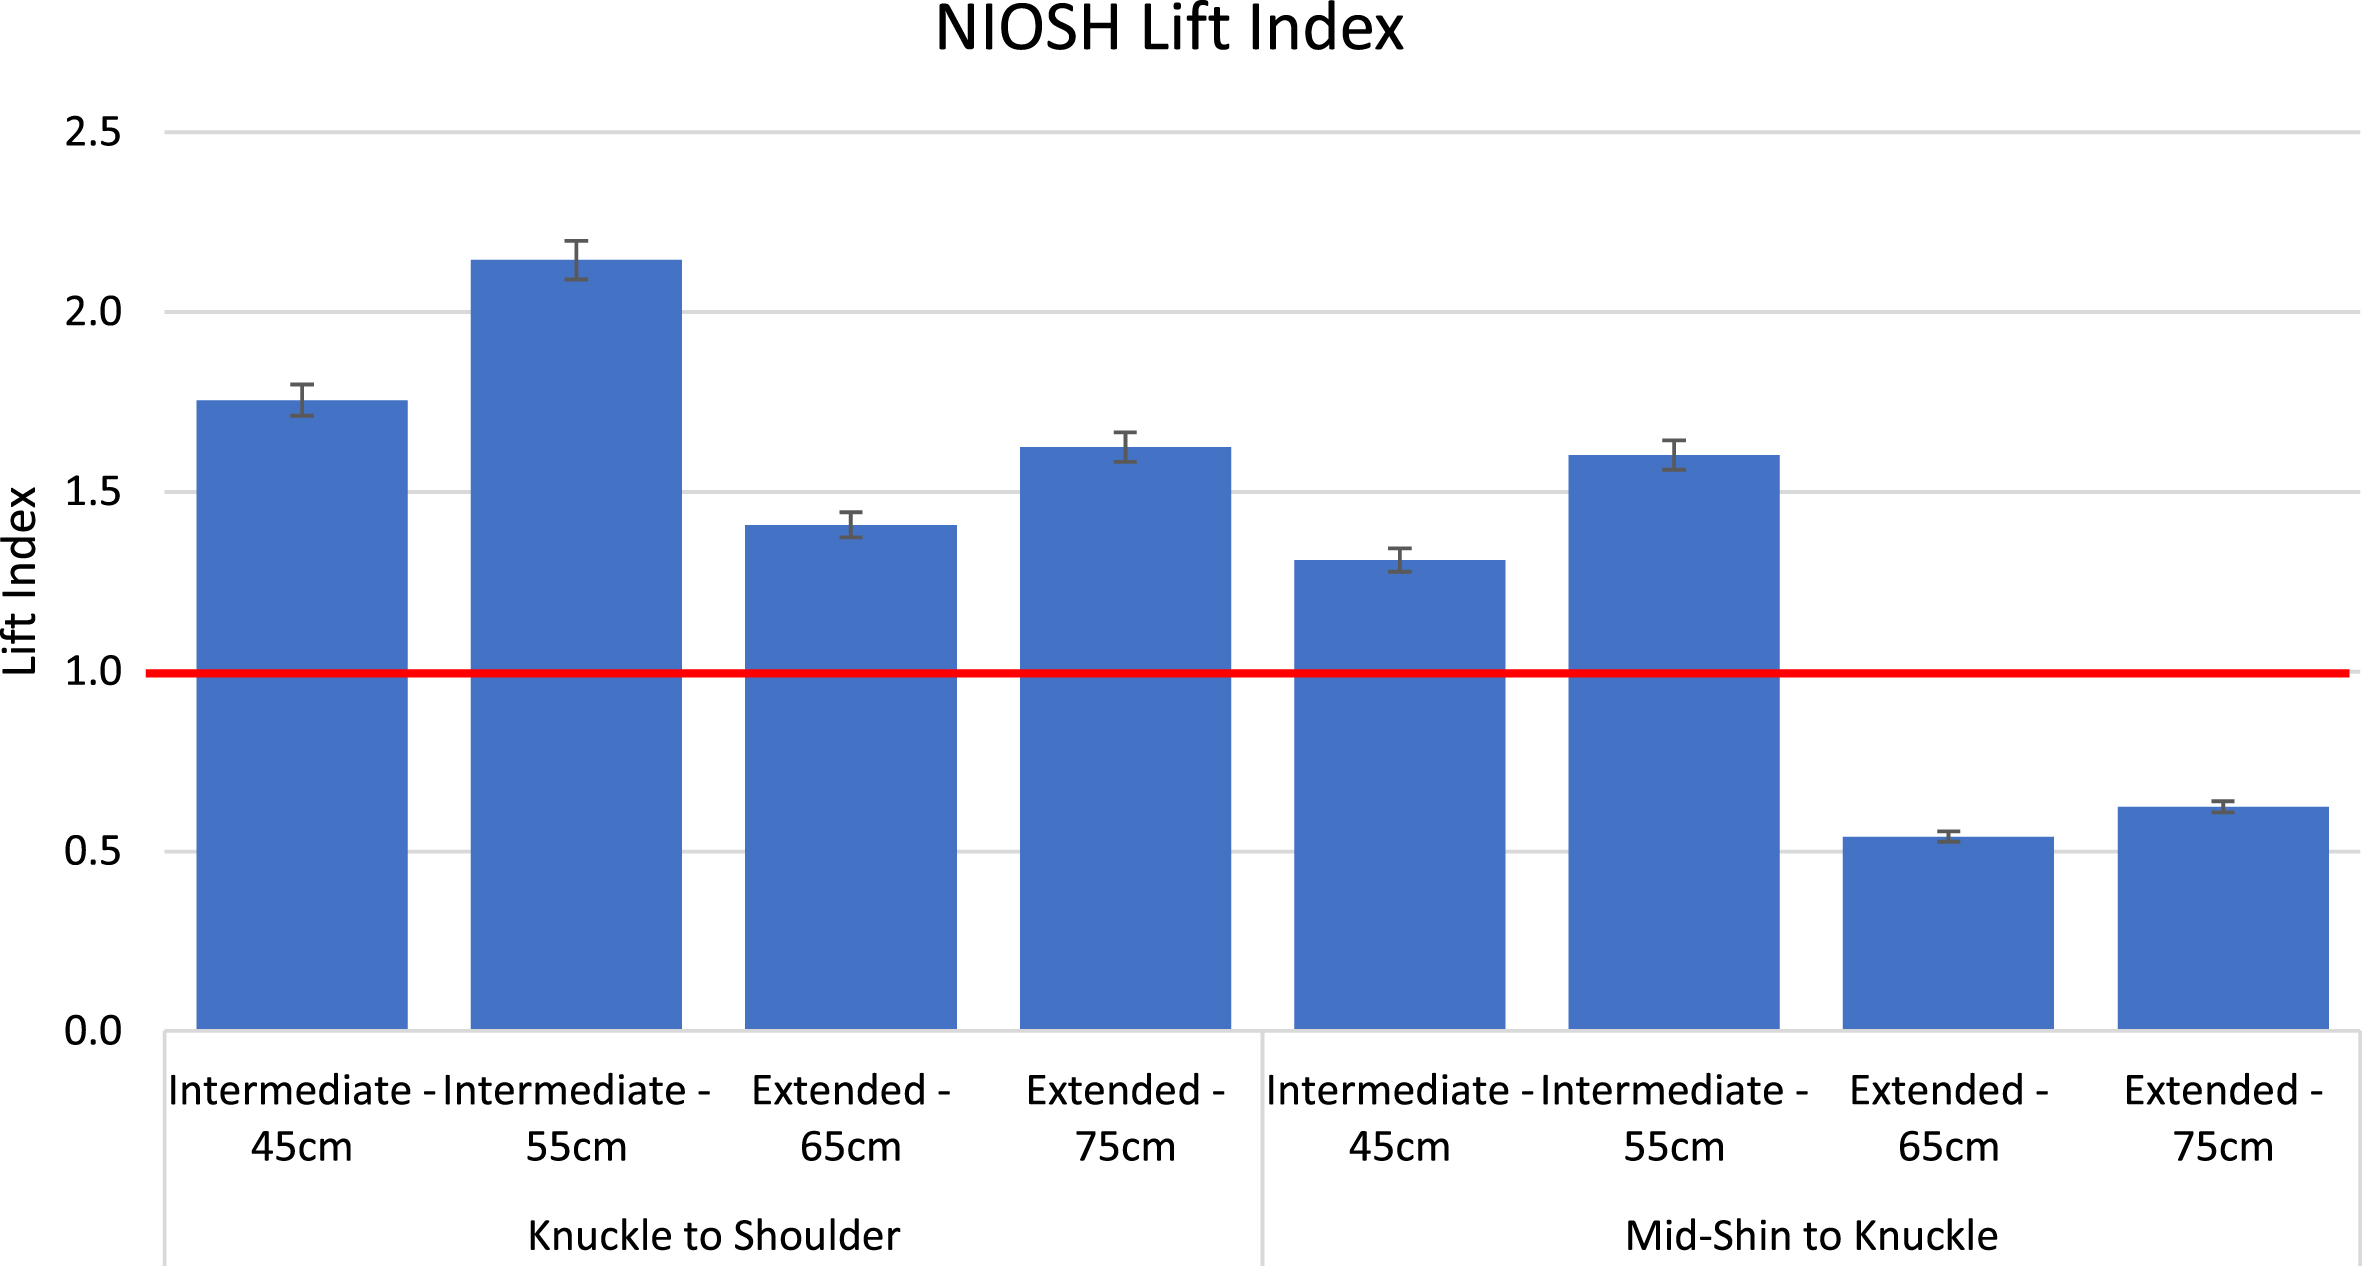
Mean NIOSH Lifting Equation Lift Index values as a function of vertical zone and horizontal zone– distance (error bars represent±1.0 standard deviation).
Figure 6 shows the mean LiFFT LBD Risk probability values as a function of horizontal zone– distance and vertical zone. The horizontal red line represents risk probability threshold between low risk (≤25%) and moderate risk (>25% to 50%). All LiFFT LBD Risk probability values were in the moderate risk category, ranging from 40.7% to 47.2% in the knuckle to shoulder vertical zone, and 34.1% to 44.1% in the mid-shin to knuckle vertical zone.

Mean LiFFT LBD Risk probability values as a function of vertical zone and horizontal zone– distance (error bars represent±1.0 standard deviation).
The three-way ANOVA (see Table 3) shows a significant effect (p < 0.001) of the main effects (i.e., vertical zone; horizontal distance; assessment method), their two-way interactions, and three-way interaction upon the dependent variable (i.e., normalized scores of the LBD risk outcomes). The largest effect size for the main effects was for the horizontal distance factor (ηp2 = 0.676), followed by the assessment method factor (ηp2 = 0.526). The vertical zone and assessment method two-way interaction effect size was the largest (ηp2 = 0.684) compared to the other interactions.
Three-way ANOVA
Figure 7 shows the statistically significant differences in the normalized LBD risk scores as a function of the vertical zone. In the knuckle to shoulder vertical zone the normalized scores from the OSU LBD Risk Model were significantly different than those from NIOSH Lifting Equation and LiFFT, whereas there were no significant differences in the normalized LBD risk scores between any of the assessment methods in the mid-shin to knuckle vertical zone. The normalized LBD Risk scores also varied significantly as a function of the assessment method and horizontal zone-distance. As shown in Fig. 8, only the normalized OSU LBD Risk scores were significantly less than the NIOSH Lift Index at the 45 cm and 55 cm distances in the intermediate horizontal zone. In the extended horizontal zone there were no significant differences between any of the assessment methods at either the 65 cm or 75 cm distances. Finally, the normalized LBD risk scores varied significantly as a function of assessment method, vertical zone and horizontal zone– distance. In the knuckle to shoulder vertical zone all three assessment methods resulted in normalized LBD risk scores that were significantly different from each other with the OSU LBD Risk assessment method resulting in the lowest normalized values and the NIOSH Lifting Equation resulting in the highest normalized values (Fig. 9). In the mid-shin to knuckle vertical zone all three assessment methods resulted in normalized LBD Risk scores that were all significantly different from each other in the extended horizontal zone (65 cm and 75 cm distances) with the LiFFT resulting in the lowest normalized LBD Risk scores and the OSU LBD Risk model scores being significantly greater than the other two assessment methods. There were no significant differences in the normalized LBD Risk scores between any of the assessment methods in the intermediate horizontal zone in the mid-shin to knuckle vertical zone (Fig. 9).

Mean normalized LBD risk scores as a function of vertical zone by assessment method. Within each vertical zone conditition assessment methods with different letters are significantly different from each other. Error bars represent±1.0 standard deviation.

Mean normalized LBD risk scores as a function of horizontal distance by assessment method. Within each horizontal zone-distance conditition assessment methods with different letters are significantly different from each other. Error bars represent±1.0 standard deviation.

Mean normalized LBD risk scores as a function of vertical height, horizontal zone– distance and assessment method. Within each horizontal zone-distance conditition assessment methods with different letters are significantly different from each other. Error bars represent±1.0 standard deviation.
The nonparametric Kendall’s Coefficient of Concordance test resulted in a Kendall’s W value of 0.477 with a p-value < 0.001. Thus, the null hypothesis is rejected, and it can be concluded that the normalized LBD risk outcomes from the three assessment methods (OSU LBD Risk Model, NIOSH Lifting Equation, and LiFFT) have a moderate agreement (W = 0.477, p < 0.001). The Spearman Rank-Order Correlation Coefficient tests (see Table 4) showed a significant moderate negative correlation (ρ= –0.240; p < 0.001) between the normalized outcomes of the OSU LBD Risk Model and NIOSH Lifting Equation, a significant strong positive correlation (ρ= 0.886; p < 0.001) between the normalized outcomes of NIOSH Lifting Equation and LiFFT, whereas a nonsignificant correlation (ρ= –0.001; p = 0.990) was shown between the normalized outcomes of the OSU LBD Risk Model and LiFFT.
Spearman Rank Order Correlation Coefficients (ρ)
Since its release in 2004 the ACGIH TLV for Lifting has gained popularity in use by ergonomics practitioners for the assessment of MMH activities [17–19], and by researchers quantifying manual materials handling exposures in epidemiological investigations [20, 21]. Although its use has increased, little is known regarding the relationship of the TLVs and actual risk of low back pain from MMH. As such, the objectives of this research were to compare the ACGIH defined TLV ‘safe’ load weights to outcomes from MMH assessment methods which have had previous validation efforts. This approach also allowed for comparison between three validated MMH assessment methods with respect to their patterns of outcomes at the various horizontal and vertical lifting origins at the ACGIH defined TLV ‘safe’ load weights. The main findings from this study indicate that all three validated MMH assessment methods resulted in method-specific defined moderate- and low-risk outcomes at the ACGIH defined TLV ‘safe’ load weights. Additionally, there was moderate agreement (W = 0.477, p < 0.001) collectively among the three MMH assessment methods with respect to method assessment outcome changes at the different vertical and horizontal zones investigated, however, there were also differences between specific assessment method outcomes as well.
As previously discussed, the ACGIH TLVs represent the weight of an object that nearly all workers may be repeatedly exposed to without developing work-related LBP [15], none of the three validated MMH assessment methods found outcomes in a method-specific defined high-risk category, and the extended horizontal zone in the mid-shin to knuckle vertical zone was identified as low-risk (OSU LBD Risk Model, NIOSH Lifting Equation) or demonstrated the lowest method-specific risk outcome (LiFFT). There were differences, however, among the assessment methods with respect to the actual assessment-method defined risk categories for the different horizontal-vertical zone combinations. For the OSU LBD Risk Model, the majority of the horizontal-vertical zone combinations were in the method-defined low-risk category (<30%), where only the intermediate horizontal zone distances of 45 cm (30.8% probability) and 55 cm (34.3% probability) in the mid-shin to knuckle vertical zone were moderate-risk. These results are not particularly surprising as the TLVs in the ACGIH TLV assessment method were derived, in part, based on weights reflective of low-risk jobs from the research that developed the OSU LBD Risk Model [14, 18].
The resulting Lift Index’s from the NIOSH Lifting Equation when lifting the TLV weights were all in the NIOSH-defined moderate-risk category (>1.0 to 3.0) except for the 65 cm (LI = 0.54) and 75 cm (LI = 0.62) horizontal distances in the extended zone within the mid-shin to knuckle vertical zone. Although none of the resulting Lift Index’s were in the NIOSH-defined high-risk category (LI > 3.0), the resulting moderate-risk Lift Index’s may be consistent with evidence that the Revised NIOSH Lifting Equation is a highly sensitive assessment method. In a comparison of Lift Index values to MMH jobs with demonstrated high-risk and low-risk for low back disorders, [28] reported that the NIOSH Lifting Equation [11] possesses a fairly high level of sensitivity (73%) with a lower specificity (55%). Thus, according to [28], the Lift Index from the NIOSH Lifting Equation does a fairly good job of identify jobs that truly demonstrate high-risk for low back disorders (73% sensitivity), but it also classifies many low-risk jobs as false-positives, or incorrectly possessing elevated risk (55% specificity).
The LiFFT assessment method [27] identified all horizontal-vertical zone combinations as possessing this method-specific defined moderate-risk (>25% to 50% probability), with the lowest probabilities at the 65 cm (34.1% probability) and 75 cm (34.9% probability) distances (extended horizontal zone) in the mid-shin to knuckle vertical zone. The LiFFT assessment method is based on the concept of fatigue failure theory, where cumulative damage (CD) to the soft tissues of the motion segments of the spine are thought to increase the risk of injury [27]. The LiFFT assessment was validated in part based on a CD threshold of 0.03 with CDs > 0.03 demonstrating high-risk for injury, utilizing a database of high- and low-risk jobs [14]. Although LiFFT was shown to have moderate sensitivity (50%) indicating half of true low-risk jobs were identified as high-risk, it was shown to do a very good job of identifying jobs that are truly low-risk (specificity of 90%) as well as a high probability of truly being high-risk if the CD is greater than 0.03 (positive predictive value of 0.82). In the current study, none of the probability outcomes across all horizontal and vertical zones were considered high-risk. Thus, based on this finding and results from validation efforts for LiFFT, this suggests that the TLV-defined weights are consistent with LiFFT in not possessing high-risk for low back pain.
This study also found that there was moderate agreement in the magnitude and direction of the outcomes across all three assessment methods shown by a Kendall’s coefficient of concordance (W = 0.477, p < 0.001), however, there were also similarities and contrasts between specific assessment methods as demonstrated by the Spearman ranked correlation coefficients and the ANOVA on the normalized outcomes. The largest significant correlation was between LiFFT and the NIOSH Lifting Equation (ρ= 0.886; p < 0.001). Inspection of the significant three-way interaction from the ANOVA (Fig. 9) on the normalized outcome values indicates that the Lift Index’s and LiFFT probability values follow a similar pattern across all zones, where the Lift Index was either always significantly greater than the LiFFT probability or there were no significant differences. Given that LiFFT and the NIOSH Lift Index identified most horizontal and vertical zones as moderate-risk, there is consistency between these two assessment methods in risk-classification at the ACGIH-defined TLVs.
Different patterns emerged when comparing OSU LBD Risk Model outcomes to the NIOSH Lift Index’s (ρ= –0.240; p < 0.001) and LiFFT outcomes to the OSU LBD Risk Model outcomes (ρ= –0.001; p = 0.990). As can be seen in Fig. 9 there was little consistency in the magnitude of the normalized outcomes between LiFFT and the OSU LBD Risk Model (OSU < LiFFT in knuckle to shoulder vertical zone; OSU not different from LiFFT in intermediate horizontal and mid-shin to knuckle vertical zone; OSU > LiFFT in extended horizontal and mid-shin to knuckle vertical zone). Thus, while both of these assessment methods indicated the ACGIH-defined TLVs possessed less than high-risk for LBD, the actual magnitude of the normalized outcome for these two assessment methods is different depending on the horizontal-vertical zone of the origin of the lift. A similar pattern was seen between the NIOSH Lifting Equation and the OSU LBD Risk Model normalized outcomes, with even larger differences between the normalized outcomes between these two assessment methods compared to the magnitude of normalized outcomes between LiFFT and the OSU LBD Risk Model.
Finally, although the ACGIH TLV for Lifting has previously been compared to other MMH assessment methods, it is difficult to compare the results of the current study directly to findings of those prior studies. The work by [22] assessed the ACGIH TLV for Lifting and the NIOSH Lifting Equation lifting containers from different horizontal-vertical lifting origin locations where the fixed container weights were all greater than the ACGIH-defined TLVs. Not surprisingly the ACGIH TLV assessment method found elevated exposure risk, whereas consistent with the current study, results from the NIOSH Lift Index were all in the moderate-risk category. Afshari’s team [23] compared the biomechanical-based 3DSSPP L4/L5 predicted compression and A/P shear forces when lifting boxes from various horizontal-vertical zone locations at ACGIH-defined TLV weights and concluded that the ACGIH TLVs overstate the safety of the majority of lift conditions. However, none of the 95% confidence intervals for compression force were above 4500 N, which is well within the suspected 3kN – 8kN intervertebral endplate tolerance range [29] and none of the 95% confidence intervals for A/P shear force were above 472 N which are well within the suggested 700 N tolerance to shear force [30]. Thus, this suggests that the ACGIH-defined TLVs may demonstrate less than high-risk for low back disorders, consistent with the findings from the current study based on comparison with validated MMH assessment methods.
The findings of the current study must be reviewed with the following limitations. First, the current results are limited to the TLVs for the selected vertical/horizontal zone combinations only, where this research did not assess TLVs at other vertical/horizontal zone combinations such as lifting from the floor to mid-shin vertical zone, in part to reduce the risk of injury to participants. Second, the experimental lifting exertions were sagittally symmetric only. Although the TLVs apply to torso asymmetries up to 30° away from the sagittal plane the NIOSH LI and OSU LBD Risk values would likely increase if asymmetric postures of the torso were involved as torso asymmetry is an input to each of these lifting assessment methods. Also, the subjects in this study were college-aged with little to no MMH experience. Assessing experienced MMH workers may have shown different results due to differences in technique. While these results are promising when compared to validated LBP/LBD risk assessment methods it is recommended that future research engage in worksite validation of the ACGIH TLV for Lifting assessment method. Finally, future work may also utilize machine learning methods to further assess the validation of the TLVs.
Conclusions
Low back pain (LBP) continues to be a leading cause of disability and healthcare costs. It is essential to evaluate workplaces and working conditions for potential ergonomic risk factors. ACGIH TLV for lifting provides low-risk weights (TLVs) to be used in various lifting conditions. Risk assessment outcomes from three validated ergonomic assessment methods were compared to the low-risk level that is believed to be associated with handling the ACGIH TLVs. The study findings showed that all the assessment methods indicated the ACGIH-defined TLVs possessed less than high-risk for LBD. The OSU LBD Risk Model agrees very much with the low-risk for LBD as defined in the ACGIH TLV lifting guidelines. The majority of the NIOSH Lifting Equation and LiFFT risk assessment outcomes were in the moderate-risk level. The highest correlation (ρ= 0.886; p < 0.001) was observed between the NIOSH Lifting Equation and LiFFT methods risk assessment outcomes. A moderate agreement (W = 0.477, p < 0.001) was observed between the LBD risk outcomes from the three validated ergonomic risk assessment methods.
Ethical approval
Ethical approval was obtained from the Wichita State University Institutional Review Board for Human Subjects Research (IRB#1757).
Informed consent
Informed consent was obtained from all participants prior to participation.
Conflict of interest
The authors declare no conflict of interest.
Funding
This research received no external funding.