
Abstract
Beam hardening causes cupping and streaking artifacts in computed tomographic images, the presence of such artifacts can impair both qualitative and quantitative analysis of the reconstructed data. When the scanned object is composed of a single material, it is possible to correct beam hardening artifacts using the linearization method. However, for multi-material objects, an iterative segmentation-based correction algorithm is needed, which is not only computationally expensive, but may also fail if the initial segmentation result is poor. In this study, a new multi-material linearization beam hardening correction method was proposed and evaluated. The new method is fast and implemented in the same manner as a mono-material linearization. The correction takes approximately 0.02 seconds per projection. Although facing a potential disadvantage of requiring attenuation measurements of one of the object’s constituent materials, applying the new method has demonstrated its capability for a multi-material workpiece with substantial reduction in both cupping and streaking artifacts. For example, the study showed that the absolute cupping artefacts in steel, titanium and aluminum spheres were reduced from 22%, 20% and 20% to 5%, 1% and 0%, respectively.
Introduction
X-ray computed tomography (XCT) is a non-destructive radiographic scanning technique for imaging cross-sectional images of an object. XCT has a vast number of industrial, scientific and medical applications. Concerning its scientific and industrial applications, it is a popular method for visualizing composite and additively manufactured parts for the purpose of defect detection and failure analysis, it is also used to inspect historical artifacts that are in danger of degradation, or may be too rare or fragile to measure using tactile or destructive techniques. XCT is used at various stages of product verification in manufacturing industries, whether these be mechanical parts, medical devices or electronic components, to name but a few manufacturing sectors. Tomographic data is typically visualized using volume rendering techniques, this allows the internal structure of an object to be inspected visually or segmented for further quantitative analysis, such as evaluating dimensional measurements from the part’s internal and external surfaces [1].
The quality of CT data is influenced by a number of factors, such as: the geometric alignment of the system hardware, the size and drift of the X-ray focal spot, and the CT scan settings. One factor that has caused problems since the introduction of XCT is beam hardening [2]. Beam hardening causes artifacts (artificial features) in the reconstructed data, these are typically cupping and streaking artifacts. These artifacts degrade the quality of CT data by obscuring features of interest or hindering image processing algorithms such as segmentation or feature detection; beam hardening has also been shown to influence dimensional measurements evaluated from CT data [3–5]. Examples of cupping and streaking artifacts are shown in Fig. 1.

CT image of two metallic spheres showing cupping and streaking artifacts. The line profile corresponds to the central pixel row of the CT image and highlights these artifacts.
As a collimated beam of X-rays passes through a material object, X-rays are attenuated. For X-rays of a single energy X-ray attenuation is a linear function of material thickness, however, when the X-ray beam is composed of polychromatic X-rays the relationship between attenuation and material thickness becomes non-linear, this is due to a phenomena known as beam hardening. Lab-based XCT systems employ X-ray sources that emit polychromatic X-rays. The polychromatic X-rays generated by these sources have a broad energy distribution, with the lower energy (soft) X-rays being preferentially absorbed by a material object than higher energy (hard) X-rays. As a consequence of this, the mean energy of a beam of polychromatic X-rays will increase as it propagates through a material object, the beam will become more penetrating and is said to become harder, hence beam hardening.
Most reconstruction algorithms neglect the presence of beam hardening and assume X-ray attenuation is a linear function of material thickness. As a consequence of this simplification, beam hardening leads to artifacts in the reconstructed data. Fourier-based reconstruction algorithms are based on the inverse Radon transform which can be used to reconstruct an object from its line integrals [6]. Hence, by assuming X-ray attenuation measurements of an object represent its line integrals, the material distribution of the object can be reconstructed. However, this assumption only holds true when monochromatic X-rays are used and when scattered radiation is negligible, this is shown by the Beer-Lambert law of attenuation:
If polychromatic attenuation is given to a reconstruction algorithm that is expecting monochromatic attenuation then the reconstructed data will contain beam hardening artefacts. Beam hardening is more problematic for materials with high atomic numbers and densities, since as these properties increase the material becomes more X-ray absorbing. Beam hardening artefacts are more complex for objects with complex geometries, for example, a mono-material rod will present simple cupping artefacts, whilst a cast engine block or an additively manufactured part will present highly complex combinations of cupping and streaking artifacts.
Beam hardening can be addressed in a number of ways. A simple way to reduce beam hardening is to place a piece of material between the source and the object, termed a pre-object filter [8–11]. The filter absorbs soft X-rays such that a harder beam falls incident on the object, this reduces the subsequent beam hardening since the filter pre-hardens the X-ray beam. The disadvantage of using a filter is that it removes X-ray flux leading to nosier projections for the same source settings, this can be remedied by increasing the intensity of the X-ray beam, but this may increase the size of the X-ray focal spot which will reduce the spatial resolution of the measurement. Alternatively, the detector exposure time can be increased, but this leads to longer scan times. Another disadvantage of using a filter is that low density materials will give poor contrast when exposed with hard X-rays, so using a filter with a multi-material object composed of low density and high density materials is particularly challenging.
The classic approach to correct beam hardening artifacts is to derive a function that converts polychromatic attenuation values into monochromatic values [12]. This approach is called linearization since it converts non-linear polychromatic attenuation to linear monochromatic attenuation. The correction function is derived by measuring [13] or simulating [14] polychromatic attenuation for increasing thicknesses of material of the scanned object, by plotting these values against the desired monochromatic attenuation for the same material thickness a curve is formed that can be approximated with a polynomial function [15]. Linearization is an effective method for correcting beam hardening, although it can amplify noise in the reconstructed data [16]. One disadvantage of linearization is that measurements or simulations of polychromatic attenuation are required to derive the correction function, these are considered time consuming and inconvenient since they require either a validated simulation tool, or a reference object composed of a similar material as the scanned object. A few authors have proposed methods to derive a linearization correction function without additional measurements or simulations [17, 18].
Given that many assemblies are composed of parts of different materials and that these assemblies require XCT inspection, there is a demand for a multi-material beam hardening correction. The classic multi-material beam hardening correction [19] starts with a reconstruction of the object, the data is then segmented to identify the distribution of the object’s constituent materials, the X-ray path lengths though each material are then calculated. With this information it is possible to estimate monochromatic projections, these monochromatic projections are compared to the polychromatic projections and a correction term calculated, the correction term is added to the measured projections and the process repeated until some convergence criteria is met. This approach has been formulated in such a way that no prior knowledge of the object is required [20–22], this being a major advantage over other correction methods. However, the computational expense of multiple reconstructions, segmentations and forward projections is the method’s major disadvantage. Some effort has been made to address the method’s computational cost, namely by down-sampling the data, this has been shown not to significantly impact the quality of the correction [23]. Another limitation of the method is the segmentation of the artifact corrupted data, if the artifacts are very severe then the initial segmentation may fail leading to the entire correction to fail. As such, a new approach to multi-material beam hardening correction is proposed in this work that does not require segmentation and is not iterative in nature.
Contributions
The following contributions are made in this work. A multi-material linearization beam hardening correction is derived, Section 2. The correction is shown to remove cupping and streaking artifacts for measured data, Section 3. The method is shown to degrade the signal-to-noise ratio of the measured data, Section 3.
Method
Beam hardening artifacts are corrected for a multi-material workpiece by finding and applying a single polynomial function that converts non-linear polychromatic attenuation to linear monochromatic attenuation for multiple materials. The steps taken to derive the correction function are explained in Section 2.1. A multi-material workpiece is described in Section 2.2. Results of applying the multi-material beam hardening correction to measured data are presented in Section 3.
Deriving the multi-material beam hardening correction
To derive the multi-material beam hardening correction (MMBHC) function polychromatic X-ray attenuation is measured for four different commonly used engineering materials: nylon, aluminum, titanium, and steel. Attenuation is measured for each of these materials using cylindrical stepwedges, see Fig. 2. The measurements are conducted for material thicknesses of 2 mm to 8 mm in steps of 1 mm. The XCT system and settings used for the measurements are specified in Table 1. From the acquired projections the mean attenuation is sampled for each material thickness using a 3×3 pixel region centered on the axis of rotation of each stepwedge. The attenuation verses thickness graphs for each material are plotted in Fig. 3.
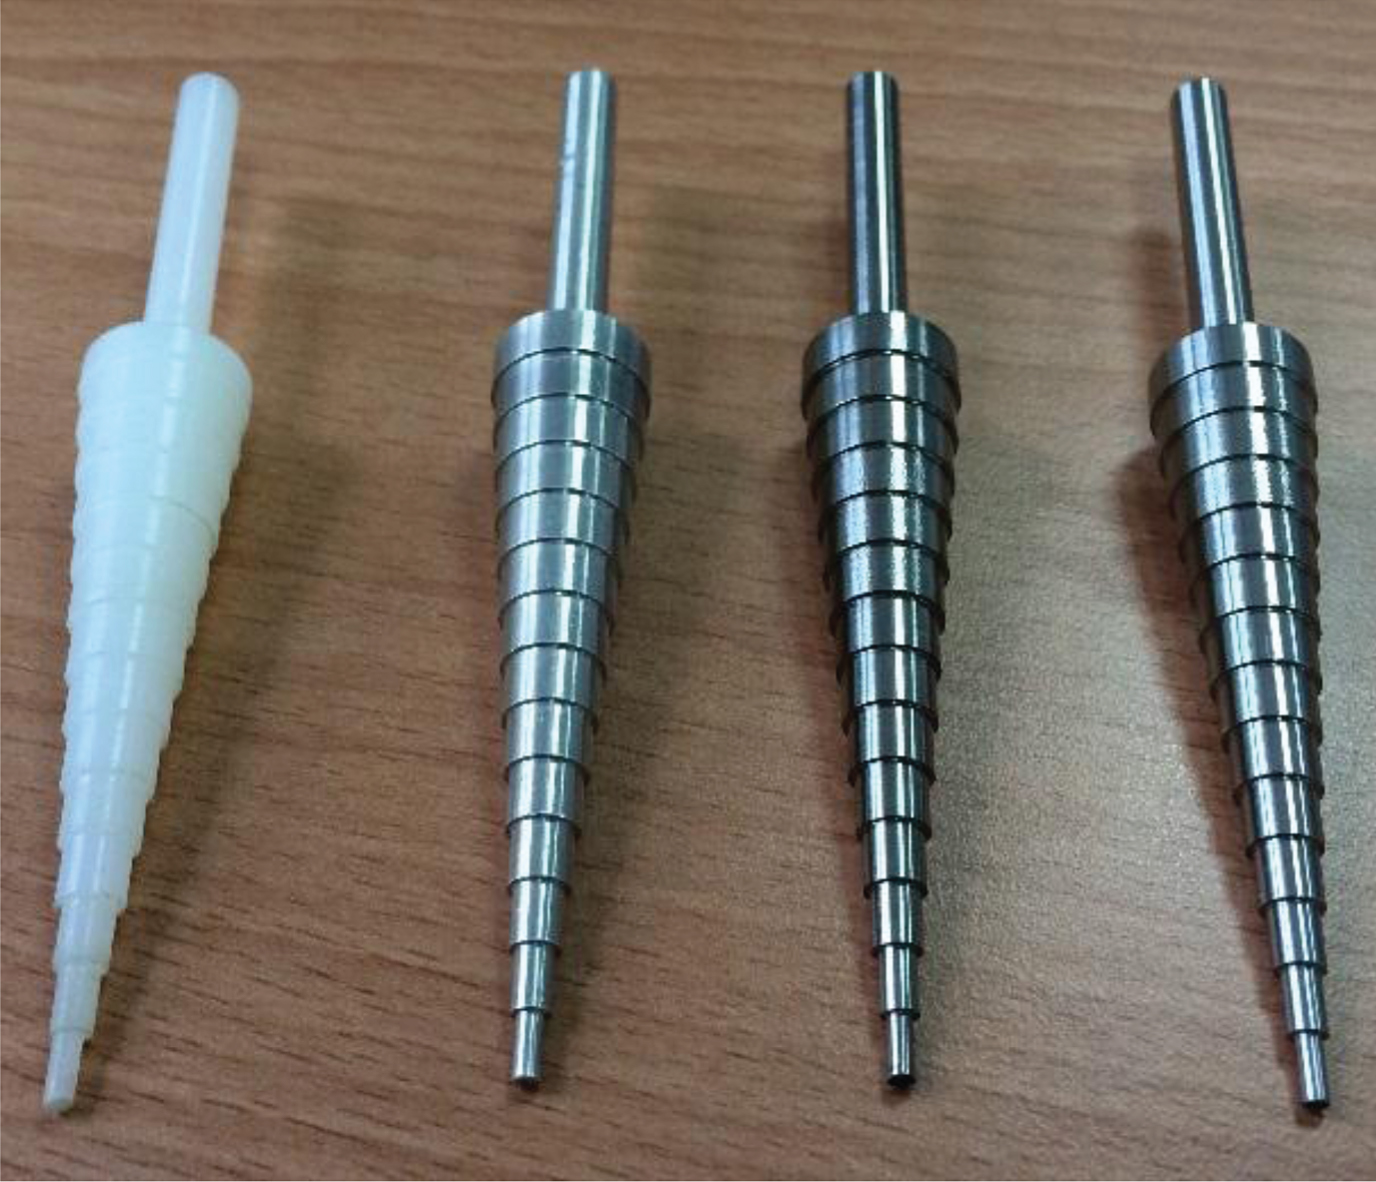
Cylindrical stepwedges used to measure polychromatic X-ray attenuation for nylon, aluminum, titanium and steel respectively.
XCT system and settings used for the polychromatic X-ray attenuation measurements
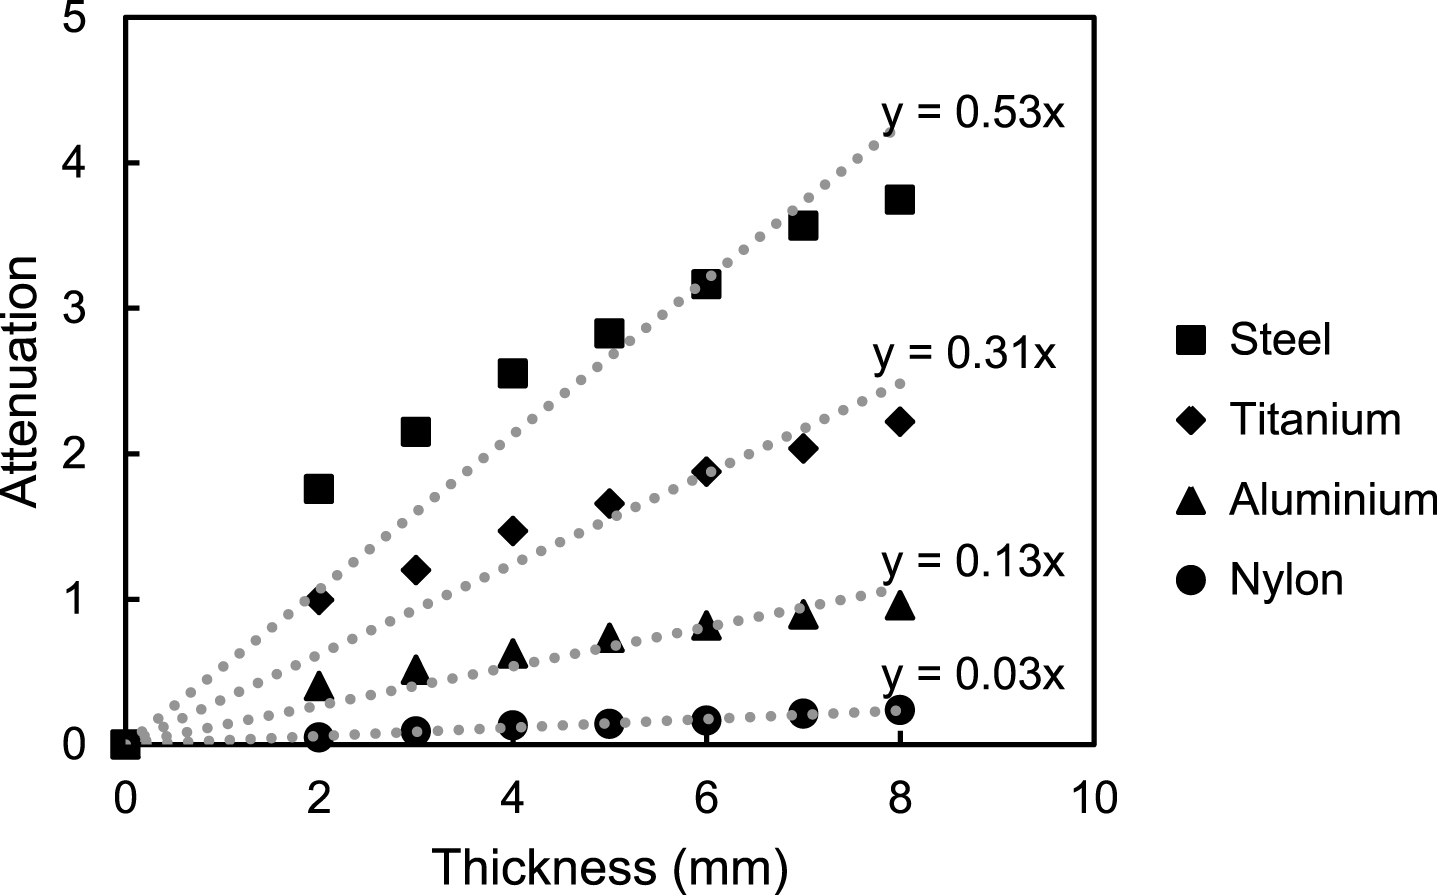
Polychromatic attenuation verses thickness measurements for: nylon, aluminum, titanium and steel.
The gradients of the straight lines fitted to each curve in Fig. 3 represent the effective linear attenuation coefficient μ for each material if monochromatic X-rays were used, these values are used to calculate the desired monochromatic attenuation values for each material using Equation 1. Plotting the measured polychromatic attenuation against the calculated monochromatic attenuation for each material results in the curves shown in Fig. 4. These curves represent the beam hardening correction required for each material. Clearly there is some difference between each of the correction curves, our key observation is this: if the values of μ are changed for each material (except steel), it is possible for all the curves to lie together on the steel correction curve, thus forming a single multi-material beam hardening correction, see Fig. 5. The altered values of μ for each material are given in Table 2. The multi-material linearization curve is approximated by fitting a 2nd order polynomial to the steel data points. Note that in order to derive the correction it is not necessary to perform attenuation measurements for all the materials, nor is it necessary to calculate the modified value of μ for each material, these steps have been included simply to illustrate the validity of the method. In practice, one would only need to measure attenuation for the material that gives rise to the highest attenuation, in this case, steel.

Beam hardening correction curves for each of the considered materials.

Beam hardening correction curves for each material after the values of μ have been altered when calculating monochromatic attenuation.
Values of μ for each material before and after adjustment
Applying a single beam hardening correction to multi-material scan data is not a new approach: in medical CT a beam hardening correction for bone is often applied to scans of the human body (a multi-material object) [24]. Only bone is considered since it is the dominating source of beam hardening in medical CT. This approach has not yet been adopted in industrial CT.
To help generalize the proposed method, polychromatic attenuation of the same four materials have been simulated at two different X-ray energies, 80 kV and 220 kV and the corresponding multi-material linearization beam hardening corrections have been derived; these are shown in Fig. 6. The X-ray source energy clearly influences the shape of the beam hardening correction curve, but as before, the correction curves for each material can be manipulated such that they all lie on the correction curve of the most attenuating material. To simulate the polychromatic attenuation, X-ray spectrums were simulated using SpekCalc [25, 26] and the NIST XCOM [27] database was used for the linear attenuation coefficients of each material.

Beam hardening correction curves for each material after the values of μ have been altered for a simulated 80 kV and 220 kV X-ray source voltages.
In order to test the derived correction a workpiece composed of the 4 considered materials is scanned, see Fig. 7. The workpiece features 4 spheres made of each material, each sphere has a nominal diameter of 8 mm and is embedded in a mount that has been 3D printed from acrylonitrile butadiene styrene (ABS). Details of the scan settings are given in Table 3, the X-ray source settings and magnification are detailed in Table 1. The projection data is reconstructed using an in-house implementation of the FDK algorithm [28], reconstruction settings are given in Table 3. The MMBHC is applied to the projection set prior to reconstruction, a dedicated algorithm is used for this. The program is implemented in MATLAB R2015b (The MathWorks Inc., Natick, MA, USA) on a desktop computer with 32 GB of RAM and a 3.6 GHz quad core processor, each projection takes approximately 0.02 s to read, process and write to file.

Multi-material workpiece, spheres of each material embedded in a 3D printed mount.
Scan and reconstruction settings for the multi-material workpiece
To compare the results of the MMBHC an additional scan of the workpiece is made with a 0.5 mm thick copper pre-filter, the X-ray source current is increased to 40μA to compensate for the reduced flux, but all other scan and reconstruction settings remain unchanged.
The central CT images for the uncorrected, corrected and pre-filtered data are shown in Fig. 8 and line profiles from these CT images are plotted in Figs. 9 and 10. Measurements of the signal-to-noise ratio (SNR) evaluated from the center of each sphere for each condition are plotted in Fig. 11. SNRs are evaluated as the quotient of the mean and standard deviation of grey values sampled from 5×5×5 voxel regions in the center of each sphere form each data set. The degree of cupping present in the data is quantified using a variation of the method give in reference [29], the mean intensity of regions in the center I C and in the periphery I P of each sphere are evaluated, the degree of cupping as a percentage is calculated as:

Central CT images for the A) uncorrected data, B) multi-material beam hardening corrected data, and C) pre-filtered data. The slice shown is above the top level of the ABS support structure.

Comparison of line profiles evaluated from the CT images in Fig. 8, the line profiles cross the steel and titanium spheres. A) uncorrected data, B) multi-material beam hardening corrected data, C) pre-filtered data, D) all data plotted on the same axes.

Comparison of line profiles evaluated from the CT images in Fig. 8, the line profiles cross the aluminum and nylon spheres.

Comparison of signal-to-noise ratios evaluated from the center of each sphere for each of the CT images in Fig. 8.
Comparing the CT images in Fig. 8: the uncorrected data in Fig. 8A shows clear streaking artifacts between the metallic spheres, whilst strong cupping artifacts are present for the steel sphere. The corrected data in Fig. 8B shows very little streaking and the cupping appears to have been removed entirely, although the nylon sphere is quite difficult to discern. Fig. 8C shows the pre-filtered data, the pre-filter reduces the streaking and cupping artifacts compared to the uncorrected case but does not remove them entirely.
The line profiles in Fig. 9 are drawn across the steel and titanium spheres since these materials induce the worst artifacts. Figure 9A shows the line profile for the uncorrected data and highlights the severity of the cupping and streaking artifacts. Figure 9B shows the line profile for the corrected data, the success of the MMBHC is clear in that the grey values are uniform for both the materials. Figure 9C shows the line profile for the pre-filtered data, some cupping is evident for the steel sphere and some streaking between the spheres is also present, this shows that more pre-filtration would be required to further suppress these artifacts. All three line profiles are plotted on the same axis in Fig. 9D, this shows that the MMBHC increases the contrast of each material, whilst pre-filtration reduces the contrast.
Figure 10 shows the line profiles drawn across the aluminum and nylon spheres for each condition. The MMBHC is able to remove the cupping artifact for the aluminum sphere but the nylon sphere appears to be obscured by noise. This result suggests the MMBHC amplifies noise in the data, this property is investigated further by considering the SNR of the data.
Figure 11 shows the SNR evaluated from the center of each sphere for each condition. For all materials the MMBHC reduces the SNR compared to the uncorrected data, however, the SNR for the MMBHC data is greater than that of the pre-filtered data. Although the MMBHC is able to increase the contrast of the data, it also acts to increase noise. Beam hardening correction is known to amplify noise in CT data [16], this being one disadvantage of using an algorithmic correction. Noise can be treated through the use of smoothing filters such as a Gaussian or a median filter, alongside other more advanced filters such as those evaluated by Huang et al. [30], however, such filters will reduce the spatial resolution of the data. Surprisingly, the SNR of the pre-filtered data is the highest for the steel and titanium spheres, this is likely due to the use of a higher X-ray source current which overcomes the reduced flux caused by the pre-filter. The SNR for the pre-filtered data drops off for the lower density materials as would be expected, this is because the harder X-ray spectrum is more penetrating and undergoes little attenuation when passing through low density materials.
Table 4 shows the cupping measurements for each material under each condition. The MMBHC reduces cupping for the steel sphere from 22% to –5%, the negative sign shows that beam hardening is slightly over corrected. When comparing the MMBHC to the pre-filtered data, the magnitude of the cupping is lower for the former. Table 4 shows the MMBHC is able to reduce cupping for all the considered materials.
Cupping measurements for different materials under different conditions
The proposed MMBHC is clearly able to reduce both cupping and streaking artifacts but at the cost of reducing the SNR of the data. Previous work has shown that linearization beam hardening corrections have this undesirable effect on the SNR [16]; addressing this unwanted property should be considered in future work. The new method is not computationally expensive and only requires attenuation measurements of the most attenuating material of the multi-material object. The time required to perform the attenuation measurements and derive the correction for an experienced user is in the order of minutes and thus the extra effort required is negligible. The new correction can be applied in exactly the same way as a mono-material beam hardening correction; many CT software companies allow users to define linearization beam hardening corrections prior to reconstruction, there is no reason why this provision shouldn’t be used to apply the multi-material beam hardening correction. The stepwedges used to measure X-ray attenuation were not made from exactly the same materials as the spheres of the test object, thus the correction is very forgiving in this respect.
Conclusions
A multi-material linearization beam hardening correction has been developed and shown to reduce cupping and streaking artifacts for a workpiece composed of steel, titanium, aluminum and nylon. The proposed correction is fast and simple to implement. The disadvantages of the method include the requirement to perform attenuation measurements and that the correction reduces the signal-to-noise ratio of the reconstructed data.
Footnotes
Acknowledgments
The author would like to thank the Singapore Institute of Manufacturing Technology (SIMTech) for the use of their X-ray computed tomography system.