
Abstract
Computed tomography (CT) plays an important role in digital rock analysis, which is a new prospective technique for oil and gas industry. But the artifacts in CT images will influence the accuracy of the digital rock model. In this study, we proposed and demonstrated a novel method to restore detector-unit-dependent functions for polychromatic projection calibration by scanning some simple shaped reference samples. As long as the attenuation coefficients of the reference samples are similar to the scanned object, the size or position is not needed to be exactly known. Both simulated and real data were used to verify the proposed method. The results showed that the new method reduced both beam hardening artifacts and ring artifacts effectively. Moreover, the method appeared to be quite robust.
Keywords
Introduction
Digital rock analysis is a new prospective technique for the oil and gas industry, where the creation of 3D digital rock model plays a foundation role [1]. CT, which can acquire 3D image of a rock non-destructively and effectively, becomes an important tool to establish digital rock model. However, the artifacts in CT images may affect the accuracy of the digital rock model. Therefore, artifact reduction of CT image is a cornerstone for digital rock analysis [2].
The artifacts frequently encountered in rock core CT images are ring artifacts and beam hardening artifacts, which are mainly caused by the inconsistent responses of detector units and the polychromatic feature of the X-ray. Besides, rock core CT images may also have so-called photon starvation artifacts [3]. Actually, a rock core typically is a cylindrical object that is thicker in the middle and thinner in the periphery. Limited by the dynamic range, the detector units corresponding to the middle part of the rock core have to suffer from photon starvation, so as to avoid count saturation for other detector units. To avoid photon starvation, attenuators are used to reduce the variation of beam intensity reached to the detector. However, such attenuators may cause the distortion of CT values [4].
Several methods are proposed to correct the artifacts mentioned above. The typical methods for ring artifact correction include flat field calibration methods [5, 6], detector shake methods [7,8, 7,8], filtering methods [9–11], and etc. Generally, they can well correct the high frequency ring artifacts, but because of the local feature of the methods, they fail to deal with low frequency distortions and banding artifacts. Typical methods for beam hardening correction include linearization methods [12–14], dual energy methods [15–20], and iterative methods [21–25]. The main idea of linearization methods and dual energy methods is to estimate a calibration function that converts the polychromatic projections into equivalent monochromatic projections. In iterative methods, the artifact correction is modeled as an optimization problem, and solved iteratively.
In this study, we propose a novel artifact correction method, which simultaneously eliminates both high and low frequency ring artifacts, beam hardening artifacts, as well as CT value distortion caused by attenuator. The idea of our method is similar to that of the linearization methods and the EDEC method [18] in some degree. But a striking difference is that we restore a set of detector-unit-dependent calibration functions that have taken both the detector unit response and the detector-unit-dependent attenuator thickness into consideration. The reference samples used to restore the calibration function are just simple objects, such as cylindrical samples. In addition, we do not need to know the sample’s shape, size or position, as long as their attenuation coefficients are similar to the scanned object. We verify our method using simulated data as well as real data of artificial and natural rock cores. Experimental results show that the artifacts are significantly reduced by our method.
Problem and model of rock core CT
In this section, we first depict the rock core CT imaging problem and build its mathematical model. A rock core CT scanner is composed of X-ray source, detector, mechanical system, attenuator, controller, and computer system. Figure 1 shows the schematic diagram of a rock core CT scanner. The CT scanning process can be modeled as
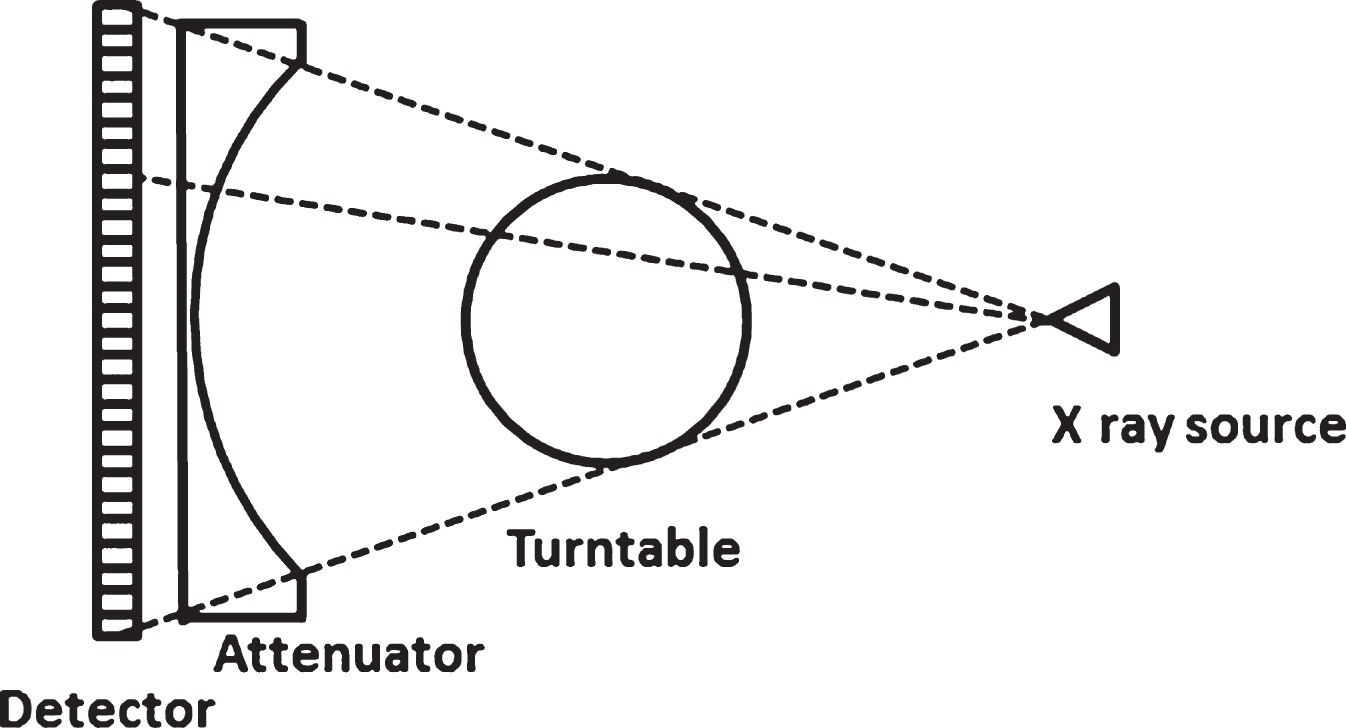
Schematic diagram of the rock core CT.
where the symbols used in the formula are described in Table 1.
Symbols used in formula (1)
Let
where σ0 (u) is the intensity of scattered photons. Then, the polychromatic projections can be written as
However, it is well-known that the commonly used CT reconstruction algorithms, such as FBP or ART are based on monochromatic assumption. Therefore, direct application of these algorithms for image reconstruction from polychromatic projections p (u, β) will face a risk of importing some artifacts into the images, such as ring artifacts and beam hardening artifacts.
In this section, we first analyze the causes of ring artifacts and beam hardening artifacts, and then propose our calibration method.
Analysis on artifact causes
Ring artifacts
If the scattered photons are ignored, then we have projections for the case of monochromatic X-ray as
A polychromatic X-ray beam is composed of individual photons with a range of energies. As the beam passes through an object, it becomes “harder”, that is to say its mean energy increases, because the lower-energy photons are absorbed more rapidly than the higher-energy photons. For a uniform cylindrical object, beam hardening usually results in a cupping artifact. In practice, a bowtie shaped attenuator (or filters) is often employed to correct the beam hardening artifacts, and also to reduce the dynamic range requirement on the detector [4]. It is noticed from (3) that the essential role of an attenuator is to modify the emission spectra I0 (E, u) of X-rays for individual detector units into the following effective spectra
Some kinds of image distortions, such as “capping” or “Mexican hat” artifacts [26], may be caused by the bowtie attenuator. According to the analysis above, the X-ray polychromatic feature is the substantial reason causing the ring artifacts and the beam hardening artifacts. To eliminate the artifacts, the polychromatic projections should be well calibrated for each detector unit.
The essence of calibration is to convert the polychromatic projections into the so called “desired data” [14], which are usually the line integral of reference material. In clinical CT, water is commonly used as such reference material, as most of body tissues have similar attenuation coefficients with water. For rock core CT, we choose aluminum serving as the reference material, since the attenuation coefficient of aluminum is similar to those of the prominent compositions of nature rock core [27], in addition, aluminum is inexpensive and easy to process.
To convert the polychromatic projections to the line integrals, a map from polychromatic projection to line integral is usually built by scanning some reference samples with different thickness. Existing methods ignore the inconsistency of the detector response, and build one unified map, which usually works fine on beam hardening artifact correction for CT systems with no attenuator, but fails to correct ring artifacts and CT value distortion. In order to correct simultaneously all the artifacts mentioned above, in this paper, we propose a method to build detector-unit-dependent maps, i.e., build one map for each individual detector unit.
Suppose that the reference sample consists of homogeneous materials with attenuation coefficient μ (E). Then its polychromatic projection is
In the following, we introduce our projection-domain-based method of estimating the detector-unit-dependent coefficients {c
n
(u) |n = 0, 1, …, N } in formula (8). For a given u, if a set of sampling data
Commonly the least squares method cannot get optimal result when the sampling data in Ω
u
are insufficient. In order to improve the performance of the least squares method, further information is needed. According to the characteristics that
Adding the conditions (11) into the model, we obtain the following constrained optimization problem:
Which can be solved with classical optimization algorithms [29]. We will call Eq. 10 unconstrained fit model (UFM), and Eq. 12 constrained fit model (CFM) in the rest of the paper. Please note that each detector unit corresponds to an optimization problem Eq. 10 or Eq. 12, and should be solved individually.
How to acquire an efficient set of data
In this study, we used CT image-based method to acquire the data set as follows: Place some simple shaped homogeneous samples, for instance, one cylindrical sample or two combined cylindrical samples, in CT platform. Scan the samples to acquire the polychromatic projections. Reconstruct the CT image from the polychromatic projections. Calculate the intersection length of X-ray through the samples from their segmented CT image.
In order to acquire the data set with a range of intersection lengths as large as possible for each detector unit u, the position and diameter of samples on the CT platform should be appropriately chosen.
In this section, both simulated data and real data are used to evaluate the performance of the proposed detector-unit-dependent calibration method. For simplify, all the experiments are involved in a fan beam CT. It is straightforward to extend the method to cone-beam CT.
Numerical simulations
In this subsection, we verify the accuracy of UFM and CFM with simulated data. The polychromatic projections of a reference sample (Fig. 3(a)) and a test sample (Fig. 5(a)) are simulated numerically according to Eq. (1), Eq. (2) and Eq. (3), where r (u) = 0, i.e., no attenuator is used. The X-ray spectrum (Fig. 2) is obtained by SpectrumGUI (see http://spectrumgui.sourceforge.net/) and the mass attenuation coefficient is obtained from NIST [30]. The Poisson noises corresponding to emission flux of 107 photons per measurement are added to the simulated data.
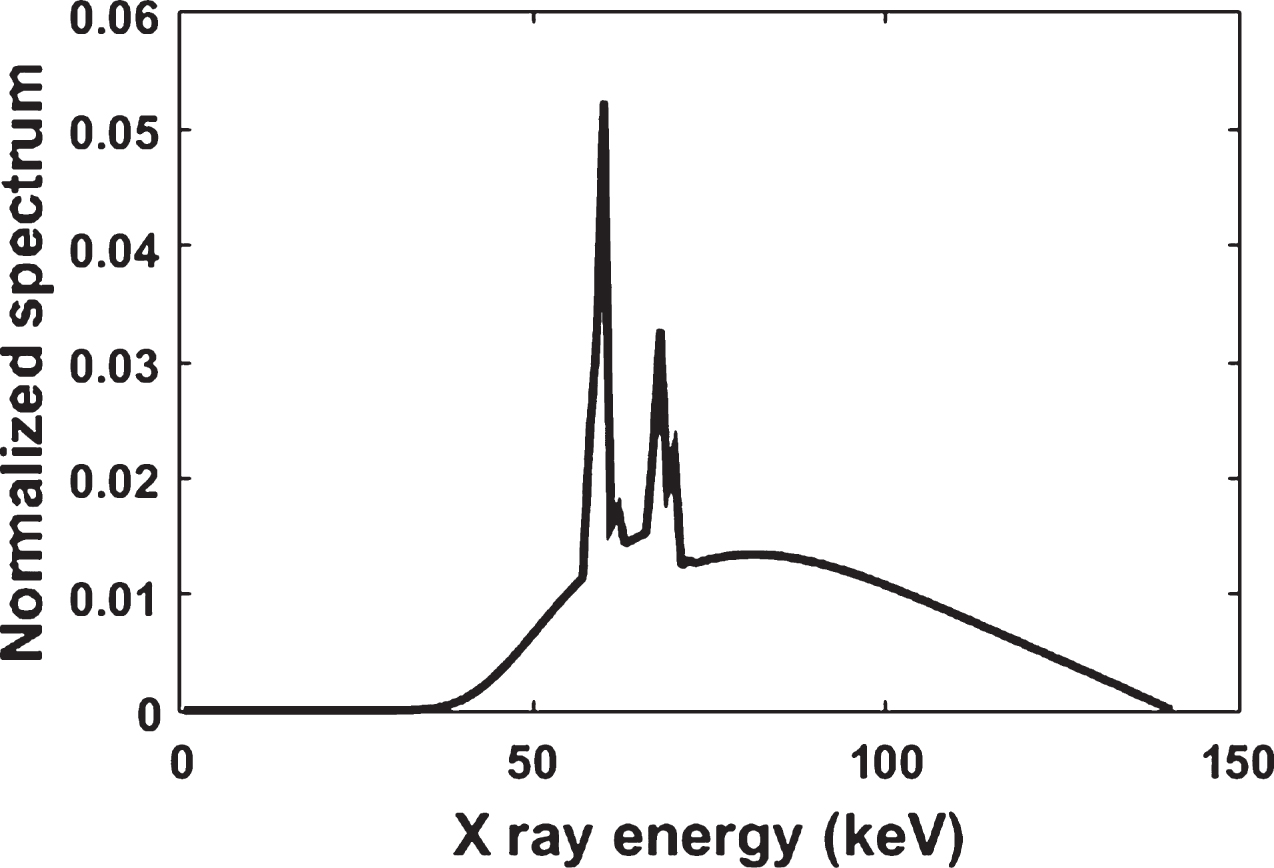
Simulated X-ray spectrum.
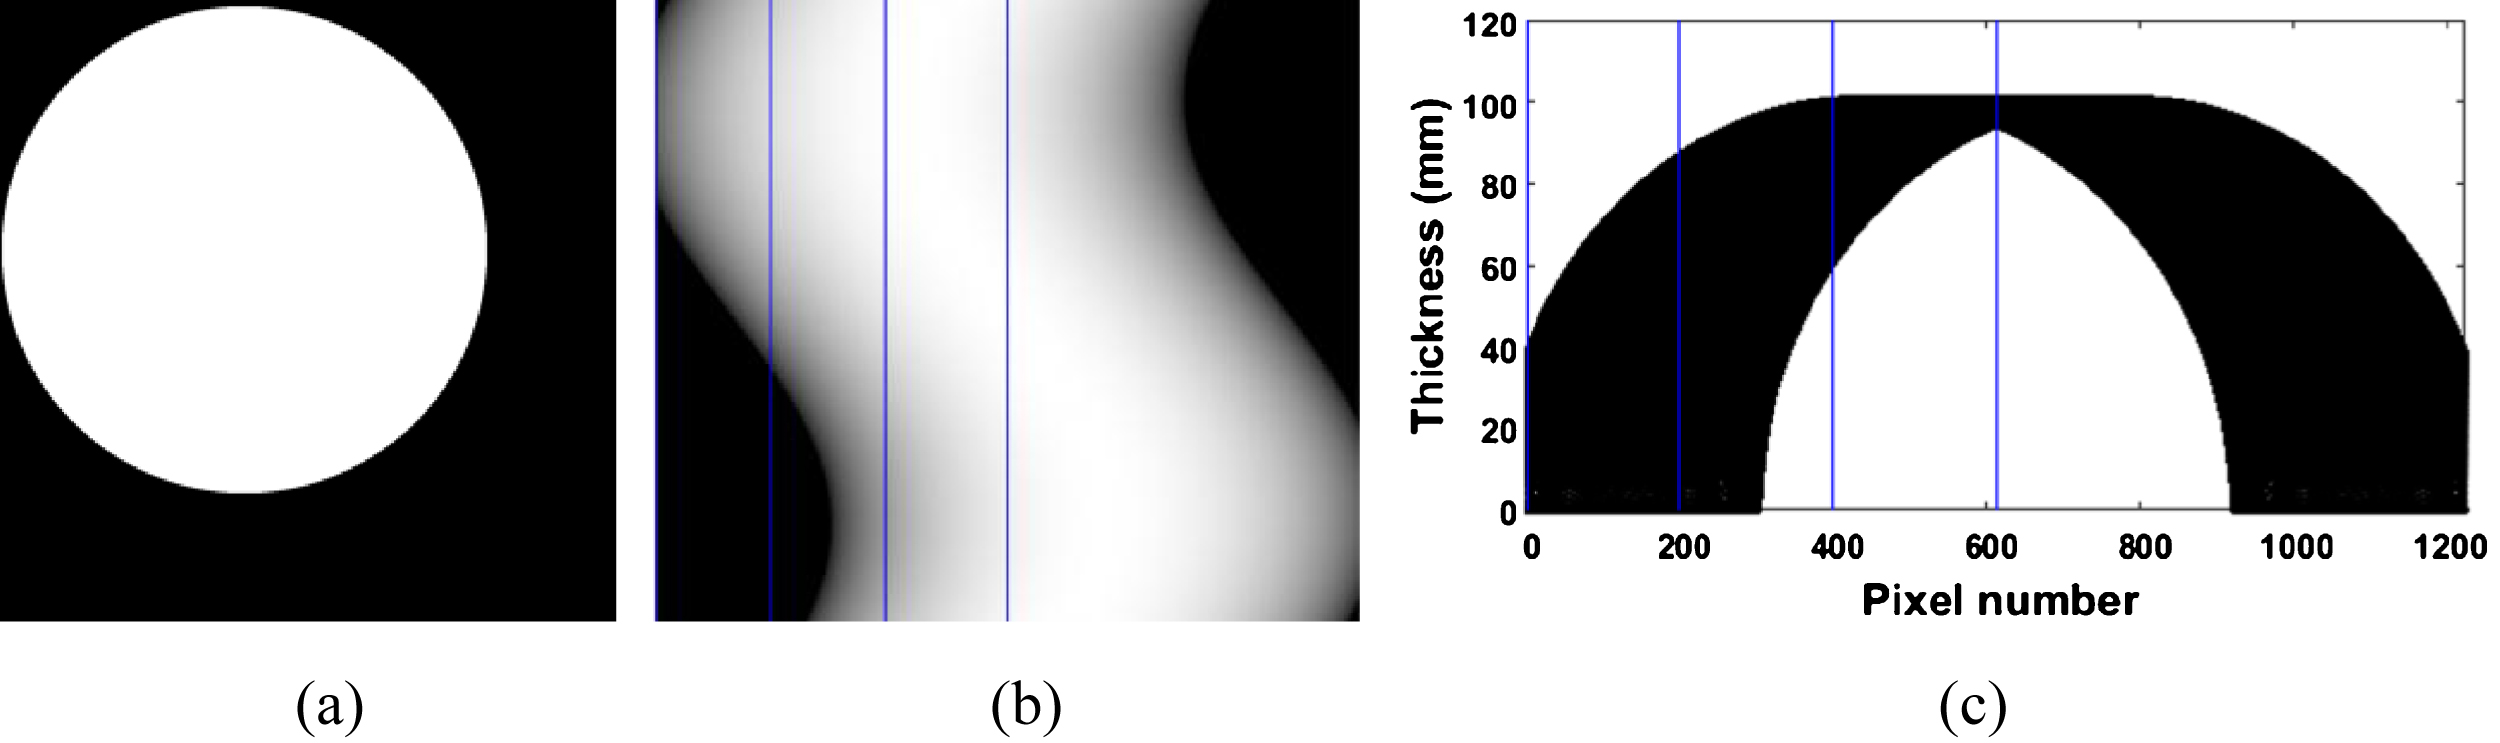
(a) the reference sample. (b) the polychromatic projections of (a). (c) the variation range of the intersection length.
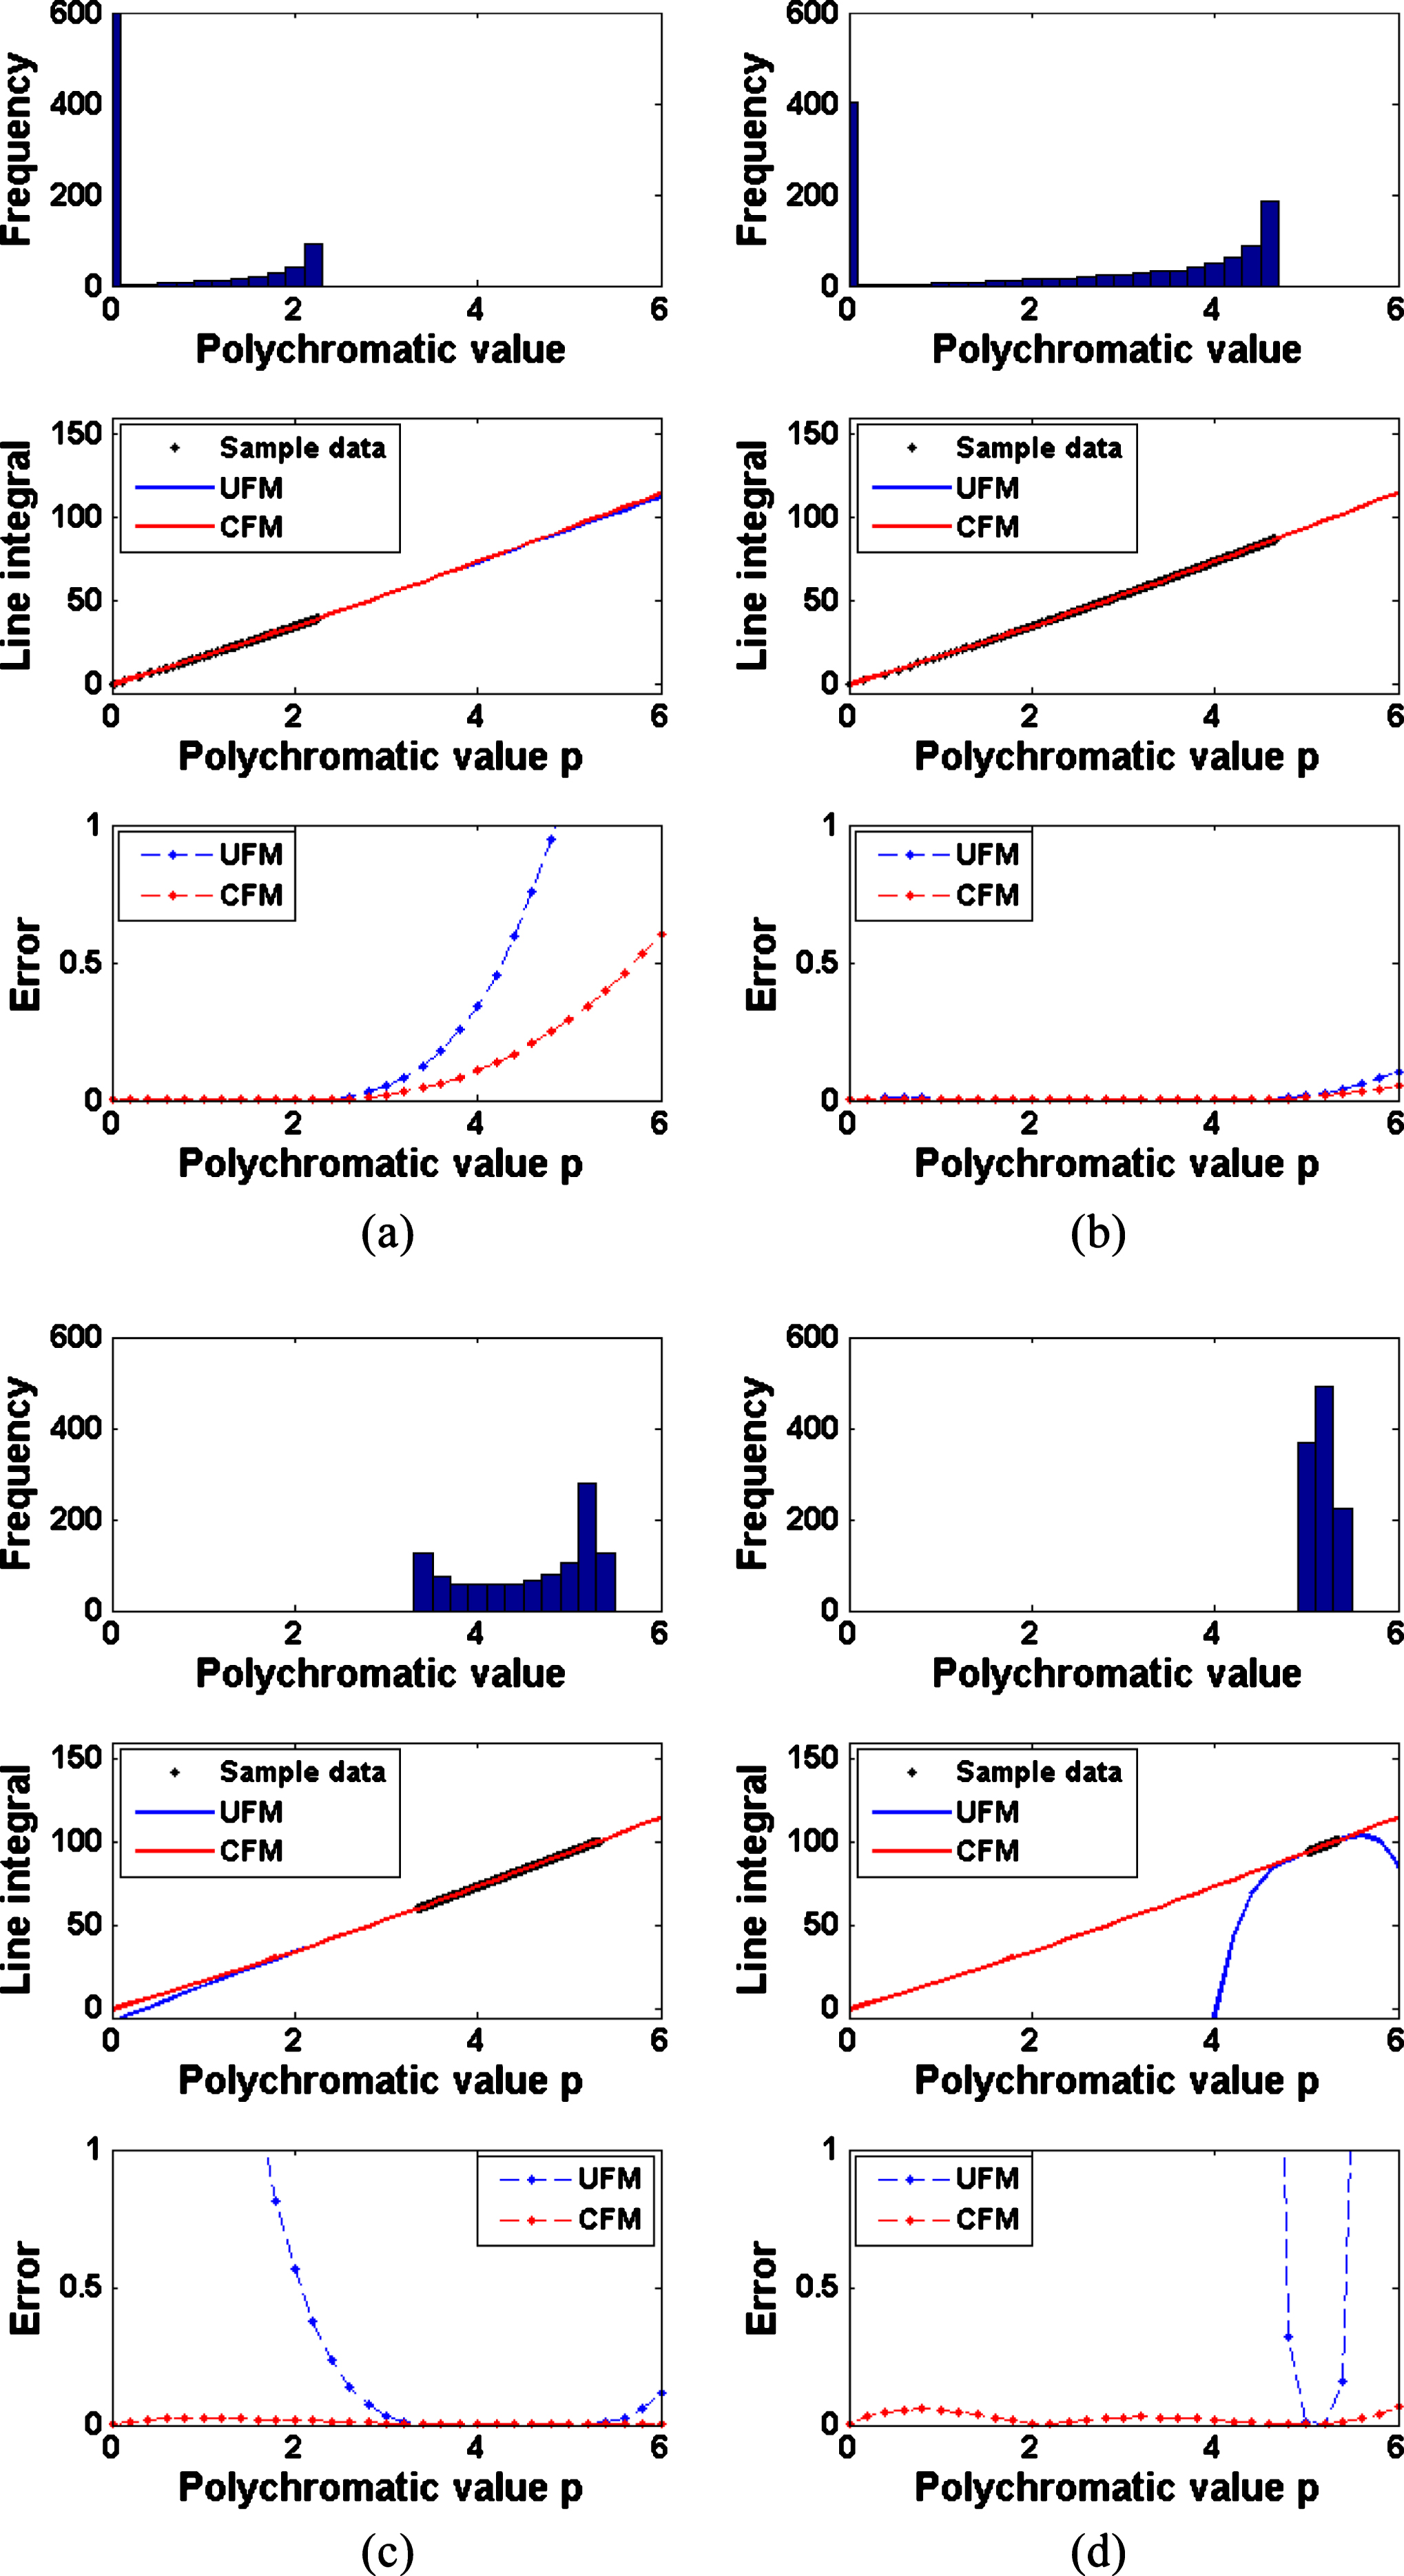
Comparison of the restored calibration functions corresponding to the four detector units: (a) u = 1; (b) u = 200;(c) u = 400; (d) u = 612.
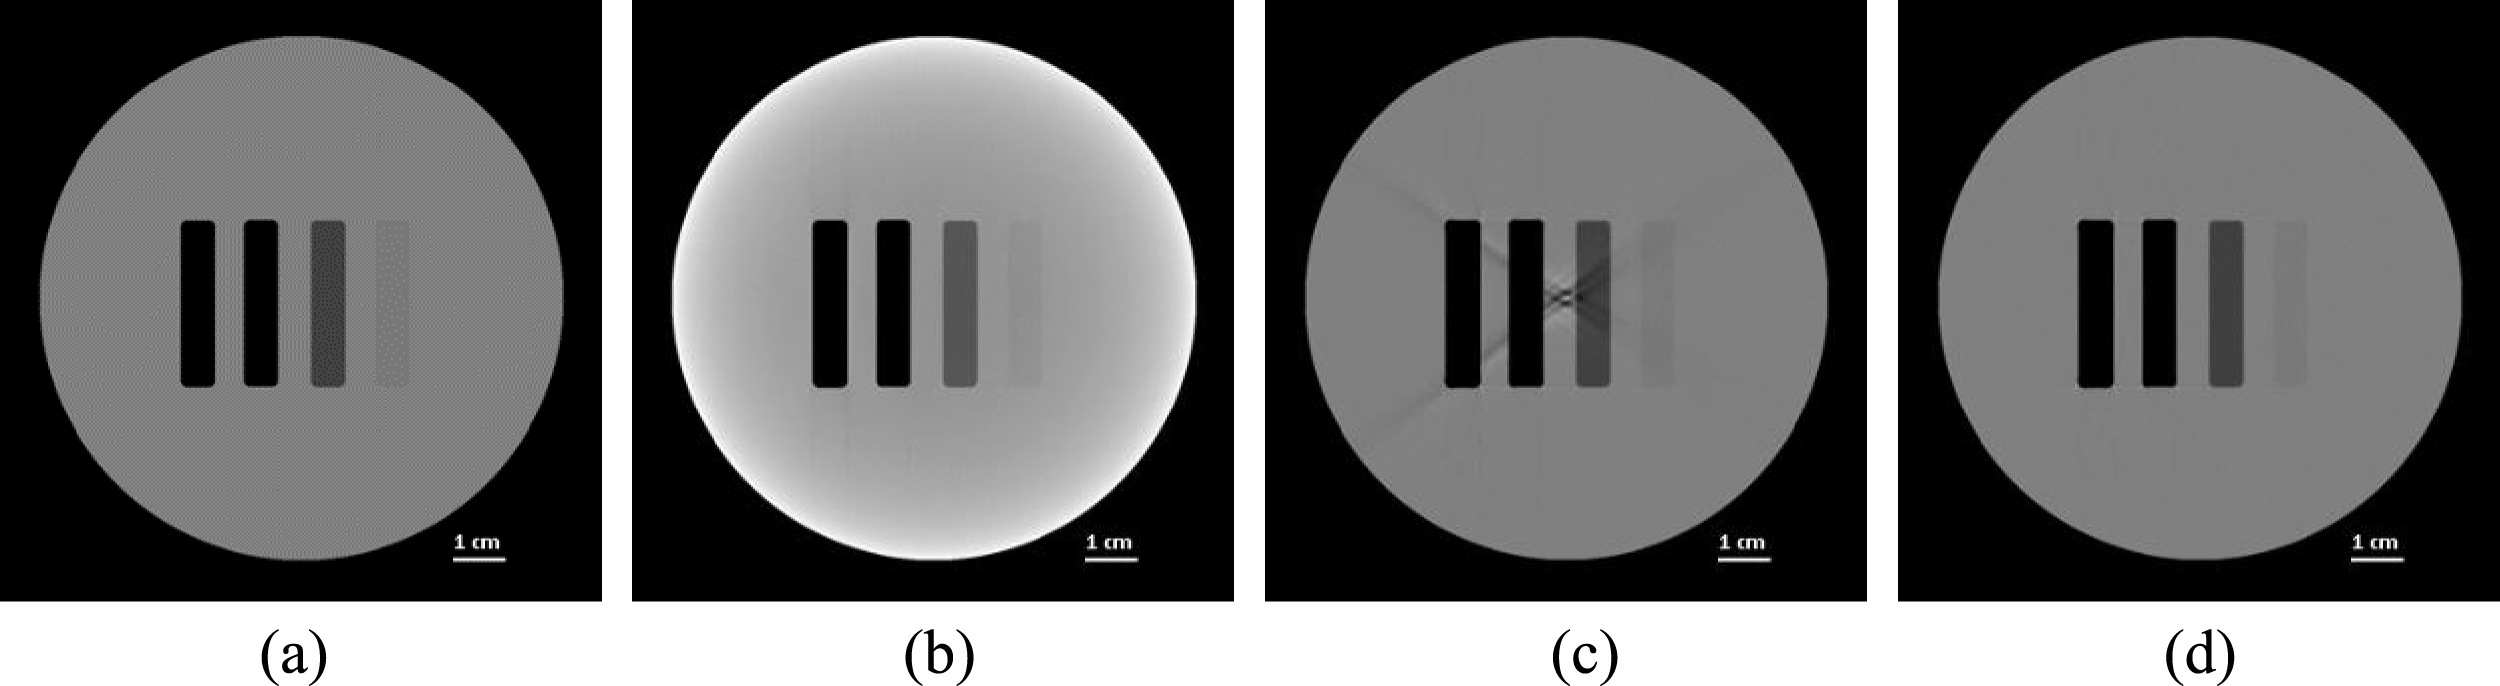
Simulation results of the test sample: (a) The test sample; (b) The image reconstructed from the polychromatic data; (c) and (d) the images reconstructed from the data calibrated with UFM and CFM respectively. The display windows of (a), (c), and (d) are [0.9, 1.1], and that of (b) is [0.04, 0.06].
The parameters of the scanning configuration are set as follows: the focus-to-object distance (FOD) is 1000 mm; the focus-to-detector distance (FDD) is 1200 mm; the line detector is of 1224 units with pitch 0.083 mm; and the full sampling angle B is 1080. With the above parameters, the diameter of the field of view is about 130 mm.
The reference sample is a homogeneous aluminum cylinder with a diameter of 100 mm. In order to obtain a range of intersection lengths as large as possible for each u, the reference sample is positioned off-center in the FOV about 21.20 mm away, as shown in Fig. 3(a). Figure 3(b) shows the simulated polychromatic projections of the reference sample. Figure 3(c) shows the variation range of intersection length for each u (marked by dark points) where the horizontal axis denotes detector unit u, and the vertical axis denotes the intersection length corresponding to u.
As mentioned previously, the variation range of intersection length for each u can affect the accuracy of the restored calibration function. We select four typical detector units (u = 1, 200, 400, 612), whose positions are marked with the blue lines in Fig. 3(b) and (c), to illustrate the corresponding results. The variation ranges of the four detector units’ intersection lengths are [0, 39.32], [0, 86.07], [59.77, 99.54], and [93.26, 99.92], respectively. Compared to the total range [0, 100], the four sets are insufficient in a certain degree. The data of u = 1 lacks relatively big intersection length, while the data of u = 612 lacks relatively small intersection length.
Figure 4 shows the restored calibration functions (with degree N = 4) corresponding to the four selected detector units. In each subfigure, the top part displays the histograms of sampling data, the middle part displays the calibration functions restored with UFM and CFM, and the bottom part displays the error between the restored calibration functions and the theoretical ones. These results indicate that, compared with UFM, the calibration function restored with CFM have a good tolerance to the insufficient sampling data.
We designed a cylindrical test sample containing four cubes inside, as shown in Fig. 5(a), to verify the effect of the restored calibration functions. The diameter of the cylinder is 100 mm. The four cubes with density 0.00, 1.35, 2.57, and 2.67 g·cm–3 from left to right are used to simulate the non-homogeneity of the rock core. The density of the remaining part is 2.70 g·cm–3.
We simulate polychromatic projections of the test sample and convert them into the line integral data using the calibration functions restored with UFM and CFM respectively. Figure 5 (b)-(d) show the comparison results. The profiles of the central rows of the images are plotted inFig. 6.
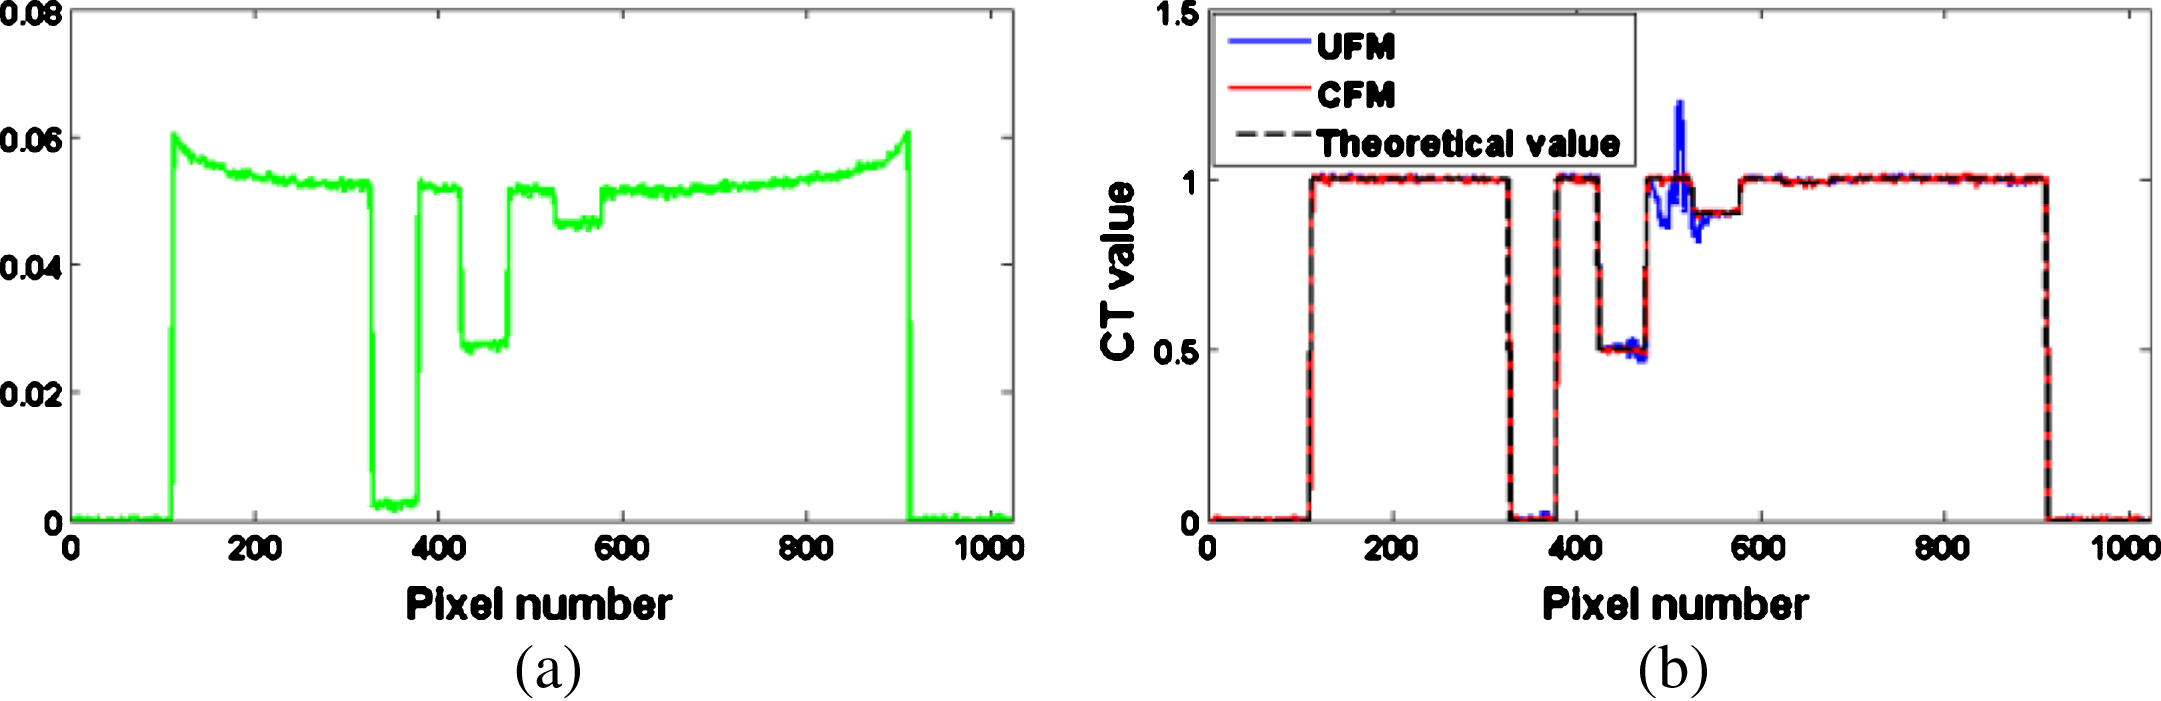
Profiles of the central rows of the images shown in Fig. 5: (a) The profile of Fig. 5 (b); (b) The profiles of Fig. 5 (a), (c), and (d).
We can see from Fig. 5 to Fig. 6 that the calibration functions restored with CFM are much more accurate than that restored with UFM. In addition, new artifacts are shown in the CT image (Fig. 5 (c)) that is calibrated with UFM. We can see from Fig. 5(c) that the artifacts gather in two lines which are close to the center of the sample. The artifacts, we analyze, are caused by the relative big errors of the UFM along the two lines. When restoring the calibration functions, the detector units near the center of the detector are lack of relatively small intersection length, the errors are relatively big when the intersection lengths are small (see Fig. 4(d)). While for the test sample, because of the tubes with small attenuation, the intersection lengths along the two lines are just relatively small, and result in the artifacts.
Several types of rock cores are scanned and calibrated with the proposed method, and achieves satisfactory results. We show here the results of three typical rock cores: a sedimentary rock core, a metamorphic rock core, and a road core made of asphalt and gravels, which are shown in Fig. 7. As a comparison, we have also implemented the wavelet-Fourier filter method [11], which is taken as a practical method for ring artifact reduction.
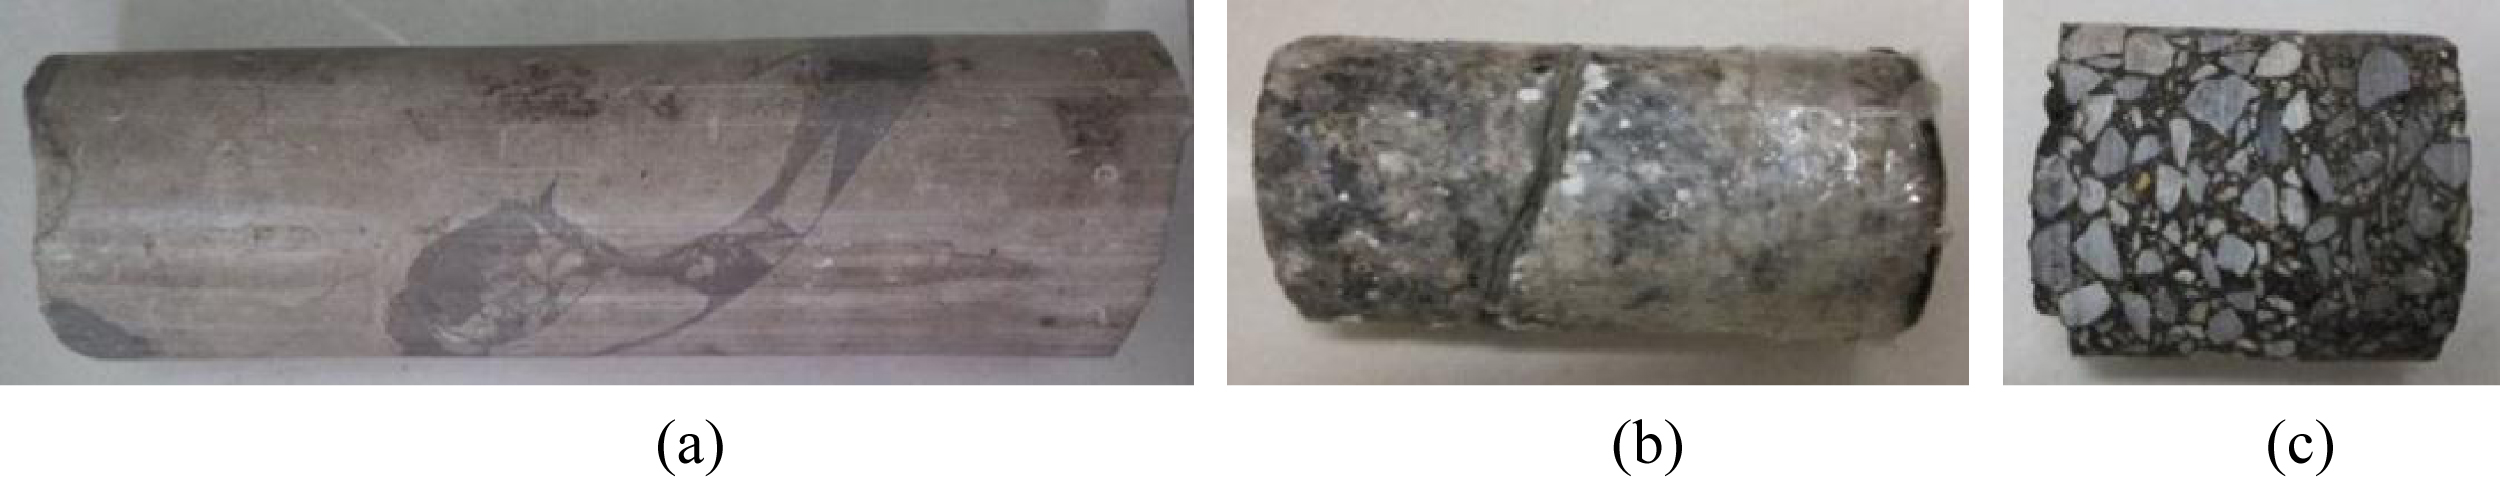
Photographs of the rock core samples: (a) A sedimentary rock; (b) A metamorphic rock; (c) A road core made of asphalt and gravels.
The rock cores are scanned by the CT system of our laboratory. The X-ray source is YXLON Y.TU-450-D05, which has a focal spot size 3.0 mm. The detector is a NTB linear detector, which has 3710 detector units with 0.083 mm unit pitch and 12-bit counter dynamic range. The X-ray tube is operated at 140 kV, current 10 mA, and the exposure time is 30 ms for each projection. The FOD and the FDD are 900 mm and 1196 mm, respectively. 1080 projections are scanned perrotation.
In order to reduce the requirement of the detector dynamic range, an attenuator, as shown in Fig. 8(a), is placed in front of the detector. Two homogeneous aluminum cylinders with diameters 80 mm and 40 mm, as shown in Fig. 8(b), are chosen as the reference samples. The bigger one is placed close to the center of the FOV, and the smaller one is placed near the bigger one to extend the variation range of intersection length.
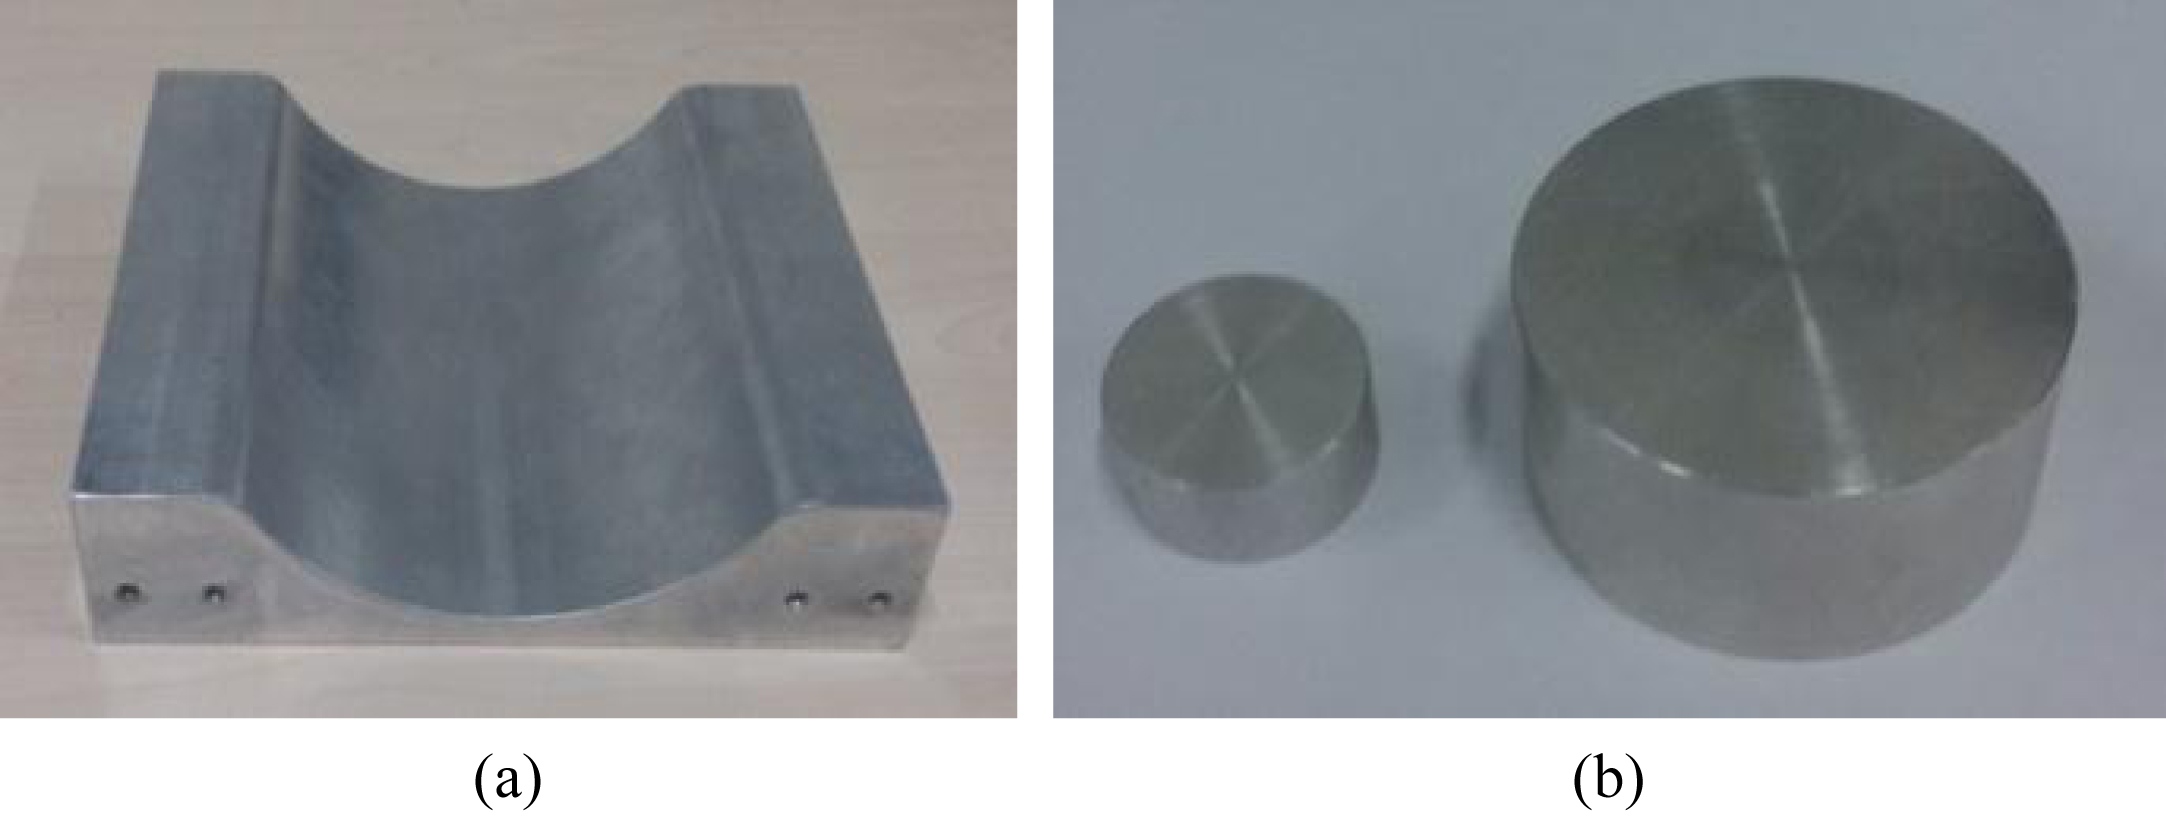
The attenuator (a) and the reference samples (b) used for the experiments.
Figure 9(b) shows the sampling values and the restored calibration functions (with degree N = 4) corresponding to the three typical units marked with blue, black, and red lines in Fig. 9(a). It is seen from Fig. 9(b) that the curvatures of the three calibration functions are significantly different due to the effect of the attenuator. In fact, the mean energy of X-ray beam becomes higher as the attenuator thickness increases. Therefore, the curvature of the calibration function corresponding to the peripheral detector units is smaller than that of the central ones.
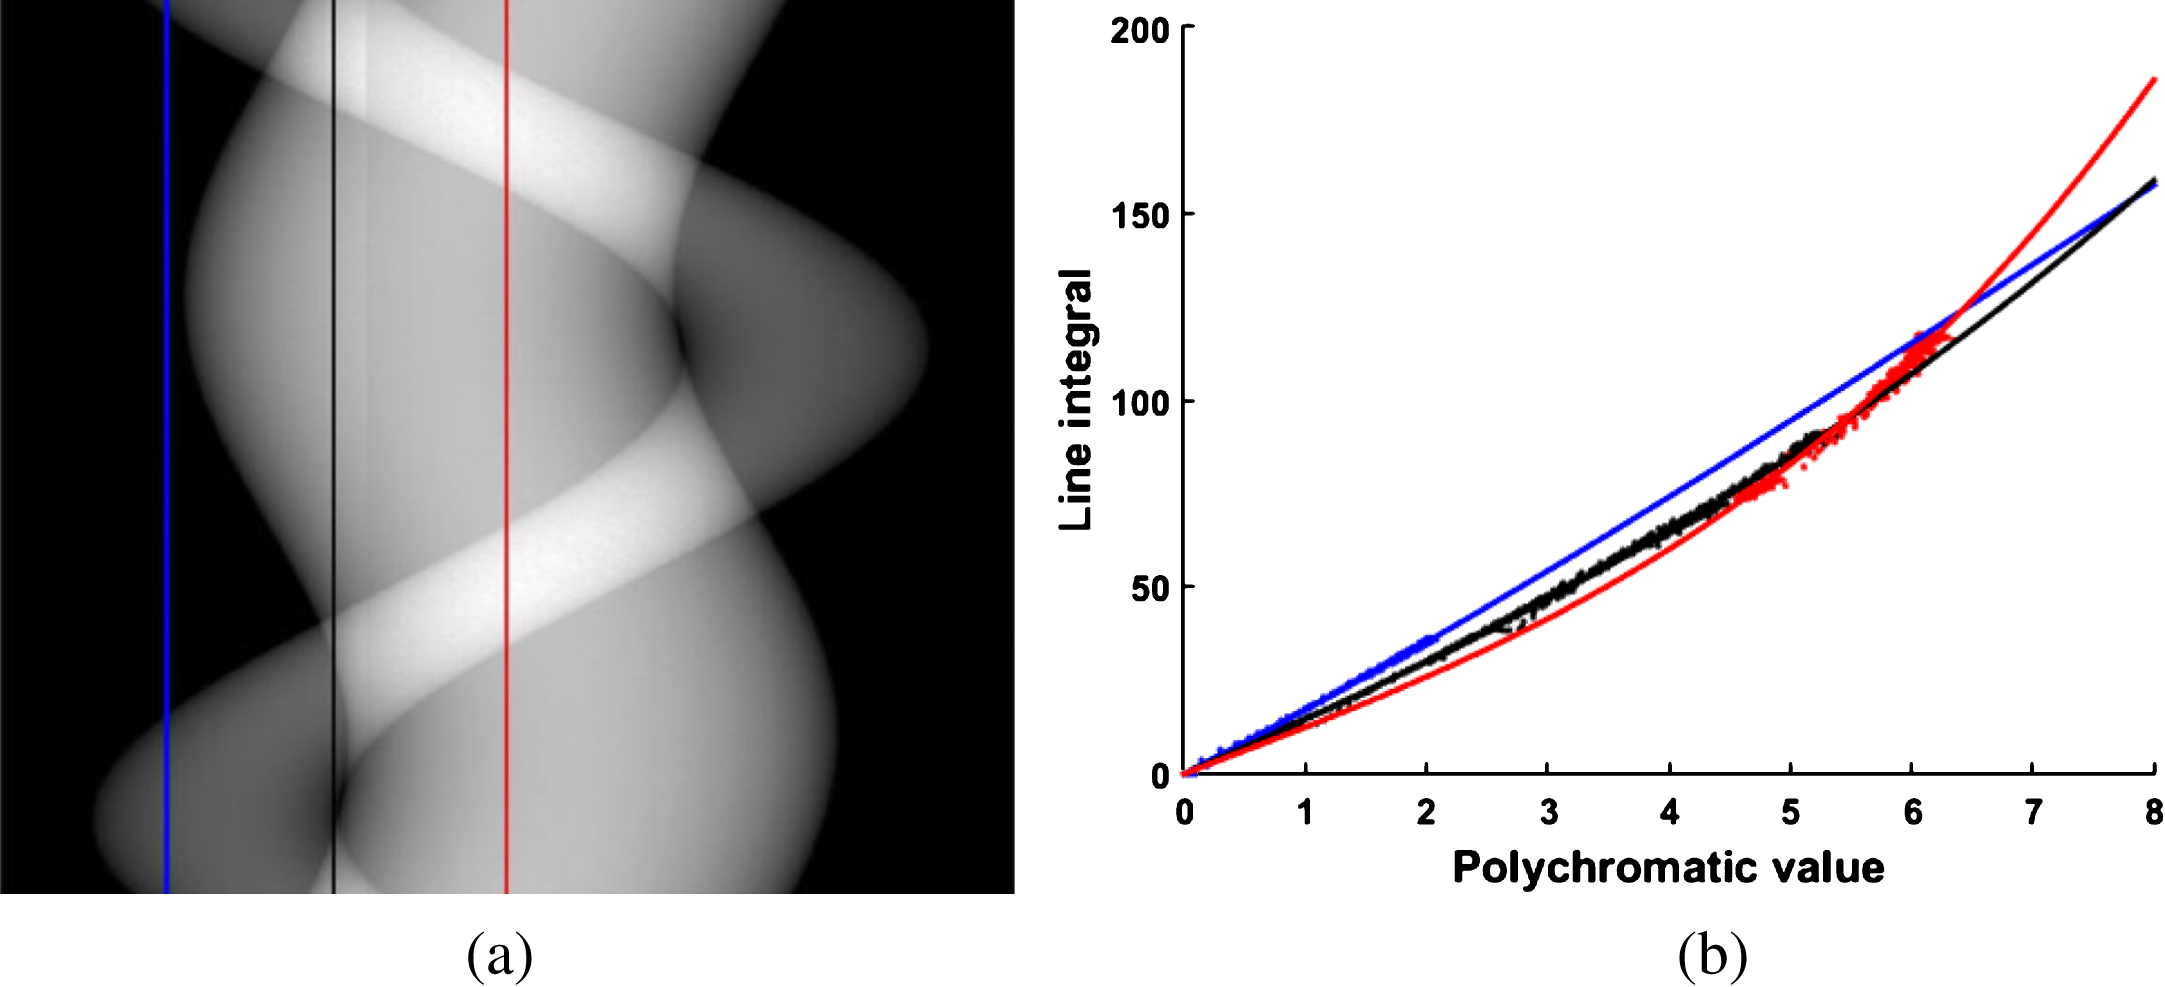
(a) the polychromatic projections of reference samples and (b) the sampling values and the restored calibration functions corresponding to the three typical units marked with blue, black, and red lines in (a).
The restored calibration functions are used to correct the polychromatic projections of the rock cores. Figure 10 to Fig. 12 show the CT images of the three rock cores, where subfigure (a) displays the image directly reconstructed from the polychromatic projections; subfigure (b) displays the image corrected by the wavelet-Fourier method (L = 3, wname = ‘db5’, and sigma = 2.5) [11]; subfigure (c) displays the image reconstructed from the image reconstructed from the projections calibrated by the proposed method.
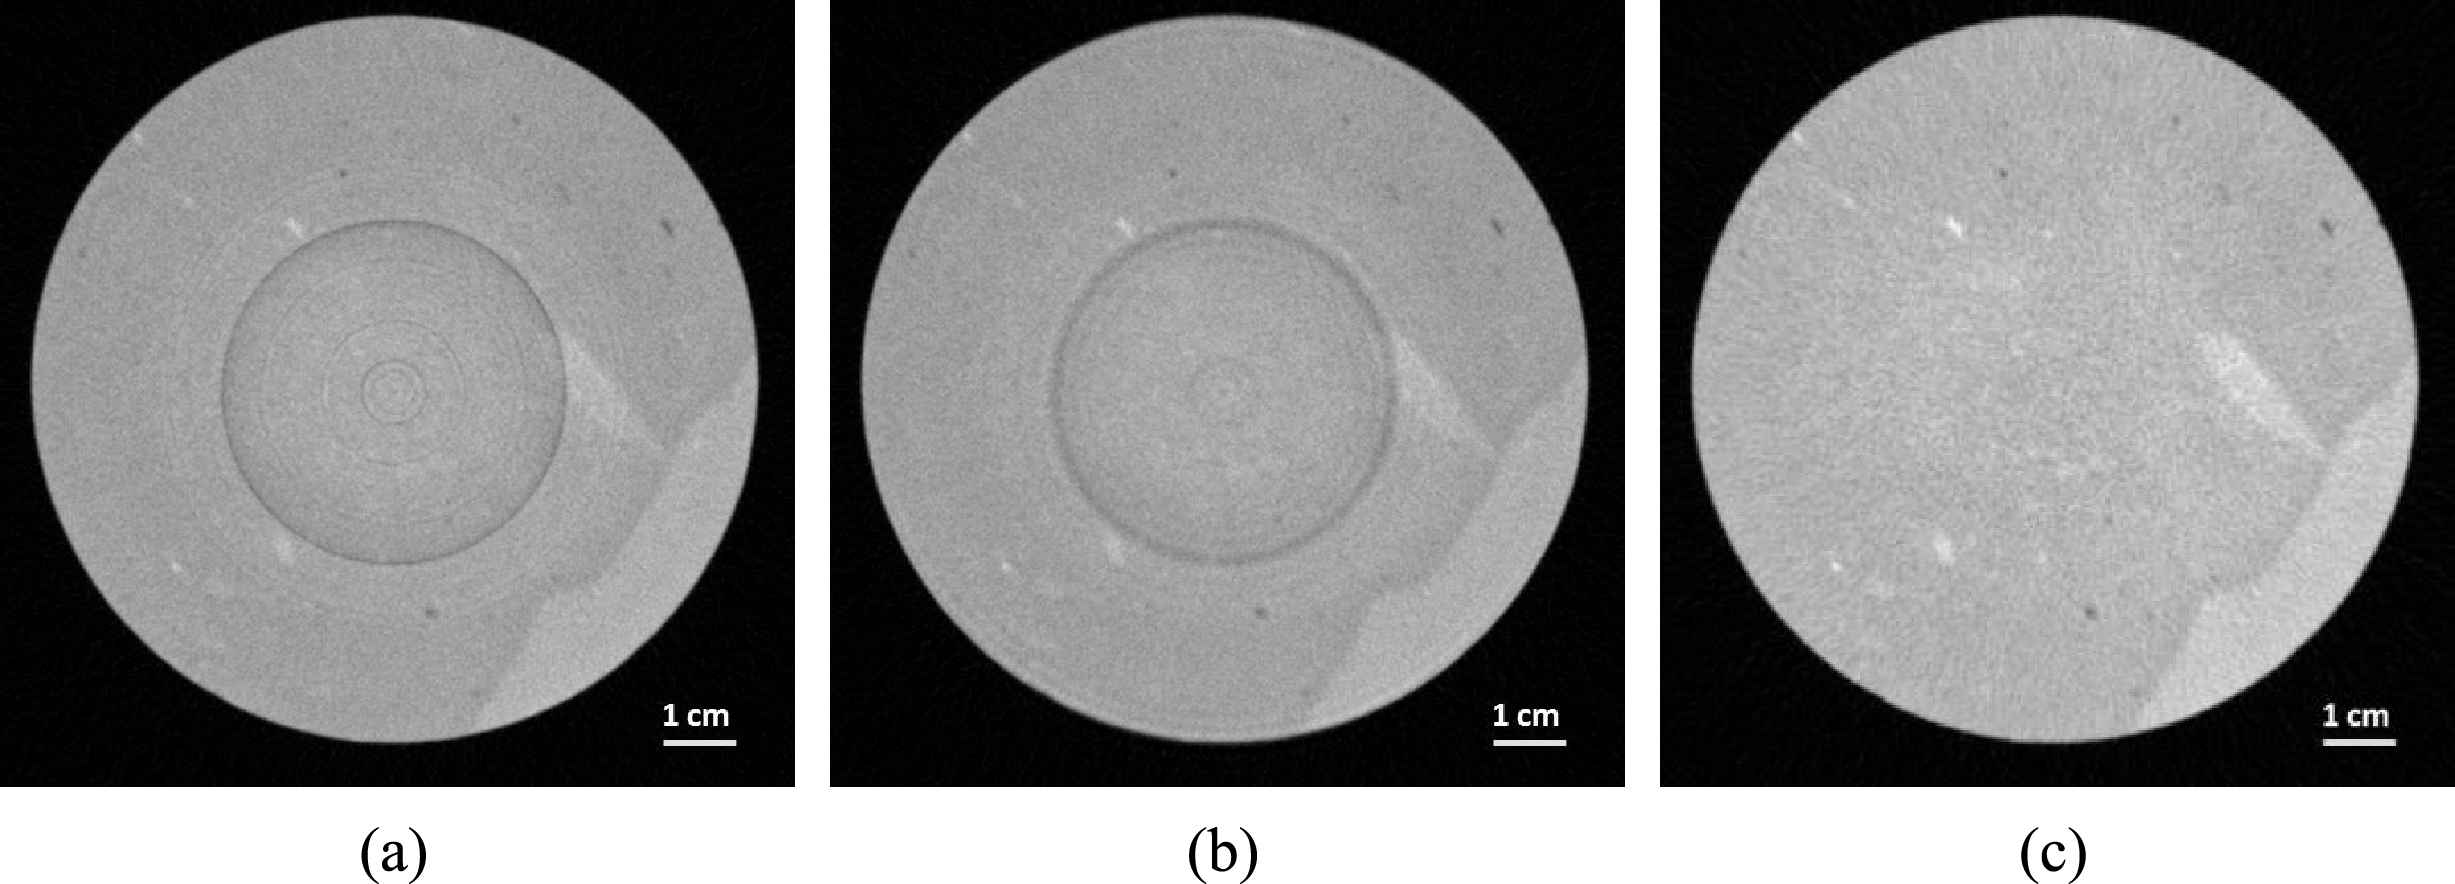
CT images of the sedimentary rock core: (a) The image reconstructed from the polychromatic projections; (b) The image corrected by the wavelet-Fourier method (L = 3, wname = ‘db5’ and sigma = 2.5); (c) The image reconstructed from the projections calibrated by the proposed method. The display window of images (a)-(c) is [0, 0.09].
We can see from Fig. 10 to Fig. 12 that the wavelet-Fourier method reduces high frequency ring artifacts effectively, but introduces low frequency ring artifacts at the same time. While there are no obvious high or low frequency ring artifacts in the images reconstructed with the proposedmethod.
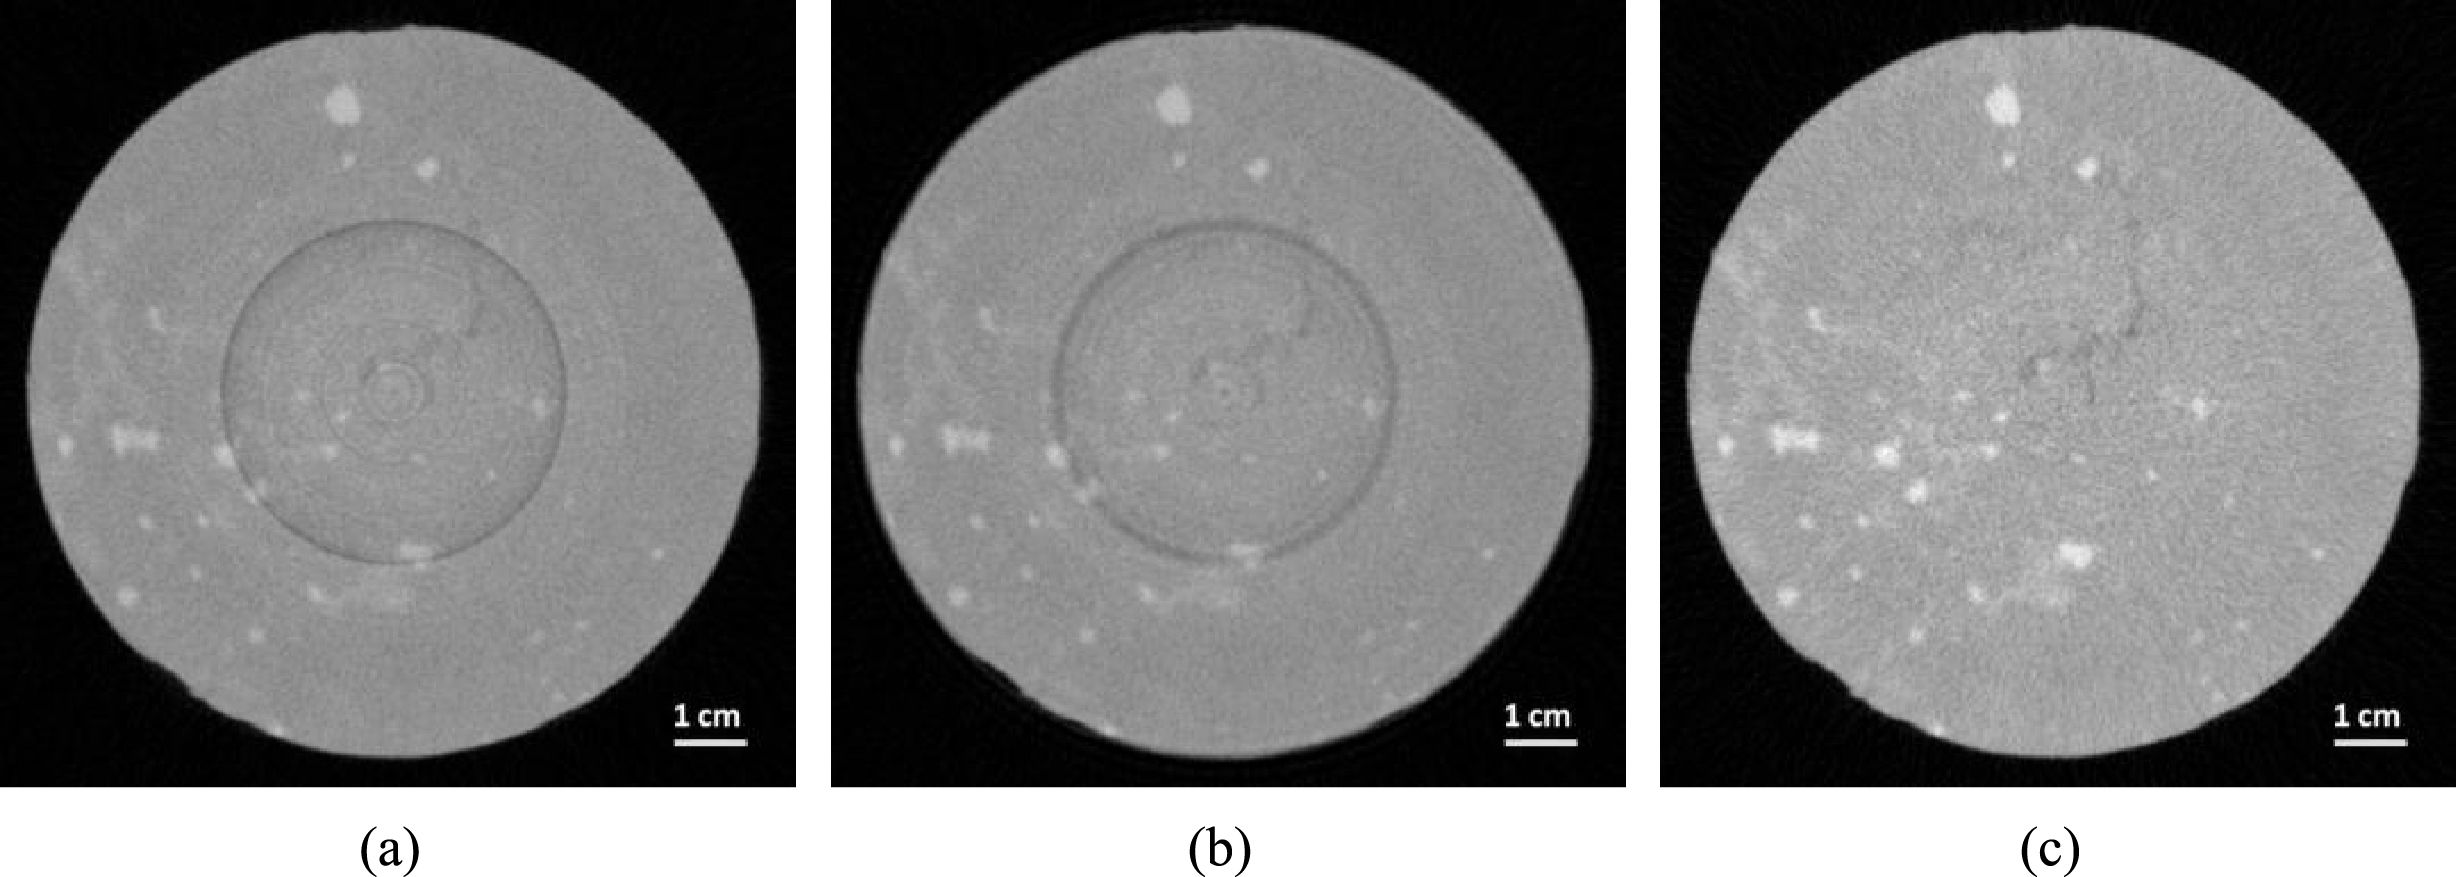
CT images of the metamorphic rock core: (a) The image reconstructed from the polychromatic projections; (b) The image corrected by the wavelet-Fourier method (L = 3, wname = ‘db5’ and sigma = 2.5); (c) The image reconstructed from the projections calibrated by the proposed method. The display window of images (a)-(c) is [0, 0.1].
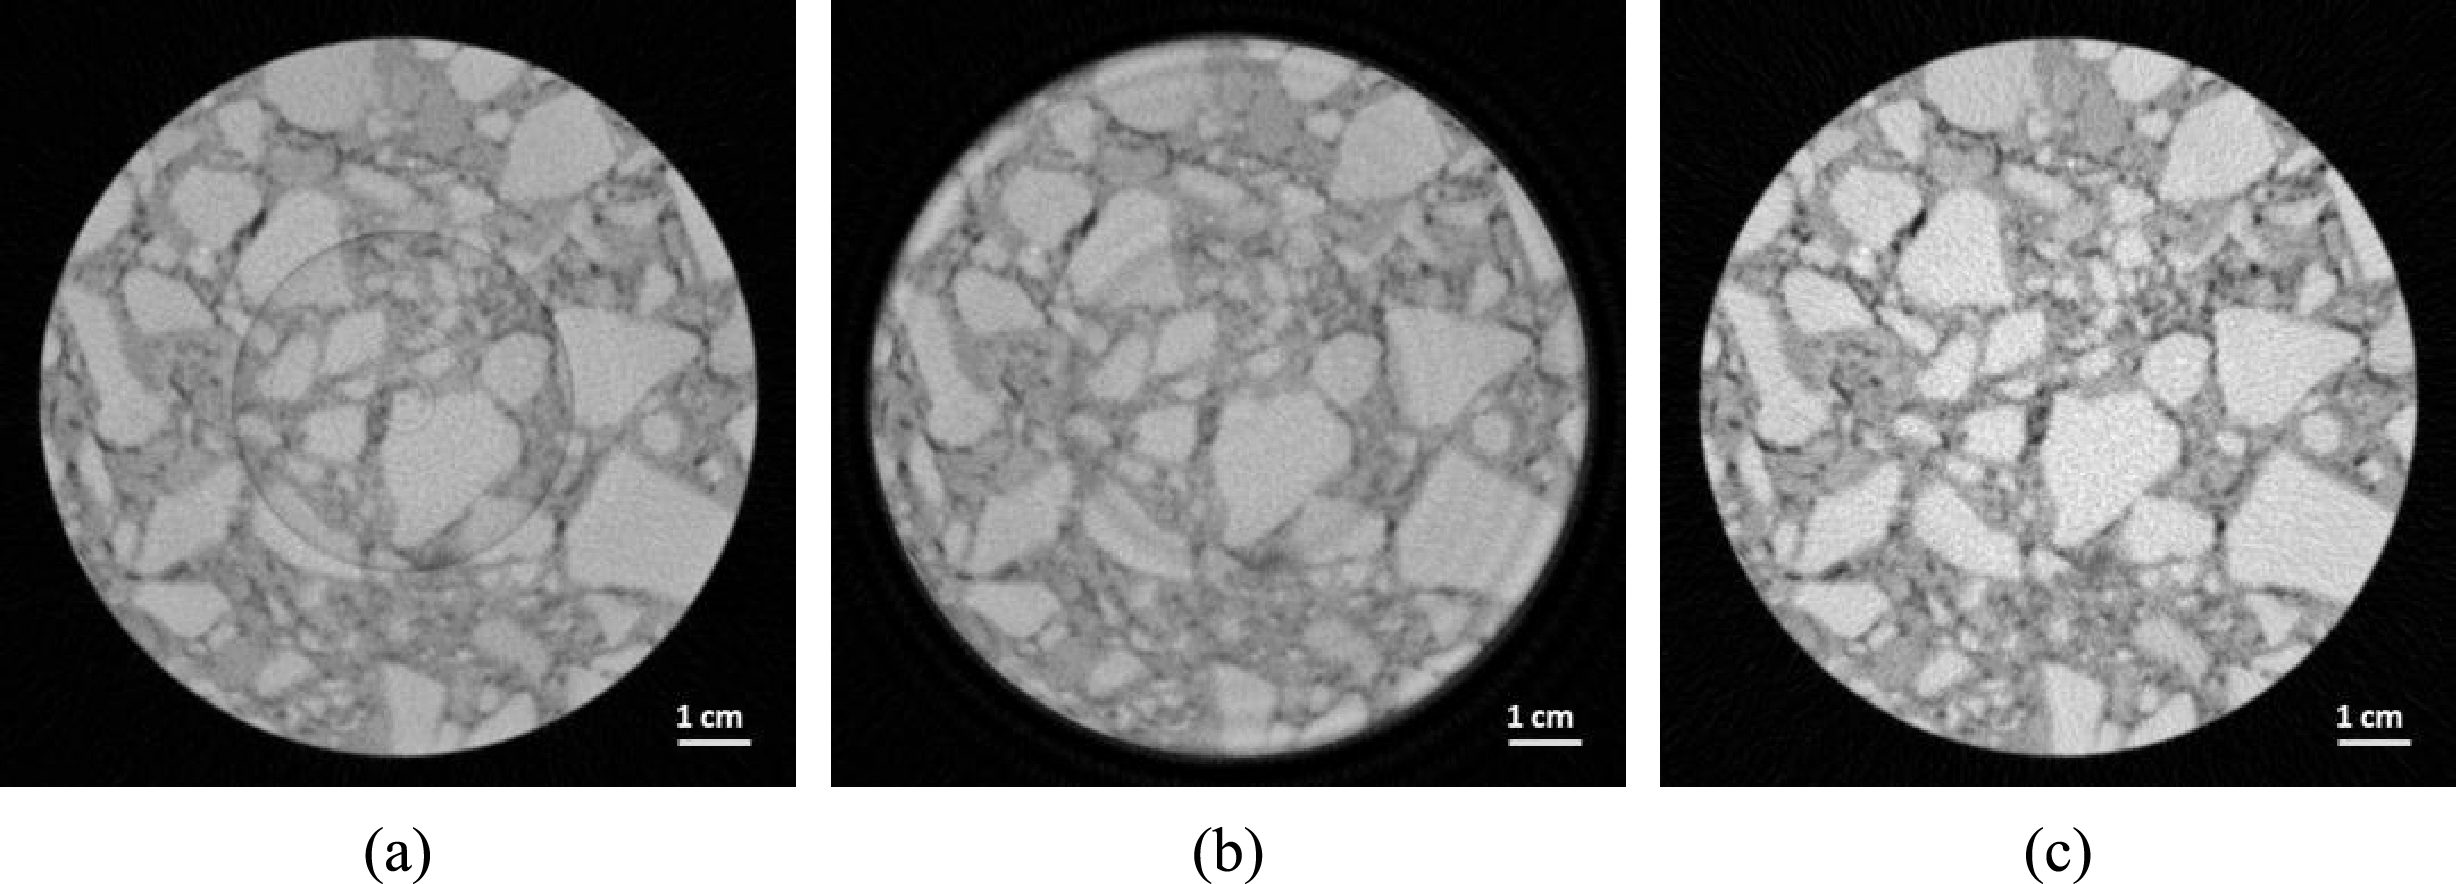
CT images of the road core: (a) The image reconstructed from the polychromatic projections; (b) The image corrected by the wavelet-Fourier method (L = 3, wname = ‘db5’ and sigma = 2.5); (c) The image reconstructed from the projections calibrated by the proposed method. The display window of images (a)-(c) is [0, 0.1].
In this paper, we presented a simple and accurate method to restore the detector-unit-dependent calibration functions, which convert the polychromatic projections into the line integral data of the reference material. Experimental results show that both beam hardening artifacts and ring artifacts can be significantly reduced by our calibration method.
Footnotes
Acknowledgments
This work was supported by the Beijing Education Committee, and the Natural National Science Foundation of China [grant numbers 61401289, 61671311 and 61372179].