
Abstract
PURPOSE:
To explore the value of low-dose CT perfusion imaging (LDCTPI) technology and its perfusion parameters in assessing response of neoadjuvant chemotherapy (NAC) in patients with advanced gastric cancer (AGC).
METHODS:
Thirty patients with AGC were studied prospectively by LDCTPI to measure two parameters including blood flow (BF) and blood volume (BV) of tumor area before and after chemotherapy, respectively. All of the patients received two courses of NAC and surgical resection of gastric tumor within one week after chemotherapy, and then obtained the result of postoperative pathology response for chemotherapy. The comparisons of BF and BV values of AGC before and after chemotherapy were analyzed by paired-samples t-test, respectively; and the correlations between BF as well as BV decrease rates after NAC and the pathology response grade were analyzed by Spearman statistical test. Thirty patients were divided into effective and ineffective groups according to different pathology response grade. Comparisons of BF as well as BV decrease rates between effective and ineffective groups were analyzed by independent-samples t-test, respectively. Receiver operating characteristic (ROC) curves were used to determine the cutoff values of BF and BV decrease rates as evaluation indicators of AGC after NAC and calculate area under the curve (AUC).
RESULTS:
There were significant differences in BF and BV values of AGC between before and after NAC (p < 0.001), respectively, and there were obvious correlations between BF as well as BV decrease rates and pathology response grade (r = 0.660, p < 0.001; r = 0.706, p < 0.001), respectively. There were also significant differences in BF and BV decrease rates of AGC between effective and ineffective groups (P = 0.001), respectively. If BF decrease rate of 12.1% (AUC was 0.816, P = 0.005) was used as the cutoff value for chemotherapy effectiveness of AGC, the sensitivity of 82% and specificity of 84% were achieved, and if BV decrease rate of 32.8% (AUC was 0.844, P = 0.002) was used as the cutoff value for chemotherapy effectiveness of AGC, the sensitivity of 82% and specificity of 89% were achieved.
CONCLUSIONS:
BF and BV decrease rates have potential to be used as effective indicators to assess chemotherapy efficacy of AGC from the hemodynamics.
Keywords
Introduction
The incidence and mortality of gastric cancer had been steadily declining in western countries over the past decades [1]; however, they still ranked first among malignant tumors of the digestive tract in China [2, 3]. It was reported that the mean survival times of advanced gastric cancer (AGC) were less than 1 year [4]. In 1989, Wilke et al. [5] first reported application of neoadjuvant chemotherapy (NAC) in gastric cancer and achieved satisfactory result. NAC referred to systemic chemotherapy before implementation of local treatment (such as surgery or radiotherapy), and its objective was to make a tumor shrink and kill invisible tumor cells as early as possible to facilitate subsequent surgery or radiotherapy. However, efficacy evaluation for NAC of AGC still lacks uniform standard up to now [6–8], preoperative and accurate efficacy evaluation is crucial to subsequent treatment selection and prognosis inference. In this study, low-dose CT perfusion imaging (LDCTPI) technique was used to measure and analyze the BF and BV values of AGC before and after NAC so as to explore its clinical application value in assessing efficacy of NAC.
Materials and methods
Patients
The study was approved by the Scientific Committee and the equivalent of the institutional review board of our hospital. Each participant understood the procedure, including the radiation dose of LDCTPI. 30 patients with AGC proved by clinic and pathology in our hospital during June 2016∼January 2017 were recruited, including 20 males and 10 females with an age range of 38∼70 years (mean 61 years). Inclusion criteria: All cases were patients with AGC, and they had no chemotherapy contraindication, no major disease affecting blood supply to stomach and no iodine allergy history. Their elbow veins were so big that they could meet high flow rate requirement when CT perfusion was performed, and they could hold breath for 30 s. Every patient received two courses of NAC (ECF chemotherapy regimen), two times LDCTPI examination before and after NAC, surgical resection of a stomach tumor within a week after NAC. Finally, they obtained the result of postoperative pathology response grade.
Perfusion CT study protocol
The preparations before LDCTPI examination referred to the literature [9] published by author. At 5 min before the examination, the subjects drank 800–1200 mL of warm water to distend the stomach for better visualization of the tumor.
First, all patients were conventionally plain-scanned on a 64-slice spiral CT scanner (Siemens Somatom Sensation, Germany) with the following parameters: a slice thickness of 5 mm, tuber voltage of 80∼100 kV, tuber current of 60∼80 mAs, a matrix of 512×512 pixels, and pitch of 0.984 : 1. Then, LDCTPI examination was performed according to the plain CT image, the slice containing the largest tumor area was selected as the center slice, and the coverage on the Z-axis was a total of 6 slices (i.e. 3 cm). These slices were scanned with a small field-of-view (SFOV) at a slice thickness of 4.8 mm, tuber voltage of 80∼100 kV, and tuber current of 50∼60 mAs. A 50 mL bolus of iopamidol (Iopamiro; Bracco; Shanghai, China) containing 300 mg of iodine per mL was injected using a power injector (MEORAO-Stellant, MEORAO Company, Germany) via an antecubital vein at a rate of 5 mL/s. CT perfusion scanning commenced at 7 s after beginning of contrast agent injection, scanning was repeated every second, and the total scanning time was 30 s.
Image interpretation
Data from the dynamic perfusion scan were transmitted to a advantage workstation (ADW4.0, Siemens company) system, and then an abdominal tumor perfusion protocol in the body CT perfusion 3.0 software (deconvolution method) was used for data processing. The abdominal aorta was selected as the input artery and pseudo-color (pcolor) perfusion images were obtained through workstation processing. The region of interest (ROI) which should be no less than half of the maximum area of the target lesions was drawn as large as possible around the tumor to reduce noise (>50 pixels), the necrotic area and the edge of the tumor were avoided, and the solid portion was ensured to be as large as possible. The corresponding perfusion parameters were measured, namely, blood flow (BF) and blood volume (BV). Measurements of all perfusion parameters were repeated 3 times and the averages of the 3 measurements were shown.
Image evaluation method
The images were analyzed by 3 radiologists who primarily engaged in gastrointestinal tumor research, and these physicians recorded the quality of the images (such as presence or absence of artifacts), the size and location of the tumors, and perfusion parameter values. The calculation formula of BF decrease rate was as follow: BF decrease rate = (BF value before NAC–BF value after NAC)/BF value before NAC =△BF/BF before NAC, and the calculation formula of BV decrease rate was the same as BF decrease rate.
Pathological evaluation method
Pathological efficacy evaluation method proposed by the Japanese Research Society [10] for gastric cancer in 1999 (Table 1) was used as gold standard to evaluate efficacy of gastric cancer after chemotherapy, and they were divided into ineffective group (including grade 1∼3) and effective group (including grade 4 and 5).
Pathological efficacy evaluation standard of gastric cancer after chemotherapy
Pathological efficacy evaluation standard of gastric cancer after chemotherapy
The BF and BV values are expressed as the mean±standard deviation (
Results
The LDCTPI images of all patients were clear and met diagnostic requirement, and the LDCTPI generated small radiation dose with a range of 2.8∼3.5 mSv (mean 3.1 mSv). The results showed that the gastric lump mildly and moderately shrank (the maximum diameter of the tumor decreased by less than half) after NAC in 18 cases (Figs. 1 and 2), and significantly shrank (the maximum diameter of the tumor decreased by more than half) after NAC in 5 cases (Figs. 3 and 4), and did not shrink in 7 cases. Table 2 showed that there were significantly statistical differences for the BF as well as BV values between before NAC and after NAC in 30 patients with AGC(p < 0.001, respectively). According to pathological efficacy evaluation standard proposed by the Japanese Research Society for gastric cancer, there were 3 cases with grade 1, 11 cases with grade 2(Fig. 2(D)), 5 cases with grade 3, 8 cases with grade 4(Fig. 4(D)), and 3 cases with grade 5 in 30 patients. There were 19 cases in pathological ineffective group (including grade 1∼3) and 11 cases in pathological effective group (including grade 4 and 5). There were significantly statistical differences for the BF and BV decrease rates between pathological effective group and pathological ineffective group (p = 0.001, p = 0.001, respectively) (Table 3). The percentage BF and BV decrease rates were significantly correlated with pathology response grade(r = 0.660, p < 0.001; r = 0.706, p < 0.001, respectively) (Figs. 5 and 6).
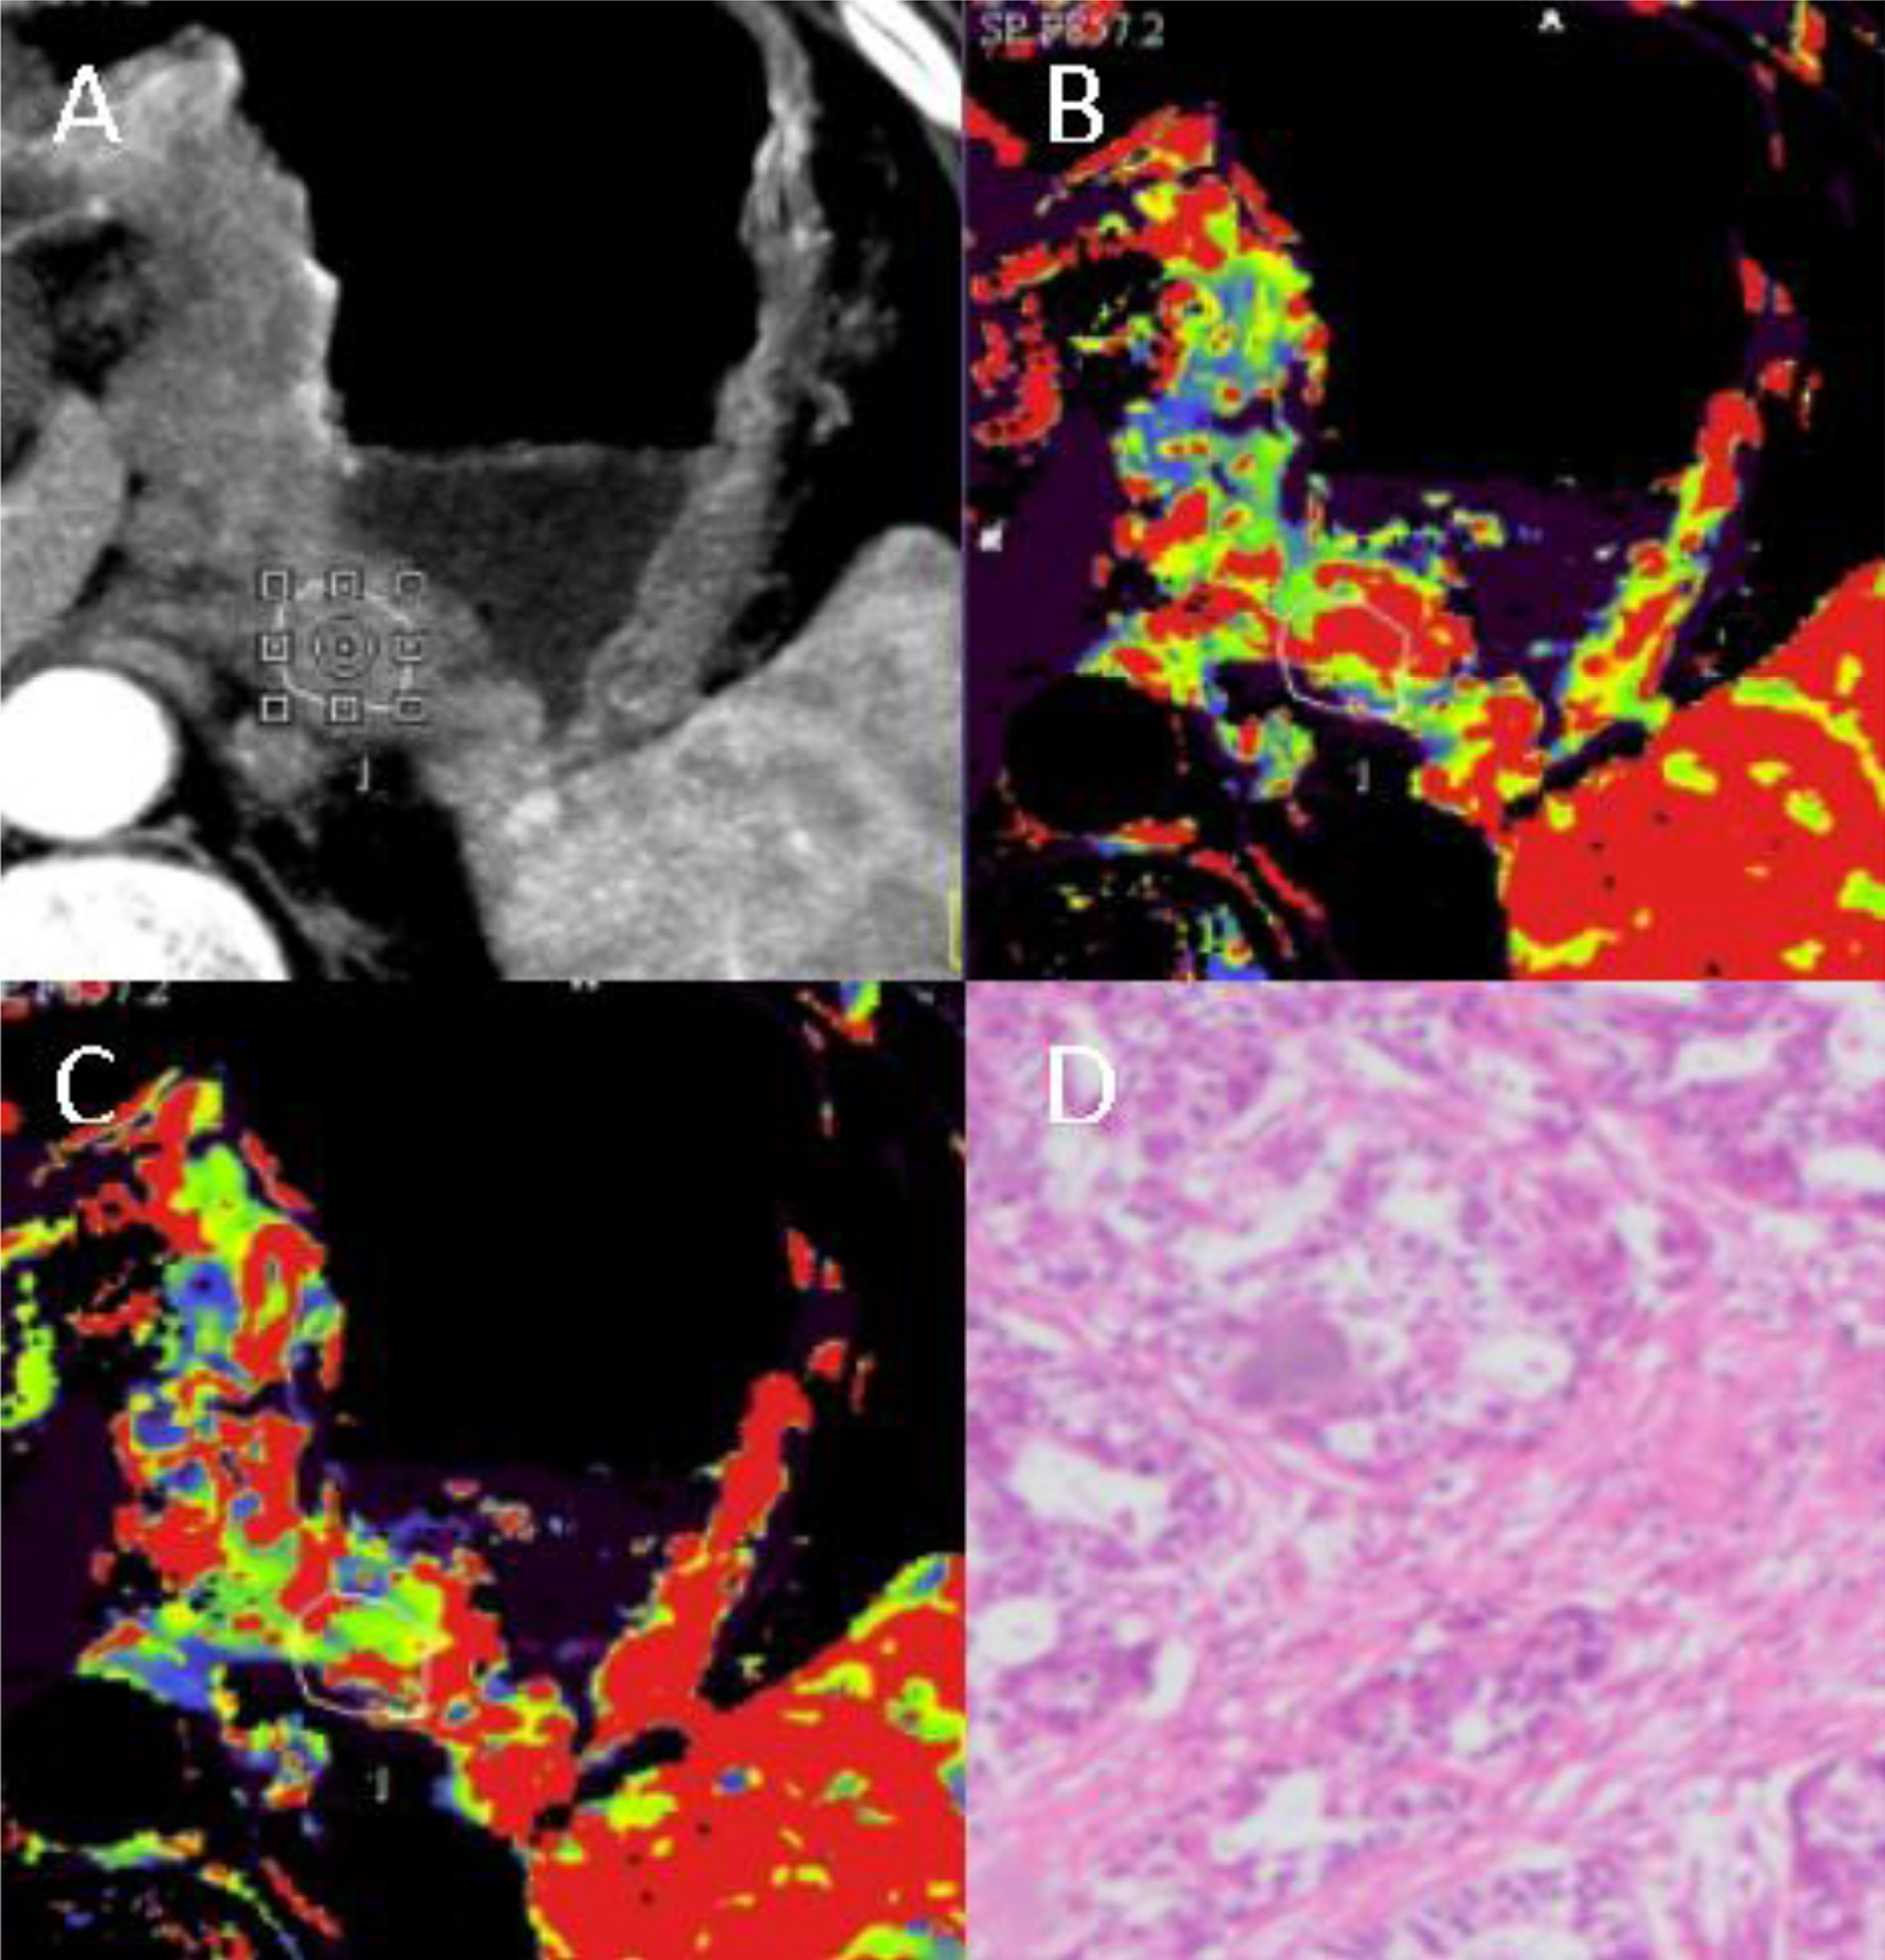
LDCTPI images in a 62-years-old man with adenocarcinoma in the cardia before NAC. A:An original image showed irregular tumor in the cardia with obvious enhancement. B-C: CT perfusion BF and BV images, respectively. In the BF and BV images, the tumor area was shown in red and yellow. D:A pathological image (HE staining, 100×) showed the poorly differentiated tubular adenocarcinoma cells with obvious pleomorphism.
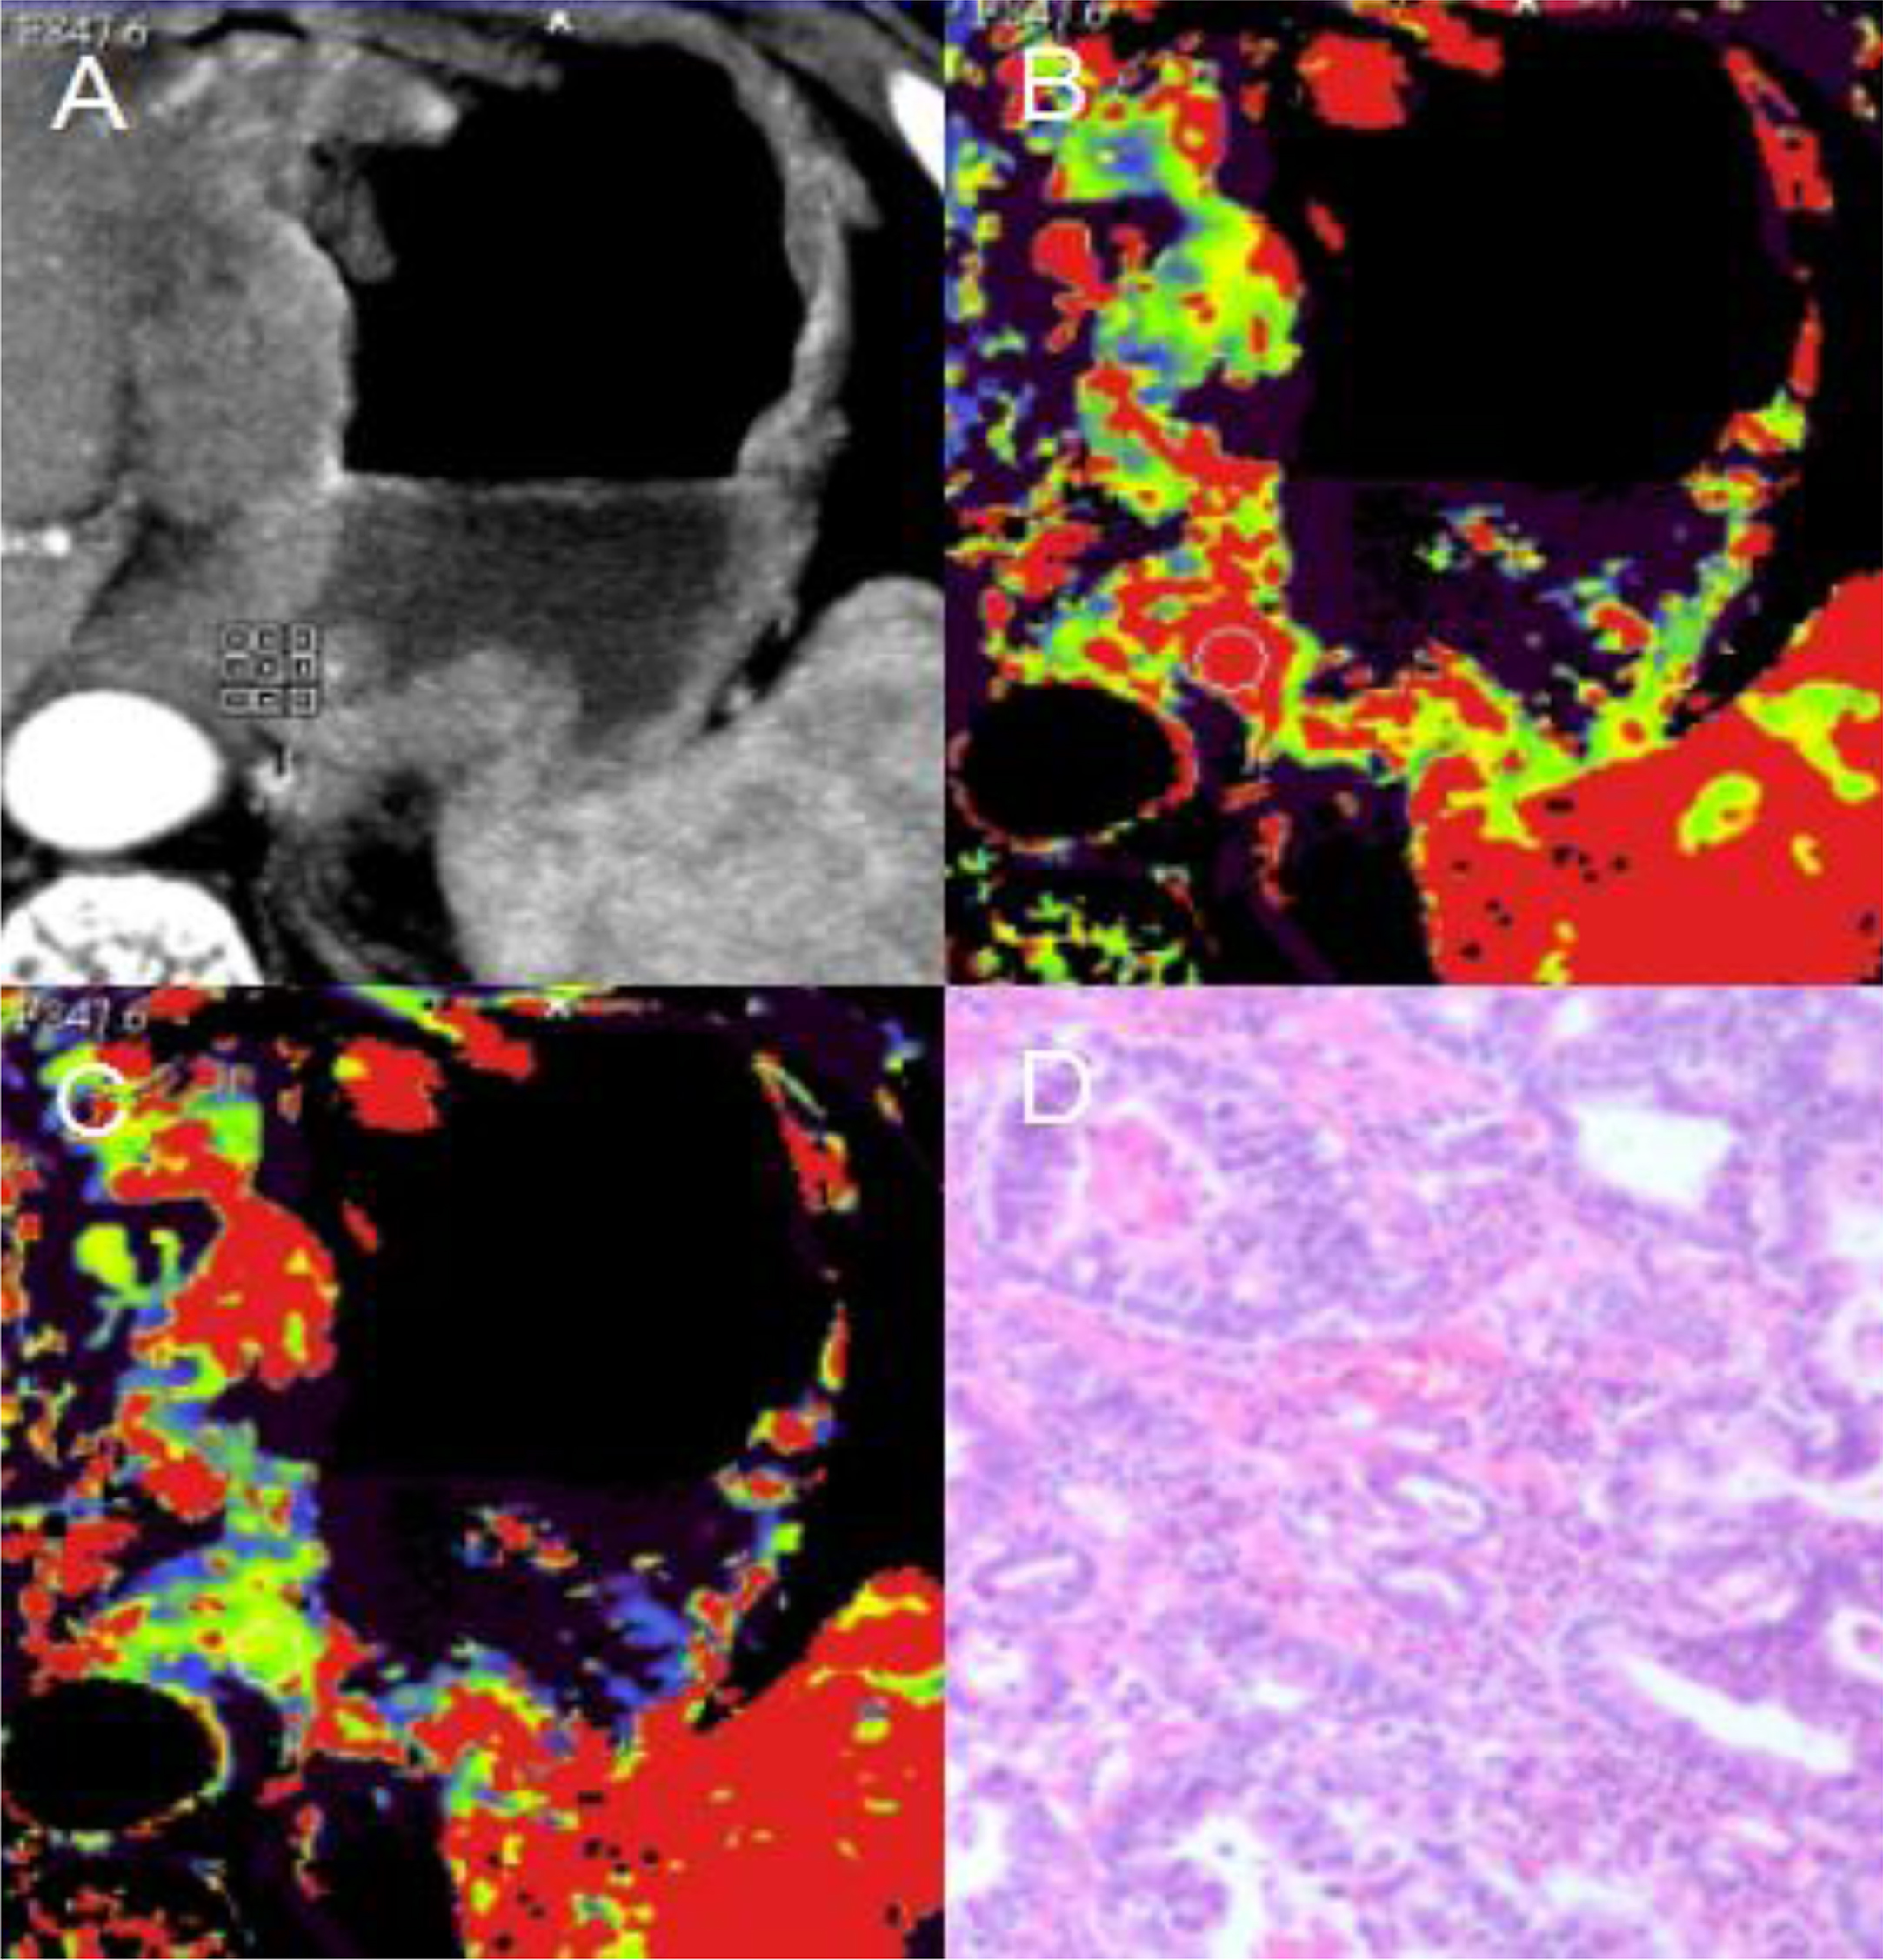
LDCTPI images in the same patient as Fig. 1 after 2 courses of NAC with ECF regimen. A:An original image showed that the tumor in the cardia mildly shrank in comparison with Fig. 1. B-C:CT perfusion BF and BV images, respectively. In the BF and BV images, the tumor area was shown in red and yellow. D: A pathological image (HE staining, 40×) showed that less than 1/3 of the tumor area necrosed, and the result of pathological response to NAC was ineffective (grade 2).
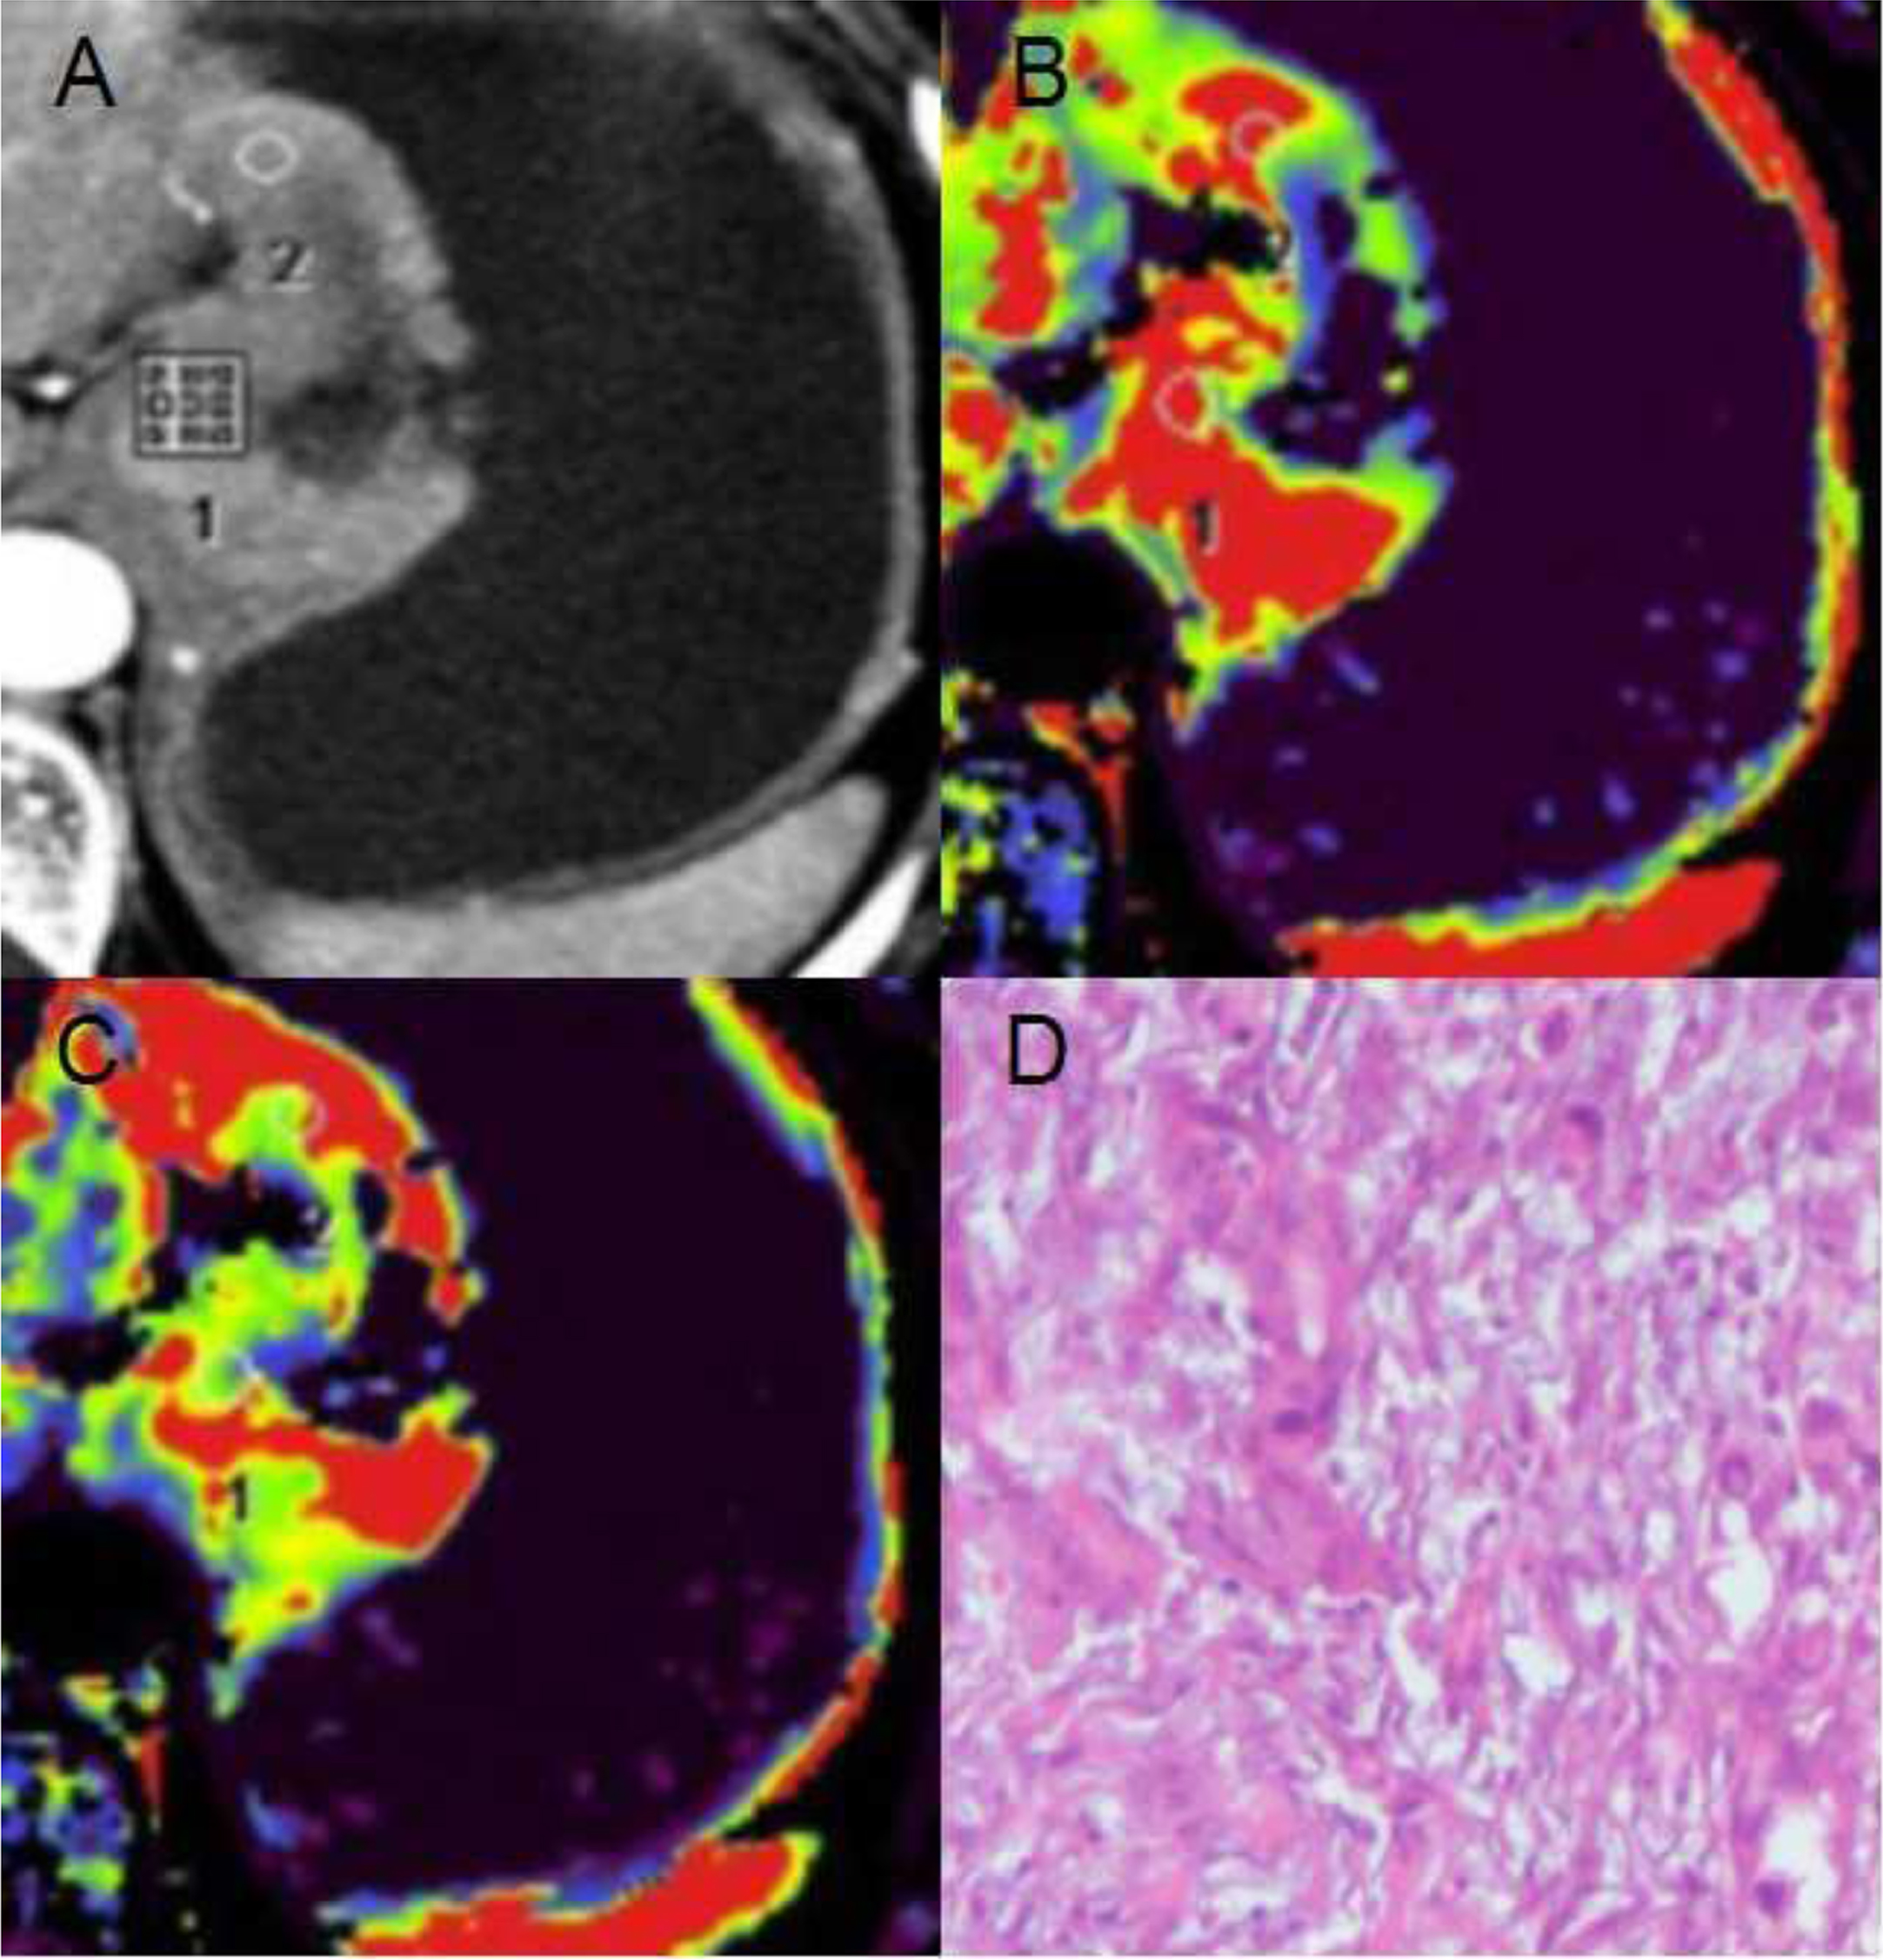
LDCTPI images in a 55-years-old man with adenocarcinoma in the cardia before NAC. A: An original image showed irregular tumor in the cardia with obvious enhancement. B-C: CT perfusion BF and BV images, respectively. In the BF and BV images, the tumor area was shown in red and yellow. D: A pathological image (HE staining, 100×) showed the poorly differentiated tubular adenocarcinoma cells with obvious pleomorphism.
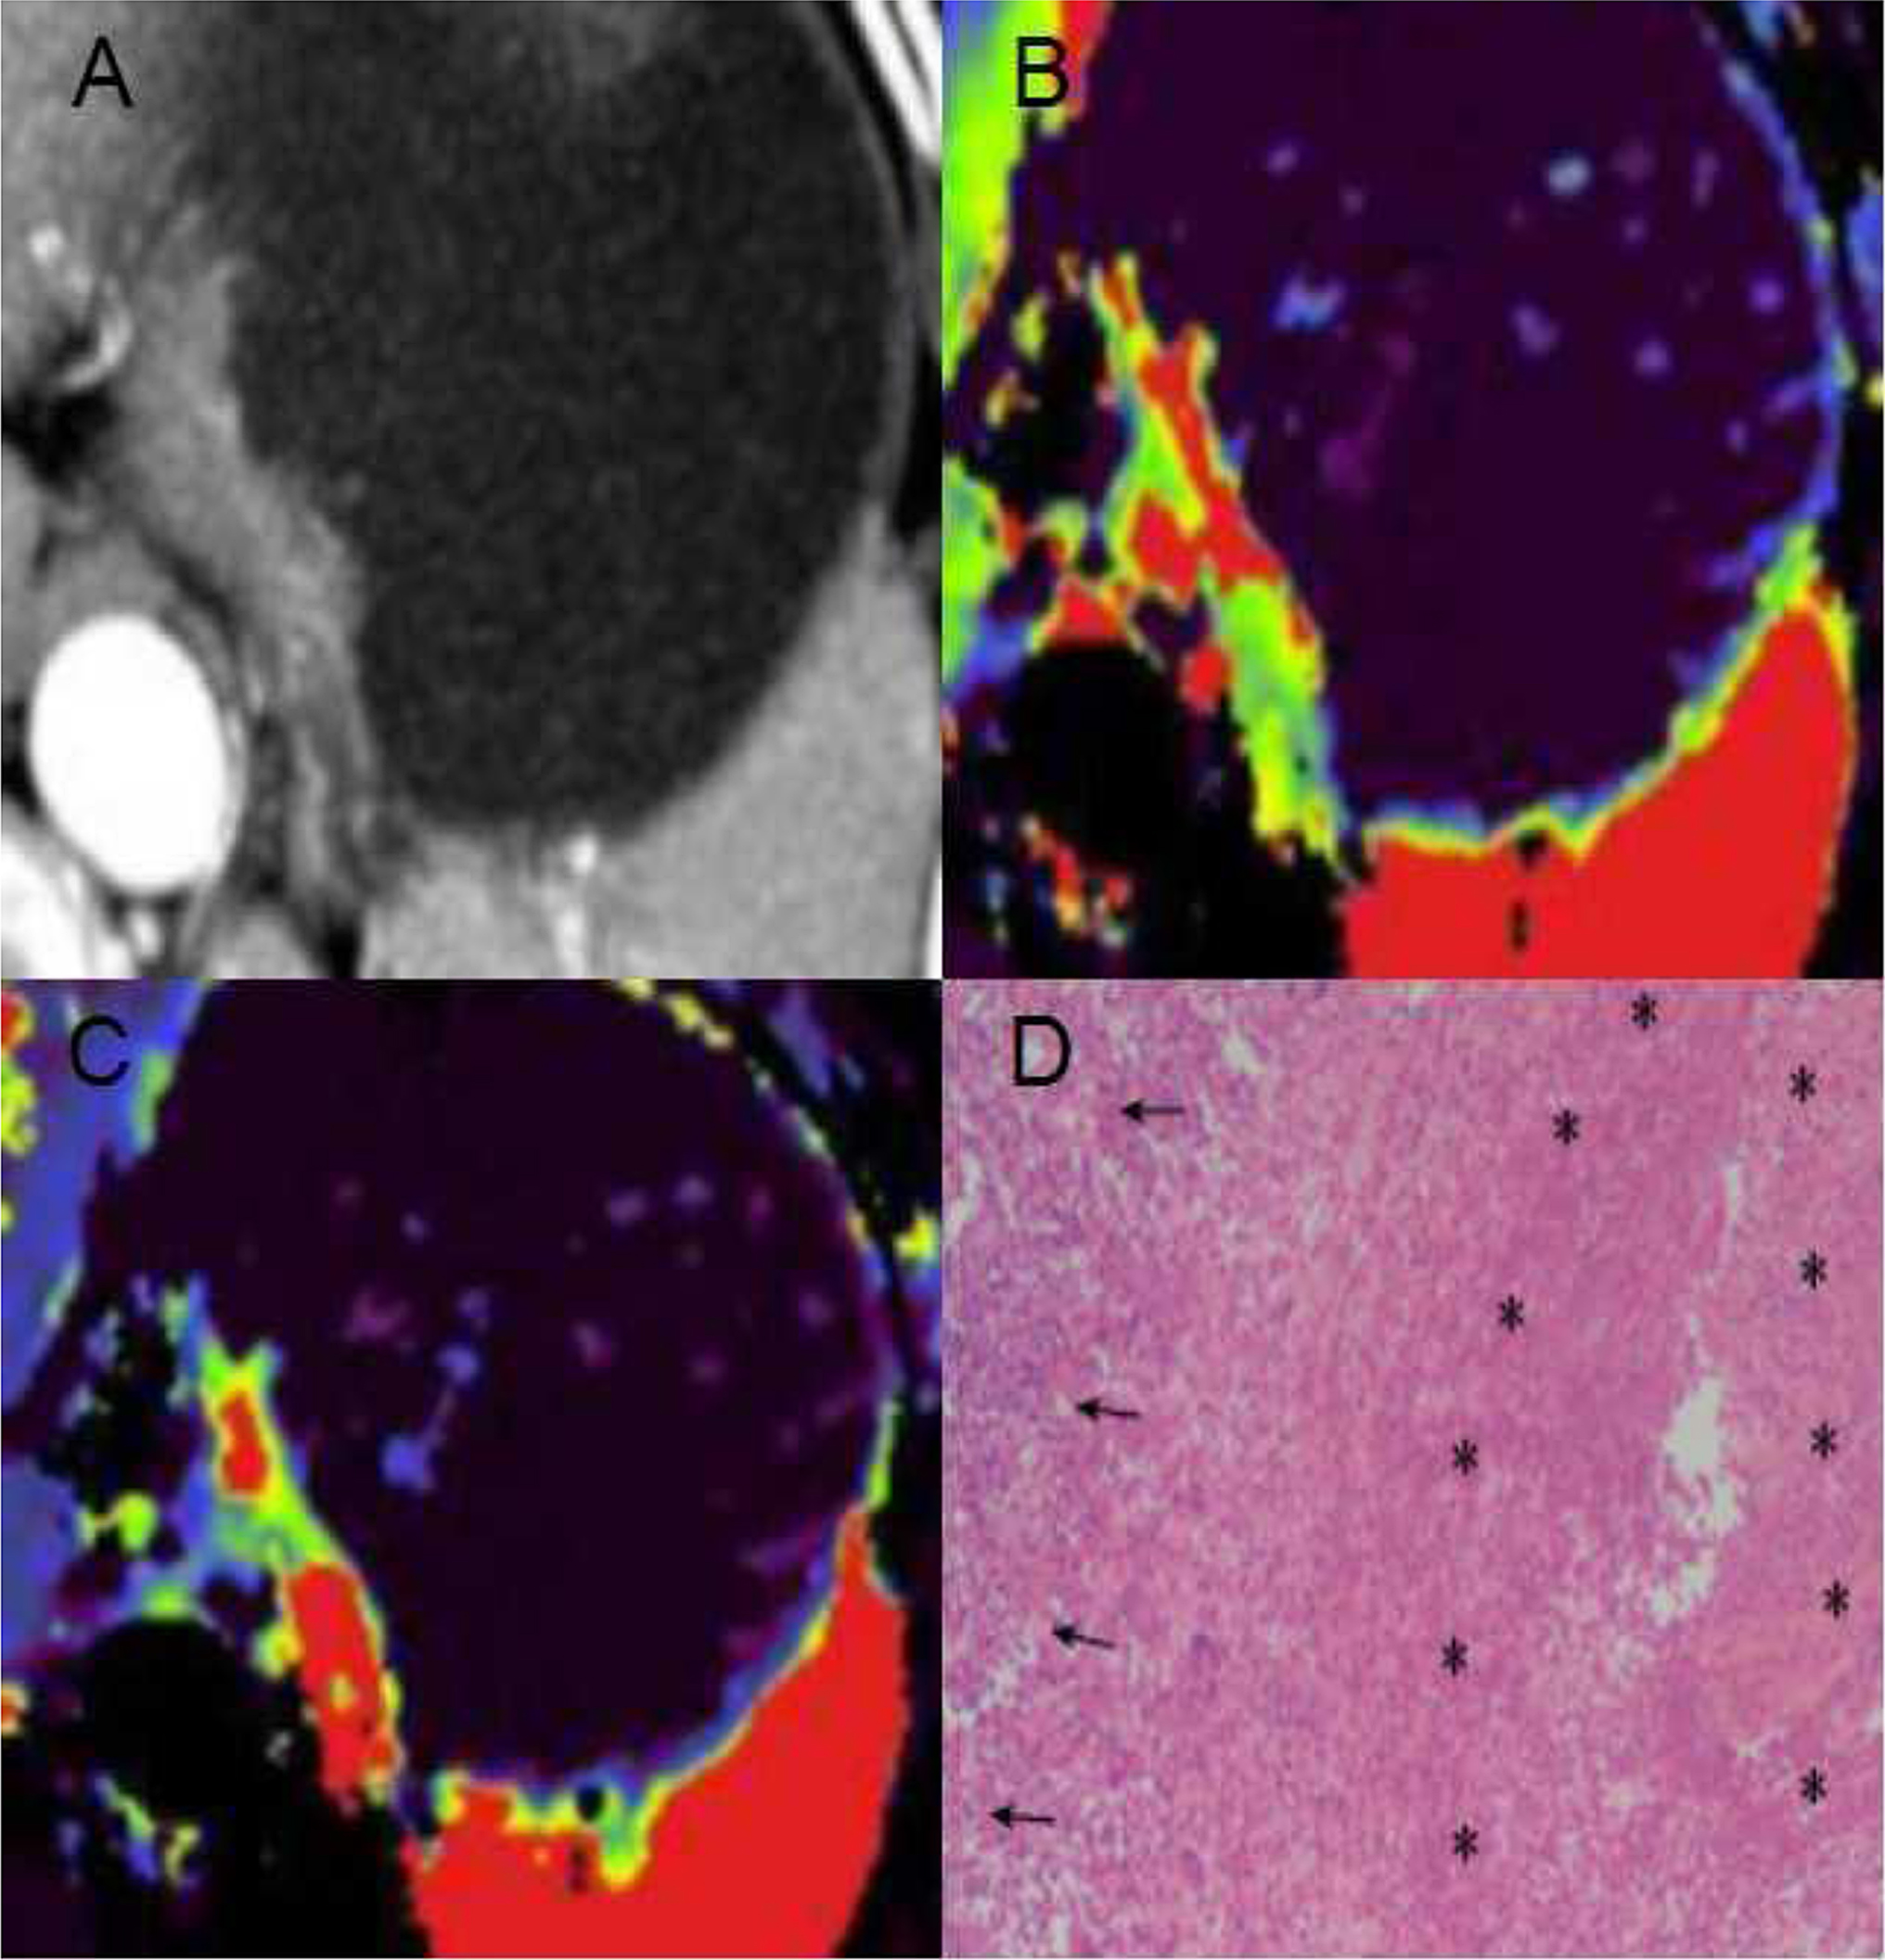
LDCTPI images in the same patient as Fig. 3 after 2 courses of NAC with ECF regimen. A: An original image showed that the tumor in the cardia was significantly smaller than Fig. 3. B-C: CT perfusion BF and BV images, respectively. In the BF and BV images, the tumor area was shown in red and yellow. D: A pathological image (HE staining, 40×) showed that there was more than two-thirds necrotic area (*) in the entire focus, but there were still cancer cells (↑), the result of pathological response to NAC was effective (grade 4).
Comparisons of BF and BV values between before NAC and after NAC in 30 patients with AGC (
The comparisons were performed by paired-samples t test between the 2 groups. There were significantly statistical differences in the BF and BV values, P < 0.001.
Comparisons of BF and BV decrease rates(%) between pathological effective group and pathological ineffective group in 30 patients with AGC (
The comparisons were performed by independent-samples t test between the 2 groups. There were significantly statistical differences in the BF and BV decrease rates, P < 0.01.
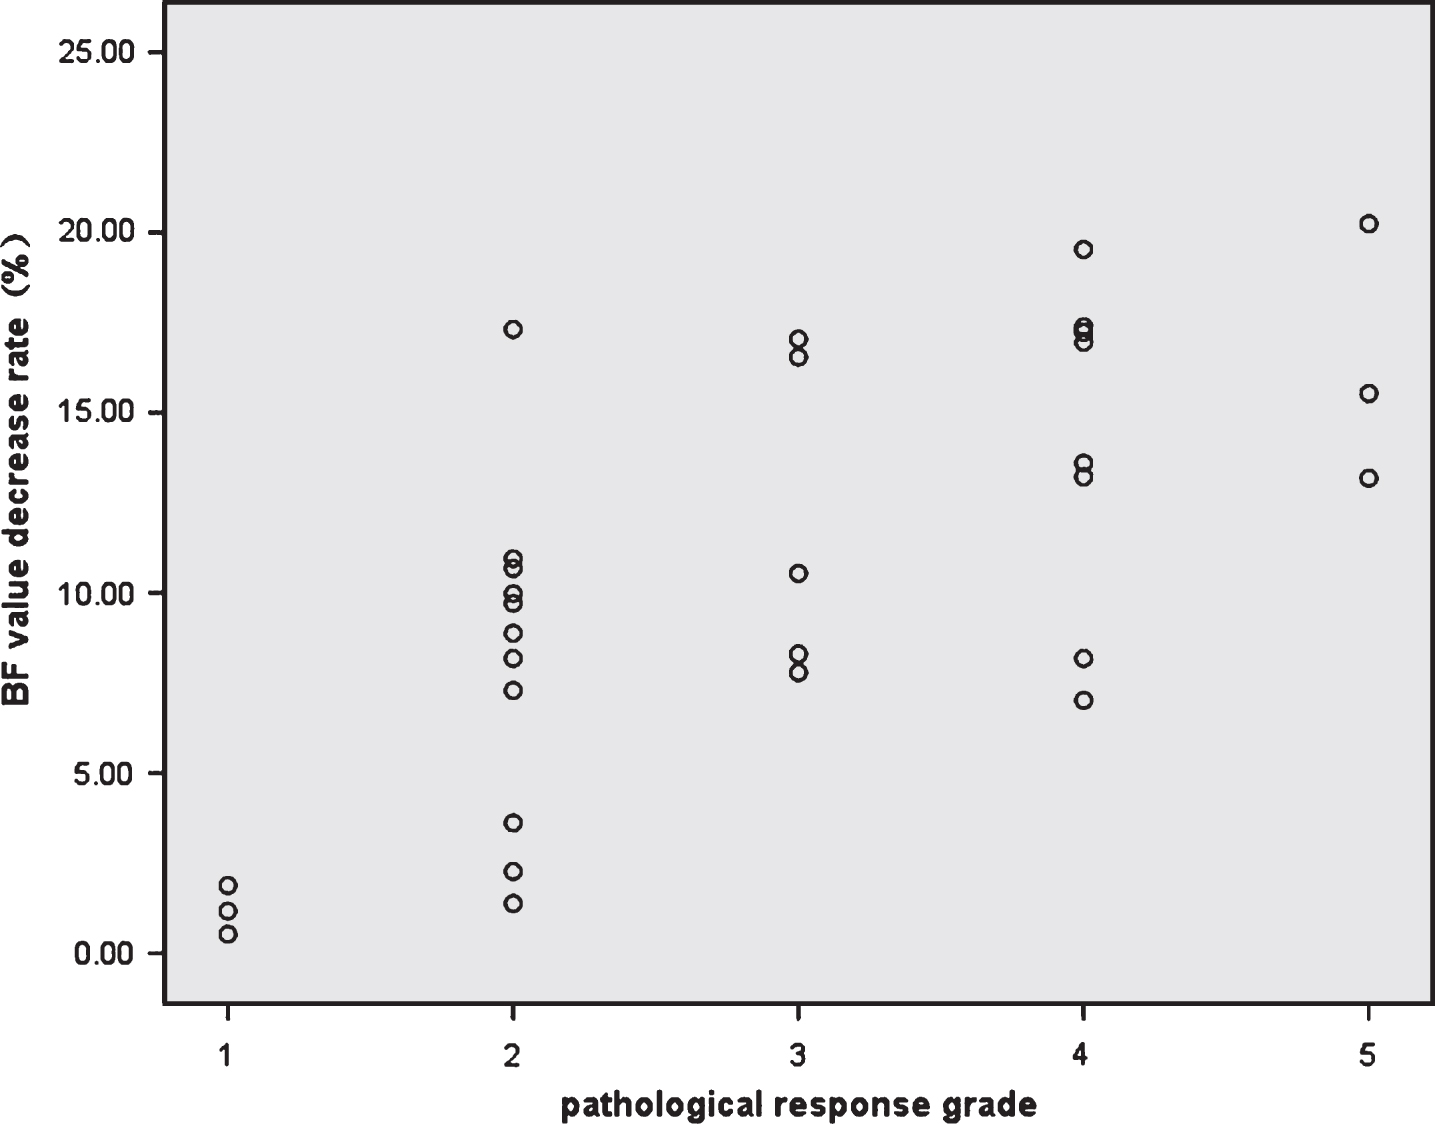
The correlation between BF value decrease rate after NAC and pathology response grade was analyzed by Spearman statistical test, and the statistical result showed that BF decrease rate was significantly correlated with pathology response grade(r = 0.660, p = 0.000).
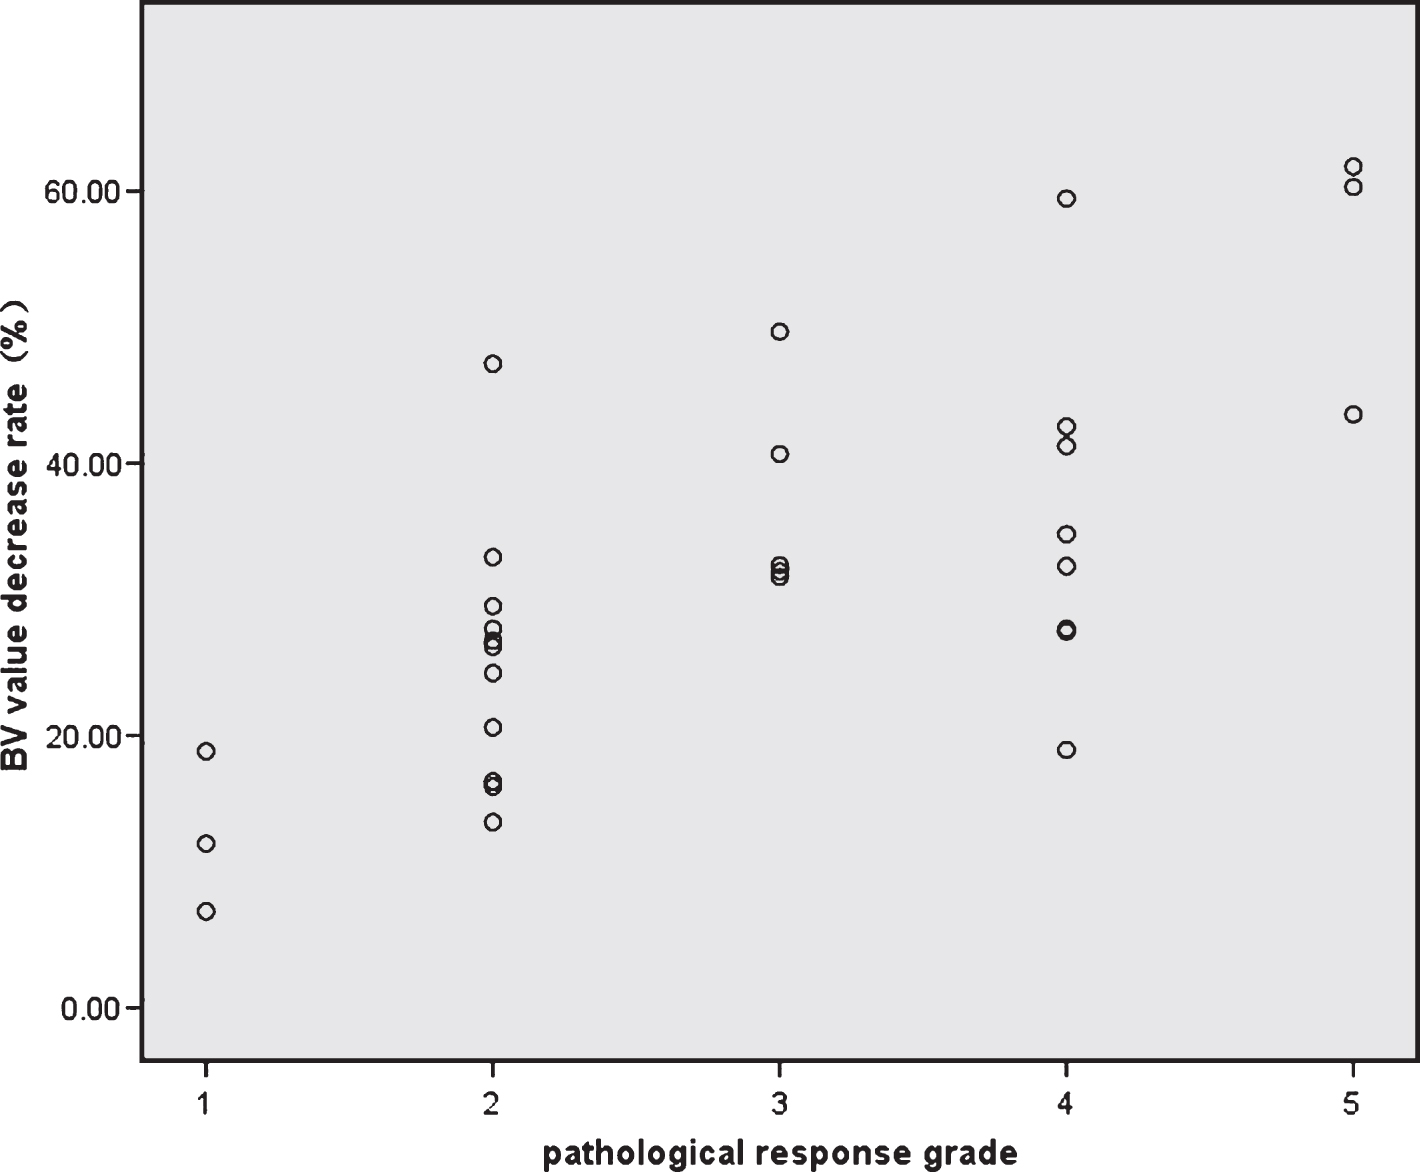
The correlation between BV value decrease rate after NAC and pathology response grade was analyzed by Spearman statistical test, and the statistical result showed that BV decrease rate was significantly correlated with pathology response grade(r = 0.706, p = 0.000).
A ROC curve (Fig. 7)was used to analyze diagnostic value of BF and BV decrease rates for predicting pathological efficacy of AGC after NAC, If BF decrease rate of 12.1% (AUC was 0.816, P = 0.005) was used as the cutoff value for chemotherapy effectiveness, the sensitivity of 82% and specificity of 84% were achieved; As well, if BV decrease rate of 32.8% (AUC was 0.844, P = 0.002) was used as the cutoff value for chemotherapy effectiveness, the sensitivity of 82% and specificity of 89% were achieved.
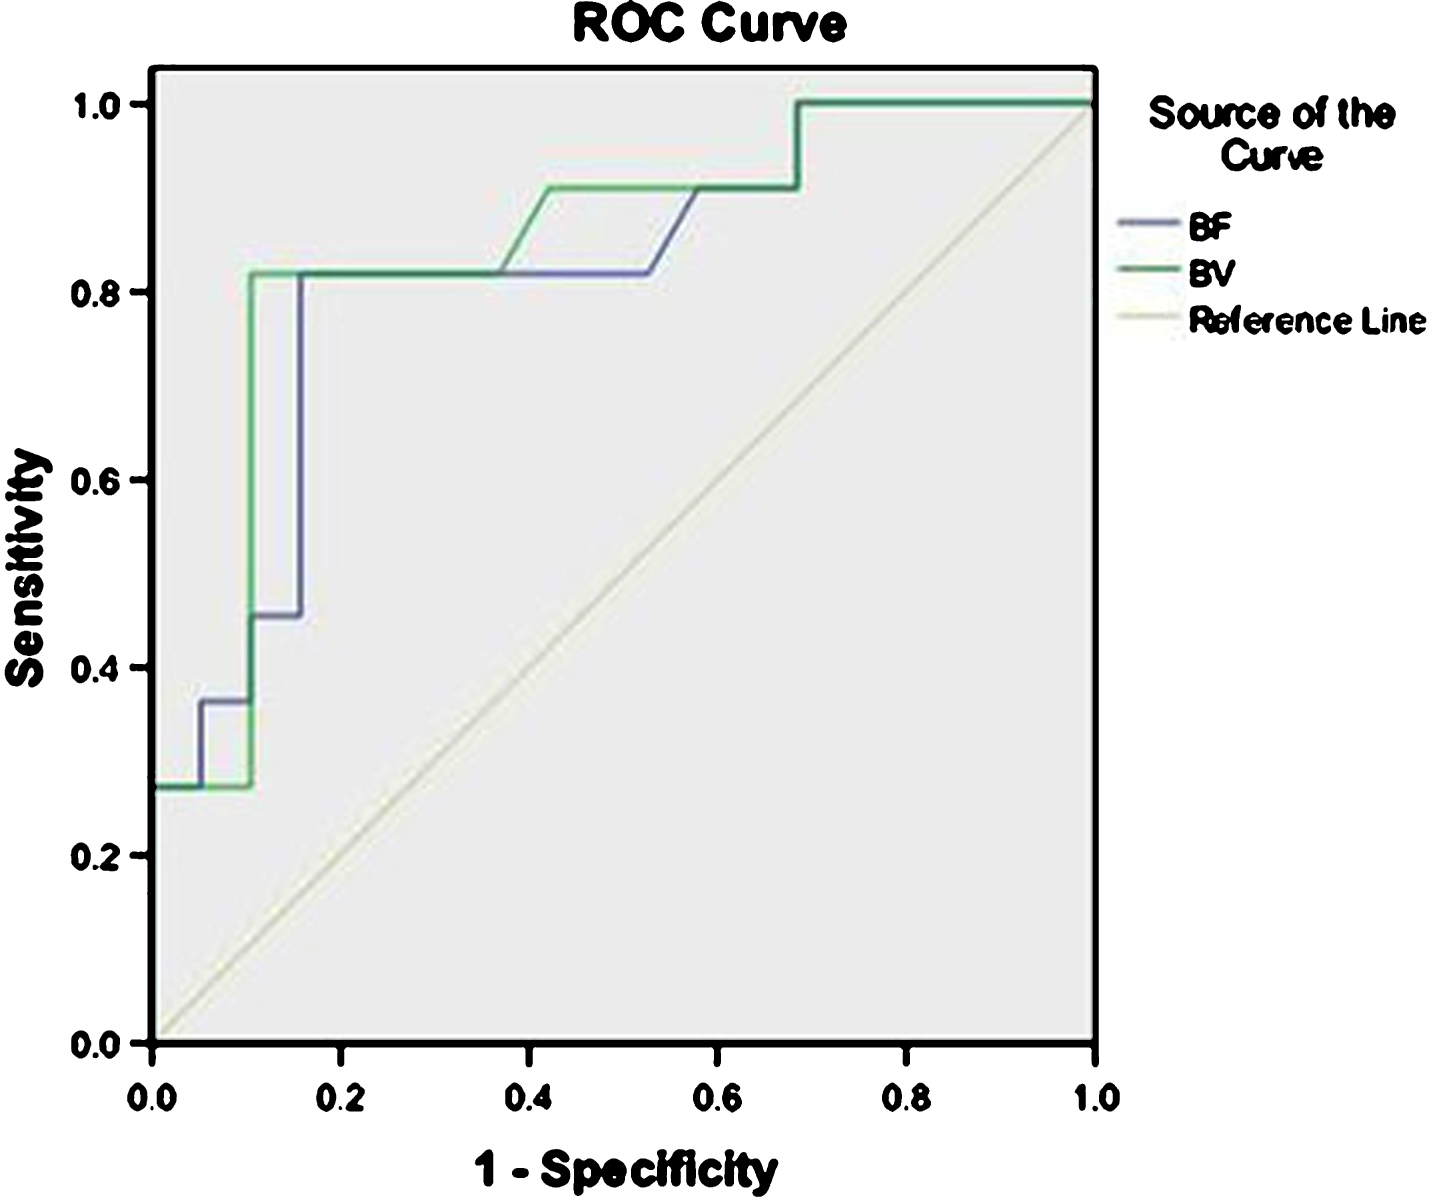
ROC curves of BF and BV decrease rates. ROC curves were used to analyze diagnostic value of BF and BV decrease rates for predicting pathological response to NAC in AGC, and the results showed that the AUC of BF decrease rate was 0.816(P = 0.005) and the AUC of BV decrease rate was 0.844(P = 0.002).
In general, CT perfusion scanning generated relatively large radiation dose, therefore it was necessary to correctly select scan method and optimize parameters for low radiation dose. After stomach cavity was filled with water, there was density difference between water or gas inside stomach and fat outside stomach. According to this condition, it was possible for us to use low-dose CT perfusion scan technique in stomach. We decreased radiation caused by CTPI from the following aspects [11]: (1) Tube voltage was decreased, when tube current was constant, decline of tube voltage from 120 kV to 80 kV could decrease radiation dose by 70%; Tube voltage in this study was 80∼100 kV. (2) It was also the usual method to decrease tube current, and tube current in this study was 50∼60 mAs. (3) A variety of image reconstruction algorithms were used to decrease image noise; As we knew, iterative reconstruction algorithm could decrease radiation dose while maintain good image quality. (4) Target scanning with small field of view (SFOV) was used, that is, the slice containing the largest tumor area was selected as the center slice, and local small-scale scanning was used to decrease radiation dose and improve image spatial resolution. According to actual situation of a patient, we optimized parameters and improved scan method so as to achieve the goal that image quality met diagnostic requirement while the patient received radiation dose as little as possible. In this study, radiation dose that LDCTPI generated was 2.8∼3.5 mSv (mean 3.1 mSv).
Because AGC was easy to relapse or metastasize, the overall prognosis was relatively poor. In recent years, domestic and foreign clinical studies [12–14] showed that preoperative chemotherapy (i,e., NAC) of AGC could improve surgical resection rate and prolong survival time. This therapeutic strategy had attracted more and more attention, the“Clinical Practice Guidelines in Gastric Cancer”[15, 16] listed NAC into recommendation for treatment of AGC. ECF chemotherapy regimen (epirubicin 50 mg/m2, intravenous drip, on day 1; cisplatin 60 mg/m2, intravenous drip, on day 1; 5-FU 200 mg/m2, intravenous drip, on day 1–21, being repeated every 21 days) was performed in all subjects in this study. Objective of NAC was to increase operable opportunity of AGC, and it was inadvisable to blindly pursue chemotherapy effectiveness but delay resection opportunity of the tumor.
Evaluation of chemotherapy efficacy relied on advanced diagnostic technology. At present, efficacy evaluation of gastric cancer was generally performed by ultrasonography and routine CT examination to measure diameter or volume changes of the tumor after chemotherapy, which only depended on morphological changes to assess efficacy, but diameter and volume measurements of the tumor were easily affected by gastric filling, peristalsis, gross tumor morphology, measuring angle and many other factors, so the measured values were not accurate and had poor reproducibility. Meanwhile, after chemotherapy, fibrosis and edema occurred in the tumor area so that tumor’s T staging was not accurate. Therefore, the new technique about chemotherapy efficacy evaluation from a functional perspective had become a research focus in imaging academia, and CTPI was exactly a functional imaging technique. In theory, functional change of gastric cancer after NAC had occurred before morphological change, and functional change mainly manifested hemodynamic change. Meanwhile there were rich tumor vessels in gastric cancer, the impact of chemotherapy on perfusion was large. In this study, there were significantly statistical differences in the BF, BV values between before NAC and after NAC (p < 0.01, respectively). Therefore, it was feasible to measure changes of CT perfusion parameters after chemotherapy to early evaluate efficacy of NAC in AGC.
According to pathological efficacy evaluation standard, there were 11 cases with effective response and 19 cases with ineffective response in this study, and there were significantly statistical differences for the BF and BV decrease rates between pathological effective group and pathological ineffective group (p < 0.01, respectively). We analyzed the relationship between the BF and BV decrease rates and pathological response grade of AGC after chemotherapy, and the results of this study showed that the percentage BF and BV decrease rate were significantly correlated with pathology response grade(r = 0.660, r = 0.706, p < 0.01, respectively). If BF decrease rate of 12.1% was used as the cutoff value for chemotherapy effectiveness of AGC, the sensitivity of 82% and specificity of 84% were achieved; As well, if BV decrease rate of 32.8% was used as the cutoff value for chemotherapyeffectiveness, the sensitivity of 82% and specificity of 89% were achieved. Hansen et al. [17] reported that tumor volume and CT perfusion parameter PS value significantly decreased after 3 courses of chemotherapy in gastric adenocarcinoma, if PS decrease rate of 25% was used as threshold, its sensitivity and specificity predicting pathological response to NAC were 69% and 58%, respectively. Djuric-Stefanovic et al. [18] reported that BF and BV values significantly decreased when NAC and radiation therapy in esophageal squamous cell carcinoma was effective, wherein BF value after the NACRT <30.0 ml/min/100 g predicted complete tumor regression. Lee et al. [19] analyzed correlation between tumor volume or positive lymph nodes diameter and pathological evaluation, and believed that tumor volume had better correlation with pathological evaluation, if tumor volume decrease rate of 35.6% was used as threshold for evaluating chemotherapy effectiveness in AGC, its sensitivity and specificity were 100% and 58.8%, respectively. Because lymph nodes were too small to accurately measure perfusion parameters values in this study, we did not analyze the correlation between perfusion parameters of lymph node and pathological evaluation.
Our study had several limitations. Firstly, it was difficult for CT perfusion examination to detect small tumor and ulcerative gastric cancer, our study focused on the AGC which the diameter of the mass ranged from 2.5 cm to 6.5 cm. Secondly, the artifact due to respiration was minimized but not avoided, which may limit the quality of images and interfere with the results of perfusion parameters values. Finally, because the period of NAC for gastric cancer was long, the cases of 30 patients with AGC recruited in this study had a limitation of relatively small study group.
In summary, CTPI is a functional imaging technology from the perspective of hemodynamics, and the BF and BV decrease rates could serve as evaluation indicators of AGC after NAC. They could provide a basis for clinical treatment and help clinicians to implement personalized chemotherapy plan in AGC.
Conflict of interest statement
The authors have no conflict of interest to report.
Footnotes
Acknowledgments
This study was supported by the grants from the science foundation of Wuxi Health and Family Planning Commission in China (MS201643), Wuxi Hospital Management Center in China (YGM123) and Jiangsu province Health and Family Planning Commission in China (Q201615). We would like to acknowledge Professor Hu Chun-Hong for his technical help.