
Abstract
PURPOSE:
To explore the characteristics of breast cancer and breast fibroadenoma using low-dose computed tomography perfusion imaging (LDCTPI) including specific perfusion parameter values, and seek the potential clinical applications in cancer prognosis assessment.
MATERIALS AND METHODS:
Fifty patients including 30 diagnosed with breast cancer and 20 with breast fibroadenoma, as well as 15 control subjects with normal breasts were studied prospectively using LDCTPI examinations. The acquired volumetric imaging data were used for calculation, mapping and analysis by using a body tumor perfusion protocol in the CT perfusion software to measure 4 parameters: blood flow (BF), blood volume (BV), mean transit time (MTT), and the permeability surface (PS) area product. Statistical data analysis was then performed to distinguish the difference of the 4 parameter values among normal control, breast cancer and breast fibroadenoma cases.
RESULTS:
The mean perfusion values of 15 normal controls were as follows: BF, 20.03±4.08 mL/100 g/min; BV, 4.53±0.95 mL/100 g; MTT, 5.90±0.82 s; and PS, 9.25±1.18 mL/100 g/min. The mean perfusion values of 30 cancer patients were as follows: BF, 56.67±6.59 mL/100 g/min; BV, 5.82±0.68 mL/100 g; MTT, 6.01±0.82 s; and PS, 24.95±5.05 mL/100 g/min. The mean perfusion values of 20 patients with breast fibroadenoma were as follows: BF, 46.24±6.65 mL/100 g/min; BV, 5.07±0.73 mL/100 g; MTT, 7.51±0.62 s; and PS, 16.73±6.48 mL/100 g/min. Comparing the 3 groups, differences were all statistically significant for BF, BV, MTT and PS values (p < 0.05, respectively); The BF, BV, PS values were highest in group of cancer patients, while the MTT value was highest in group of patients diagnosed with breast fibroadenoma.
CONCLUSION:
Breast CT perfusion imaging is a promising functional imaging technology in breast cancer diagnosis, which can provide valuable quantitative imaging markers to assist evaluation of breast tumors.
Keywords
Introduction
Breast cancer is a significant cause of mortality and morbidity for women worldwide and is the most common cancer diagnosed in women, presenting a serious threat to female health [1–3], and breast fibroadenoma is the most common benign tumor occurring in the breast [4]. An imaging examination occupies a pivotal position in the diagnosis and evaluation of breast tumor. At present, ultrasonography (US) is a commonly used adjunctive imaging method with mammography for detecting breast tumor. However, the high false-positive rate and its operator dependence are of concern. Furthermore, because of its insufficient contrast resolution, US has limited value for detecting small breast calcifications associated with cancer [5–7]. Magnetic resonance imaging (MRI) generally has higher sensitivity but lower specificity for detecting breast cancer compared with mammography and US; What is more, MRI has some other weaknesses, such as the high cost, complexity of interpretation, lengthy inspection times, and contraindications (claustrophobia, implanted devices, or renal insufficiency), and these issues limit its use in breast screening [8].
However, angiogenesis is the formation of new tumor supplying vessels from a preexisting vasculature. It is crucial for the tumor growth and distant metastasis via the penetration of cancer cells into the blood circulation. Vascular endothelial growth factor (VEGF), platelet-derived endothelial cell growth factor, and basic fibroblast growth factor, produced by tumor cells induce neovascularization [9]. LDCTPI could evaluate tumor angiogenesis because neoangiogenesis may increase blood flow and vascular permeability in the tumor tissues. LDCTPI is an important means used to reflect the microcirculation of tissue and organs because it can achieve the early diagnosis and prognosis of tumors [10].
Therefore, we attempt to functionally improve the detection of breast tumor. LDCTPI is a novel functional examination technology that was developed recently [11]. Its advantages include rapid scanning speed, routine availability; Further, one of the greatest advantages of CT perfusion imaging is the linear relationship between CT attenuation and iodine-based contrast concentration compared with other modalities, and this allows for an absolute quantification of perfusion parameters [12]. In 1991, Miles et al. [13, 14] first proposed the concept of CT perfusion imaging. Currently, LDCTPI has attracted wide research interest in stomach [15], head [16], lung [17], liver [18], pancreas [19], and other organ imaging studies.
In this study, we focused on measuring CT perfusion parameter values in patients with breast cancer, breast fibroadenoma, and normal breast tissue. The measurements from the 3 groups were compared to evaluate potential clinical applications of these CT perfusion parameters in breast cancer and breast fibroadenoma.
Materials and methods
Patients
The study was approved by the Scientific Committee and the equivalent of the institutional review board of our hospital. Each participant understood the procedure, including the radiation dosage of CT perfusion imaging. Written informed consent was obtained from each subject. From February 2016 to November 2017, 30 patients with breast cancer and 20 patients with breast fibroadenoma confirmed by means of needle biopsy were prospectively recruited. The study cohort enrolled 50 patients with 50 tumors in total, including 50 female with an age range of 23–73 years old (mean age, 58 years old). Among the 50 tumors, the diameter range of breast tumor was 2.0–6.5 cm (mean 4.2 cm). According to the pathological type of tumor tissue, there were 14 cases of invasive ductal carcinoma, 5 cases of invasive lobular carcinoma, 3 cases of intraductal carcinoma, 2 cases of lobular carcinoma in situ, 1 cases of medullary carcinoma, 5 cases of mucinous adenocarcinoma, and 20 cases of fibroadenoma in this study all patients underwent surgical treatment. Meanwhile 15 control subjects were voluntarily recruited and performed LDCTPI examination.
Perfusion CT study protocol
First, All breasts were conventionally plain-scanned on a 64-slice spiral CT scanner (Siemens Sensation 64, Germany) with the following parameters: a slice thickness and spacing of 5 mm, tube voltage 120 kV, tuber current 250 mAs, a matrix of 512×512 pixels, and pitch of 0.984:1. Then, based on the plain CT image, LDCTPI was performed, the slice containing the largest breast tumor area was selected as the center slice, and a total of 6 nearby slices including the center slice were selected every 3 cm on the Z-axis. These slices were scanned with a small field of view (SFOV) at a 5 mm slice thickness, 120 kV, and 60 mAs. 50 mL bolus of iopamidol (Iopamiro; Bracco; Shanghai, China) containing 300 mg of iodine per mL was injected using a power injector (MEORAO-Stellant, MEO-RAO Company, Germany) via an antecubital vein at a rate of 5 mL/s through an 18-gauge intravenous cannula. Scanning commenced 5 s after contrast agent injection and the scan duration was 30 s. The dynamic perfusion sequence produced a total of 180 images.
Image interpretation
Data from the dynamic perfusion scan were transmitted to an advantage workstation (ADW4.0, Siemens company) systems. A tumor perfusion protocol in the body CT perfusion 3.0 software (deconvolution method) was then used for data processing. The aorta was selected as the input artery and pseudo-color (pcolor) perfusion images were obtained through workstation processing. The red sections in the pseudo-color images of BF, BV, MTT and PS denoted high blood perfusion. On the contrary, the purple sections in the pseudo-color images of BF, BV, MTT and PS denoted low blood perfusion. The region of interest (ROI) which should be no less than half of the maximum area of the target lesions was drawn as large as possible around the tumor to reduce noise, and the necrotic area was avoided. The corresponding perfusion parameters, namely blood flow (BF), blood volume (BV), mean transit time (MTT), and the permeability surface (PS) area product were measured. Measurements of all perfusion parameters were repeated 3 times and the averages of the 3 measurements were shown.
Pathological methods
Firstly, the specimens were examined for gross pathological changes. Then, a part of diseased lesion was cut and sectioned, and the sections were stained using conventional smear and hematoxylin and eosin (HE) staining techniques. Under a microscope at 40×magnification, the morphology, arrangement and growth pattern of the tumor cells were observed.
Statistical analysis
The perfusion parameters BF, BV, MTT, and PS values were expressed as the mean±standard deviation (
Results
All CT perfusion series were usable for the analysis without significant motion or respiration artifacts, and the LDCTPI generated small radiation dose with a range of 2.8 ~ 3.5 mSv (mean 3.1 mSv).
CT perfusion image manifestations of normal breast
The breast skin of normal breast was smooth and thin, the glands in the mammary were evenly distributed and no lumps were seen. The enhancement degree of the glands was slight (Figs. 1(A) and (F)). The color distribution of the breast glands was homogeneous in the BF, BV, MTT and PS images, presenting the purple region (Figs. 1(B)–(E)).

Low-dose CT perfusion images in a 46-years-old woman with normal breast. A: An original image showed a breast with smooth and thin skin, uniform gland, homogeneous and slight enhancement features (ROI). B–E: CT perfusion pcolor images for BF, BV, MTT and PS, respectively. In the BF, BV, MTT and PS images, the mammary gland area was shown in purple. F: A CT plain scan image. Abbreviations: blood flow (BF), blood volume (BV), mean transit time (MTT), and the permeability surface (PS).
In one case, the skin of the breast with breast cancer were thickened, presenting masses with burr, phyllode, small calcification, axillary adenopathy, obvious and inhomogeneous enhancement (Fig. 2(A)). The BF, MTT and PS images generally showed dominant lesions in yellow, The BV image showed lesions mainly in blue (Figs. 2(B)–(E)). Most breast cancers were invasive ductal carcinoma with a certain degree of pleomorphism cells, cord-like or small nest-like arrangement, deeply stained nucleoli, and glandular duct structures disappearance (Fig. 2(F)). Breast cancer cells penetrated the ductal wall and formed mass, edge of a lump presented the radial burrs or tentacles, the tumors had ingredients including cancer cells, connective tissue, necrotic tissue, calcification, hemorrhage focus and hemosiderin, etc. This group included 14 cases of invasive ductal carcinoma, 5 cases of invasive lobular carcinoma, 3 cases of intraductal carcinoma, 2 cases of lobular carcinoma in situ, 1 cases of medullary carcinoma, 5 cases of mucinous adenocarcinoma.
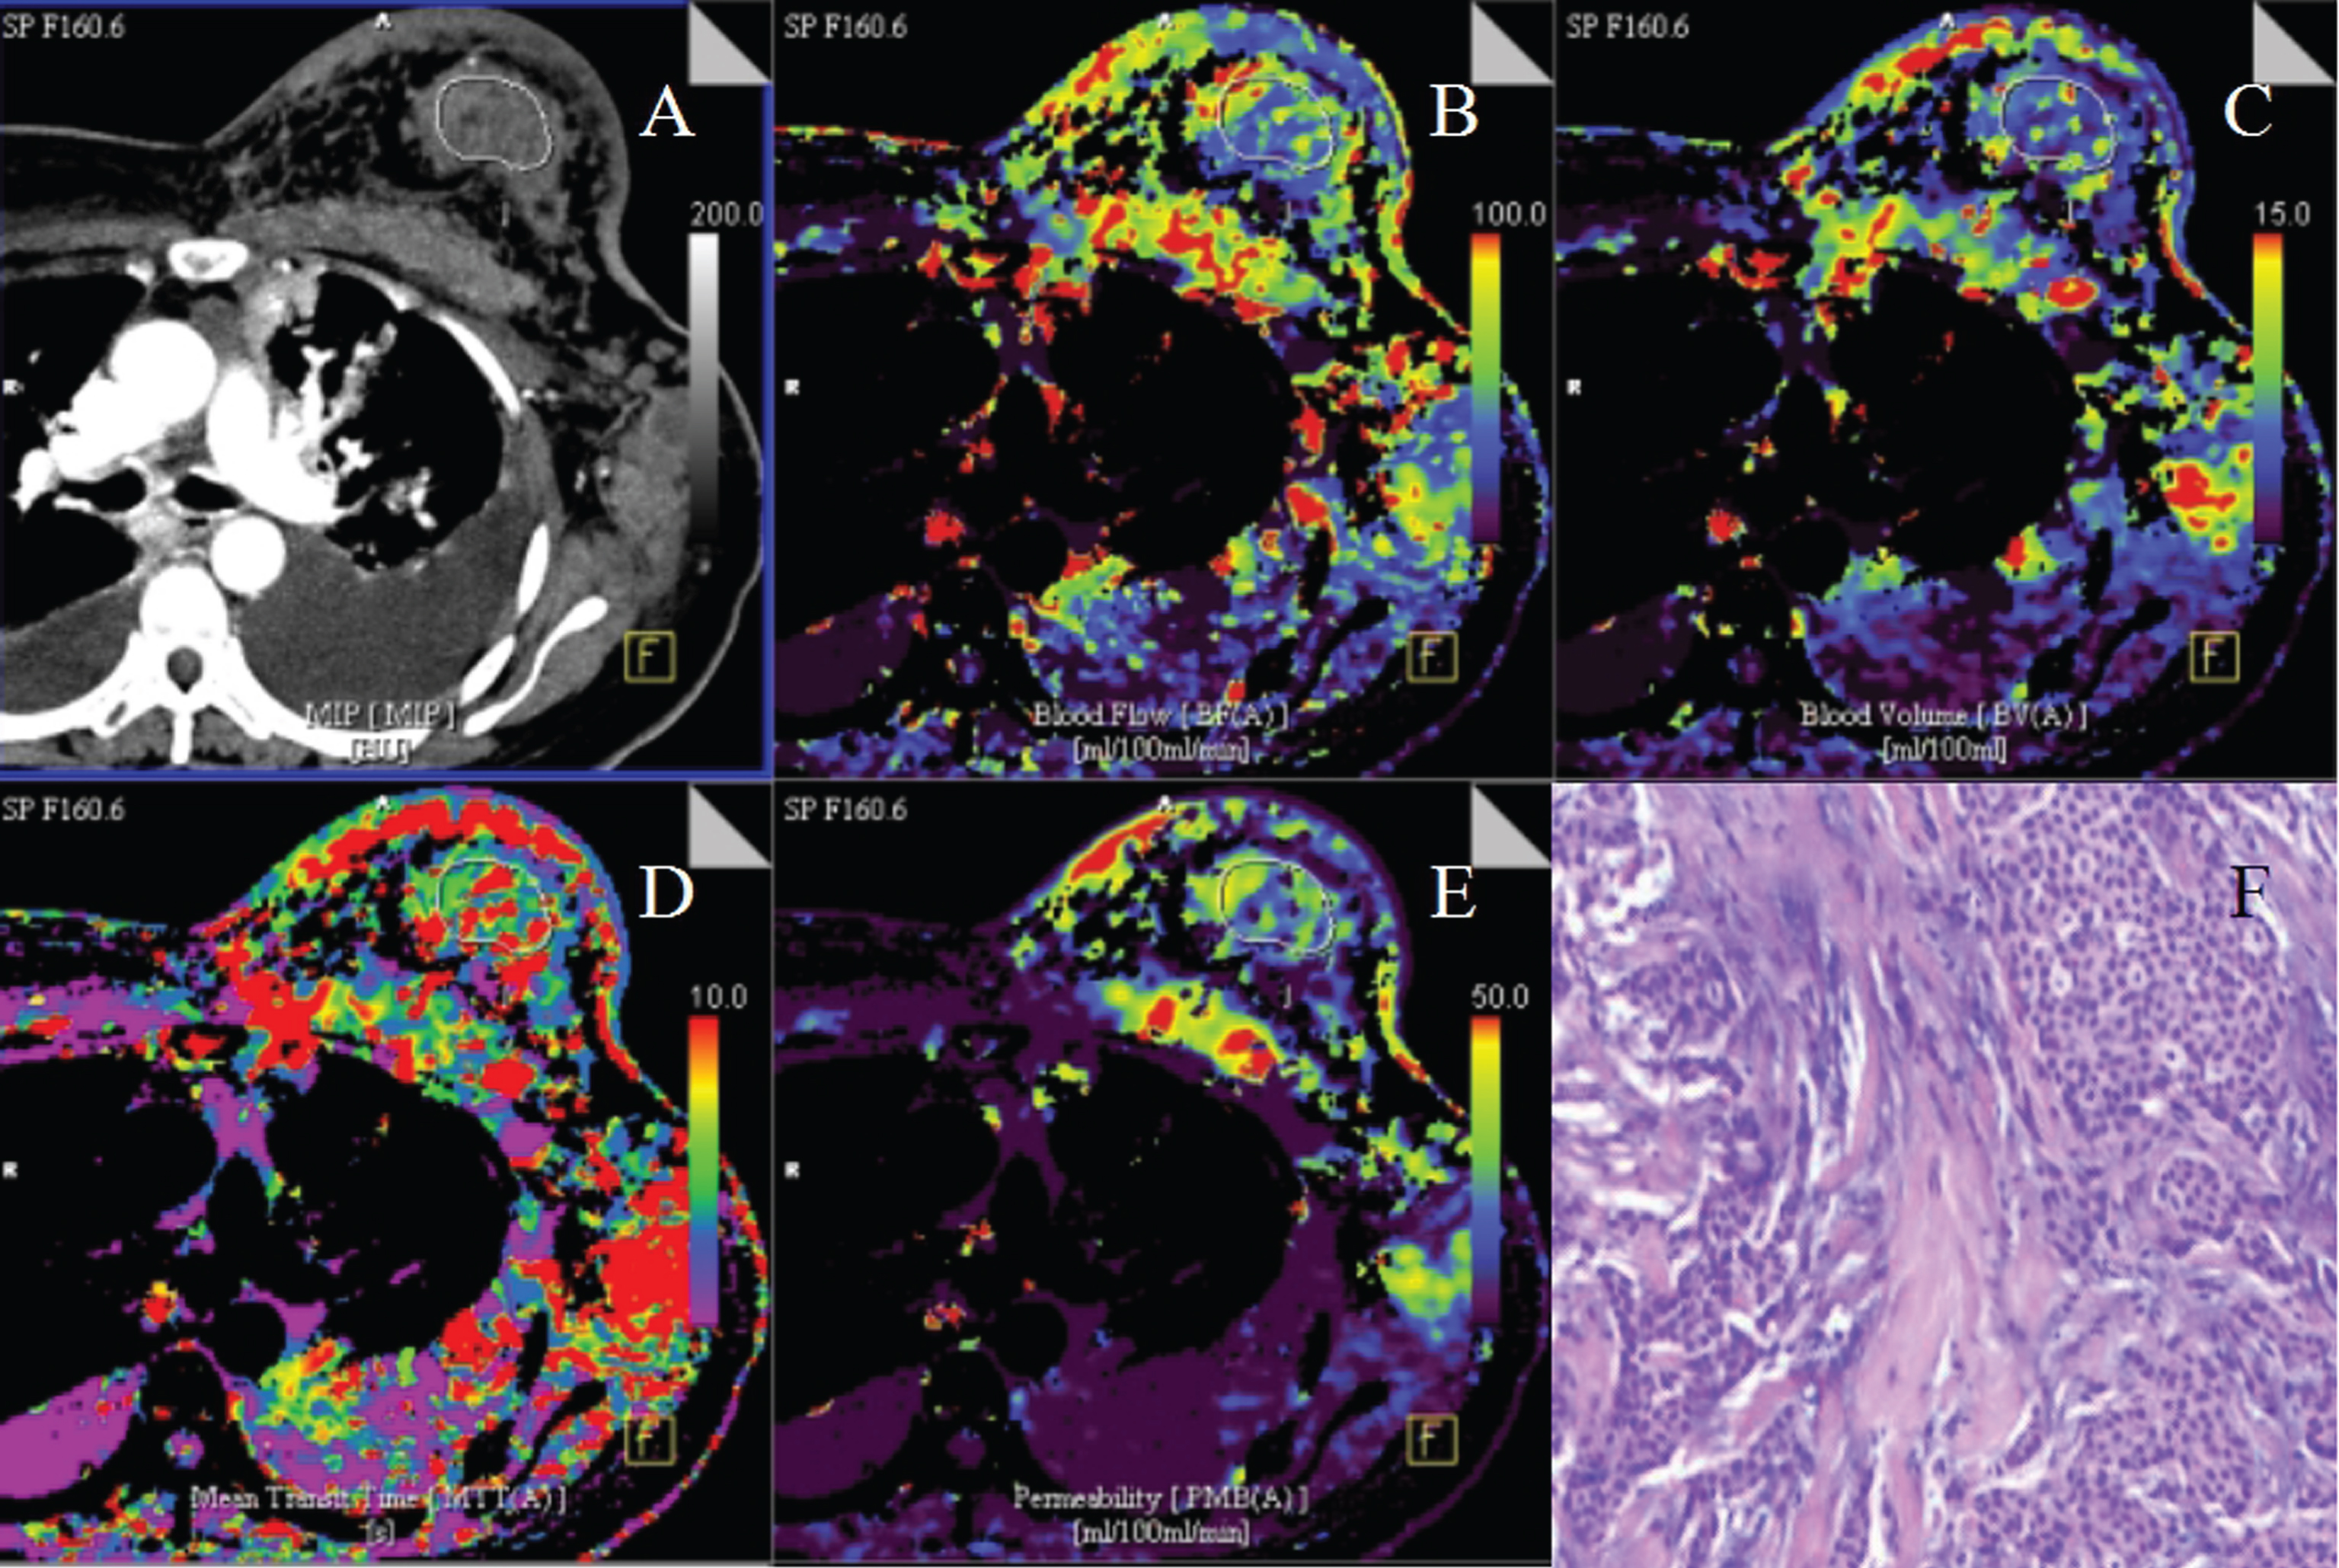
Low-dose CT perfusion images in a 35-years-old woman with invasive ductal carcinoma. A: An original image showed a breast mass with irregular shape, phyllode, axillary adenopathy, thicken skin, and inhomogeneous enhancement features (ROI), as well as hydrothorax in the thoracic cavity. B–E: CT perfusion pcolor images for BF, BV, MTT and PS, respectively. In the BF, MTT and PS images, the tumor area was shown in yellow or red; in the BV image, the tumor area was shown in blue. F: A pathological image (HE staining, 40×) showed the tumor cells with a certain degree of pleomorphism and cord-like or small nest-like arrangement, deeply stained nucleoli, and glandular duct structures disappearance. Abbreviations: blood flow (BF), blood volume (BV), mean transit time (MTT), and the permeability surface (PS).
In this study, one case of breast fibroadenoma presented masses with round or oval shape, smooth outline, clear boundary, moderate enhancement (Fig. 3(A)). The BF image showed lesions mainly in yellow, the BV, MTT and PS images generally showed dominant lesions in blue (Figs. 3(B)–(E)). Under the microscope, most breast fibroadenomas showed the disorder of mammary gland flocculus structure, the hyperplasia of the gland and fibrous tissue, the myxoid degeneration and hyaline degeneration of interstitial tissue, and the capsular formation of fibroadenoma (Fig. 3(F)).

Low-dose CT perfusion images in a 42-years-old woman with fibroadenoman. A: An original image showed a breast mass with round or oval shape, smooth margin, and homogeneous enhancement features (ROI). B–E: CT perfusion pcolor images for BF, BV, MTT and PS, respectively. In the BF image, the tumor area was shown in yellow; in the BV, MTT and PS images, the tumor area was shown in blue. F: A pathological image (HE staining, 40×) showed the disorder of mammary gland flocculus structure, the hyperplasia of the gland and fibrous tissue, the myxoid degeneration and hyaline degeneration of interstitial tissue. Abbreviations: blood flow (BF), blood volume (BV), mean transit time (MTT), and the permeability surface (PS).
Measurements of all perfusion parameters were repeated 3 times and the averages of the 3 measurements were shown. The inter-measurement difference between the 3 repeated measurements were not statistically significant (p > 0.05, respectively).
CT perfusion parameters values from normal breast and breast cancer showed that the BF, BV, MTT and PS values of breast cancer were higher than normal breast. The independent sample t test was used for comparisons between the two groups. Differences for BF, BV and PS values were all statistically significant (p < 0.05, respectively), while the MTT value showed no statistical difference (p > 0.05). The results were shown in Table 1.
Comparison of CT perfusion parameters values between normal breast and breast cancer (
s)
Comparison of CT perfusion parameters values between normal breast and breast cancer (
There is a statistical significance for the BF, BV, PS values, P < 0.05. Abbreviations: blood flow (BF), blood volume (BV), mean transit time (MTT), and the permeability surface (PS).
CT perfusion parameters values from normal breast and breast fibroadenoma showed that the BF, BV, MTT and PS values of breast fibroadenoma were higher than normal breast. Differences for BF, MTT, and PS values were all statistically significant (p < 0.05, respectively), while the BV value showed no statistical difference (p > 0.05). The results were shown in Table 2.
Comparison of CT perfusion parameters values between normal breast and breast fibroadenoma (
There is a statistical significance for the BF, MTT, PS values, P < 0.05. Abbreviations: blood flow (BF), blood volume (BV), mean transit time (MTT), and the permeability surface (PS).
CT perfusion parameter values from breast fibroadenoma and breast cancer showed that the BF, BV and PS values of breast cancer were higher than breast fibroadenoma, while the MTT value was lower. Differences for BF, BV, MTT and PS values were all statistically significant (p < 0.05, respectively). The results were shown in Table 3.
Comparison of CT perfusion parameters values between breast cancer and breast fibroadenoma (
There is a statistical significance for the BF, BV, MTT and PS values, P < 0.05. Abbreviations: blood flow (BF), blood volume (BV), mean transit time (MTT), and the permeability surface (PS).
CT perfusion images and perfusion parameter analysis of normal breast
The breast is composed of fatty and dense glandular and fibrous tissues. The arterial blood supply of normal breast consists of three parts: subdermal vasoganglion, anterior and posterior glandular vasoganglion. Compared with the liver and spleen organs, the mammary gland contains a lot of adipose tissue, and its blood supply is not richer as the liver and spleen. In this study, normal breast tissue was in low perfusion state, the mean perfusion values of normal breast (n = 15) were as follows: BF, 20.03±4.08 mL/100 g/min; BV, 4.53±0.95 mL/100 g; MTT, 5.90±0.82 s; and PS, 9.25±1.18 mL/100 g/min. The pseudo color BF, BV, MTT and PS images showed normal breast tissue mainly in purple. Therefore, the CT perfusion values of normal breast were low. We found a study by Sadako et al. [20] showing that the breast tumors could be distinguished based on the perfusion values, and the BF perfusion value was 20 or less in normal mammary gland tissue and greater than 40 in breast cancer, and they thought CT perfusion imaging may be useful for depicting the extent of breast cancer.
CT perfusion images and perfusion parameter analysis of breast cancer
Breast cancer is rich in blood vessels and is a malignant tumor composed of an abnormal proliferation of cells. Specific signs are the formation of a local mass, and vigorous growth of cancer cells. When the lesions grow larger, nutrients obtained in this way cannot meet the nutritional needs of tumor growth. In this case, some tumors release large amounts of angiogenic growth factors and induce the growth of a large number of vessels. The connections among new capillary endothelial cells are not closed, the basal lamina development is imperfect [21]. In this study, the BF, BV, MTT, PS values of breast cancer were higher than normal breast tissue, and the corresponding BF, BV, MTT and PS color maps of breast cancer showed an uneven color distribution, and were typically yellow-colored lesions, visually showing the most active portion in the tumor region and suggesting a high perfusion blood flow volume in the tumor tissue. In this study, the mean perfusion values of breast cancer (n = 30) were as follows: BF, 56.67±6.59 mL/100 g/min; BV, 5.82±0.68 mL/100 g; MTT, 6.01±0.82 s; and PS, 24.95±5.05 mL/100 g/min, differences between breast cancer and normal breast were all statistically significant for BF, BV, and PS (p < 0.05, respectively). BF and BV reflected microvascular density (MVD) of tumors, which was considered to reflect the angiogenic activity generated by tumor cells and supportive stroma [22]. PS was the unidirectional transfer rate of contrast agent from the endothelium of the capillaries into the intercellular space, which reflected wall permeability, integrity, and other characteristics of vascular endothelial cells within tumor tissue [22]. Miho et al. [23] investigated the feasibility of perfusion imaging using an arterial spin labeling (ASL) technique for breast cancer, which was appropriate for cerebral brain perfusion; however a limitation of their breast ASL perfusion study was some artifacts, and their study thought that tumor lesions that often show high perfusion rates can be detected in the normal breast tissues with low perfusion rates. Results from Boruah et al. [24] showed that all micro-vessel parameters had a positive correlation with breast tumor grades, the mean of the micro-vessel parameters were the least for the benign and the largest for the grade 3 tumors of breast cancer.
CT perfusion images and perfusion parameter analysis of breast fibroadenoman
Breast fibroadenoma is a benign fibroepithelial tumor composed of both stroma and epithelial elements of the breast, being characterized by an admixture of epithelial and stromal components that can be arranged into two growth patterns: pericanalicular, characterized by a circumferential stromal proliferation around ductal structures, and intracanalicular, where the proliferating stromal cells compress the ductal structures into clefts [25, 26]. Fibroadenoma is not generally considered as a risk factor for breast cancer [27]. The proliferation of a large number of fibrous tissue causes the slow emptying of contrast agents in the tumor. In this study, the MTT value of breast fibroadenoma was higher than breast cancer, while the BF, BV, PS values of breast fibroadenoma were lower than breast cancer, but these values were higher than normal breast tissue. The corresponding BF, BV, MTT and PS pcolor maps of breast fibroadenoma showed an uneven color distribution, and are typically blue-colored lesions. In this study, the mean perfusion values of breast fibroadenoman (n = 20) were as follows: BF, 46.24±6.65 mL/100 g/min; BV, 5.07±0.73 mL/100 g; MTT, 7.51±0.62 s; and PS, 16.73±6.48 mL/100 g/min. Differences between breast fibroadenoma and normal breast were all statistically significant for BF, MTT and PS (p < 0.05, respectively). As well, differences between breast fibroadenoma and breast cancer were all statistically significant for BF, BV, MTT and PS values (p < 0.05, respectively).
Our study also had several limitations. First, it was difficult for CT perfusion examination to detect early stage and small breast cancer, our study focused on the diameter range of breast tumor from 2.0–6.5 cm (mean 4.2 cm). Second, the Z axis range of CT perfusion examination on 64-slice spiral CT scanner was restricted (only 3 cm), so it couldn’t apply the whole breast imaging and 3D reconstruction. Third, although we optimized scan parameters and improved scan method so as to receive radiation dose as little as possible. In this study, radiation dose that LDCTPI generated was still 2.8 ~ 3.5 mSv (mean 3.1 mSv).
In conclusion, breast CT perfusion imaging is a noninvasive and convenient technology that could provide additional quantitative information for a breast tumor from a function or hemodynamics perspective, which cannot be provided by traditional morphological imaging [28]. The perfusion parameters values could aid in the diagnosis and prognostic assessments of breast tumor.
Footnotes
Acknowledgments
This study was supported in part by the grants from the science foundation of Wuxi medical management center (MS201643). We would like to acknowledge Professor Hu Chun-Hong for his technical help.