
Abstract
Development of spectral X-ray computer tomography (CT) equipped with photon counting detector has been recently attracting great research interest. This work aims to improve the quality of spectral X-ray CT image. Maximum a posteriori (MAP) expectation-maximization (EM) algorithm is applied for reconstructing image-based weighting spectral X-ray CT images. A spectral X-ray CT system based on the cadmium zinc telluride photon counting detector and a fat cylinder phantom were simulated. Comparing with the commonly used filtered back projection (FBP) method, the proposed method reduced noise in the final weighting images at 2, 4, 6 and 9 energy bins up to 85.2%, 87.5%, 86.7% and 85%, respectively. CNR improvement ranged from 6.53 to 7.77. Compared with the prior image constrained compressed sensing (PICCS) method, the proposed method could reduce noise in the final weighting images by 36.5%, 44.6%, 27.3% and 18% at 2, 4, 6 and 9 energy bins, respectively, and improve the contrast-to-noise ratio (CNR) by 1.17 to 1.81. The simulation study also showed that comparing with the FBP and PICCS algorithms, image-based weighting imaging using MAP-EM statistical algorithm yielded significant improvement of the CNR and reduced the noise of the final weighting image.
Keywords
Introduction
Conventional X-ray CT system equipped with X-ray detectors operated in a charge-integrating modality is insensitive to spectral information, because it weights each photon proportionally by its energy. Thus, this system assigns more weights to photons with higher energy. This weighting scheme leads to reduced image contrast, because the contrast between materials generally depends on low-energy photons [1, 2]. Energy-resolved photon counting detector, which is a new type of detector, has been recently developed. This detector consists of semiconductor detector integrated with rapid application-specific integrated circuits, and has high quantum efficiency in the X-ray energy range for medical diagnosis. This detector can also flexibly set the energy threshold to eliminate low-energy electronic noise caused by leakage current [3]. Moreover, multi-energy bins for photon counting can be acquired by a single exposure of the examined object. Image-based weighting imaging, which is a new imaging method, can be achieved by the availability of more than two spectral measurements. Image-based weighting imaging can decrease noise and increase contrast by constructing the optimal weight, which is proportional to the contrast-to-noise-variance ratio (CNVR) in the image from each energy bin [4].
Image-based weighting imaging method with photon-counting detectors has recently become a research focus as a modality to improve image quality [5–9]. Berglund et al. [5] simulated the breast phantom and used image-based weighting imaging method to obtain the final weighting image by the linear combination of each energy-bin image. The results showed that the CNR was significantly improved compared with the energy-integrating method. Furthermore, the influence of the various energy bins in the image-based weighting spectral X-ray CT image reconstruction was investigated with respect to the CNR. The results showed that the CNR increased as a function of the number of energy bins [2, 6–9]. These investigations generally employed an analytical algorithm, that is, FBP algorithm. However, for low-dose imaging and/or imaging with numerous energy bins, the number of photons in each energy bin will be significantly reduced, and the signal-to-noise ratio will decrease synchronously, resulting in significant degradation in the reconstructed image quality. In conventional low-dose CT imaging, iterative image reconstruction provides a superior signal-to-noise ratio (SNR) compared with the FBP technique [10]. Yu et al. proposed a prior image constrained compressed sensing (PICCS) iterative algorithm, which is performed using a constrained optimization scheme with adaptive iterative step sizes, the results showed that PICCS could suppress noise for the narrower energy-bin image [11]. However, the statistical properties of the projection data were not considered in PICCS algorithm, and they did not give the optimal weight to each energy-bin image to obtain the final weighting image. More recently, iterative methods based on maximum likelihood, and MAP-EM statistical algorithms have been developed for CT reconstruction problems arising primarily in the medical imaging domain, such methods have been proven to be more accurate than previously proposed iterative and FBP algorithm based approaches especially in low photon count (i.e., low SNR) situations [12, 13]. In this study, MAP-EM algorithm [14, 15] is proposed for reconstructing image-based weighting spectral X-ray CT images. The performance of this algorithm was investigated and compared with FBP and PICCS algorithms.
This paper first reviews the basic theories of MAP-EM and PICCS, as well as the implementation of the optimal image-based weighting imaging. Then, simulations of the image-based weighting imaging are presented, and the performances of FBP, MAP-EM, and PICCS algorithms are compared on the basis of noise level and CNR with various energy bins. The noise level and CNR in the final weighting image are also compared with those of the image reconstructed by traditional energy-integrating method.
Methods
Experimental dataset
In this study, simulations were performed using Geant4 Application for Tomographic Emission (GATE) [16]. This program is an advanced open-source software package, written in C++ language, and can simulate accurately the electromagnetic interaction of particles and matter, such as the photoelectric effect, Compton scattering, and Rayleigh scattering. In the simulations, a cylindrical phantom was built, and the cross-section of this phantom and related parameters are shown in Fig. 1 and Table 1. In the simulated phantom, the radius of each contrast material is set as 10 mm, thus the area of the internal max square is 14×14 mm2, which is selected as the size of the ROIs to reduce the statistic errors as large as possible. The ROIs of each material are marked with red box in Fig. 1, which are located at the center of each material. A single-slice fan beam was used to scan the phantom, and the fan angle was set to 8.6°. The distances from the source to the center of the phantom and detector were set to 670 and 1010 mm, respectively, in the simulated X-ray CT system. The equidistant linear detector was set to 152 mm and included 190 detector elements. The incident X-ray energy spectrum was simulated at 100 kVp with 0.8-mm thick beryllium and 10-mm thick aluminum filtration using TASMIC toolkit [17]. The filtration material was used to reduce the radiation damage caused by the low-energy X-ray. In the simulation, the rotation angle was set from 0 to 2π, and the angular sampling interval was set to 1° with 2×10⁶ incident X-ray photons with an energy spectrum produced by the above mentioned method. The energy spectrum was split into 2, 4, 6, or 9 bins, each energy bin had almost the same number of incident photons, and the low-energy threshold was set to 20 keV to reject the electronic noise. The energy thresholds for each energy bin are listed in Table 2. Poisson noise was added to the transmitted photons in each energy bin, image reconstructions and data analyses were repeated five times in this study [4].

Schematic cross-section of the cylindrical fat phantom with 100 mm diameter. The phantom had three holes filled with calcium (I), iodine (II), and soft tissue (III).
Geometric parameters and components of the cylindrical phantom in the cross-section, where w() denotes
Energy threshold at 2, 4, 6, and 9 energy bins for image-based weighting imaging
In the X-ray CT scanning system, the measurement data obtained by the detector have statistical properties. The Poisson statistical model in CT projection data can be expressed as follows [18]:
where i = 1, 2,…, N, j = 1, 2,…, M. N is the number of detector elements, M is the number of pixels in the reconstructed image,
MAP-EM algorithm based on the Poisson model attempts to find an image vector
Generally, the logarithm of Equation (3) is used to find vector
where
where the function U(
The form of the Gibbs distribution given by equations (5) and (6) is used in the MAP-EM procedure as derived by Green [20, 21]:
where x ( i ) is the estimate for a pixel in image space, is the acquired projection data. β is the term of penalty function, when β goes to zero, the algorithm tends toward the maximum likelihood expectation-maximization (ML-EM) algorithm. The parameter β controls the strength of the prior relative to the strength of the data in our image estimate. A higher β leads to a final estimate which places more emphasis on the prior and less on the data.
PICCS reconstruction framework was initially formulated from compressed sensing (CS). CS prescribes that the signal can be recovered from a few measurements by the sparse nature of the signals in a transform domain. The reconstruction of an image with sparsity can be described as follows [22, 23]:
where
The reconstruction of an image using the constrained method can be expressed as follows [22, 23]:
where
where
The image-based weighting imaging method first reconstructs separate images from each energy bin. The final image is a linear combination of the energy-bin images with the weights chosen to maximize the CNR in the final image, as follows [4]:
where x ( k ) is the kth energy-bin image, w ( k ) is the weight of the kth energy-bin image, and K is the total number of energy bins.
The CNR of the final image can be expressed as follows [4]:
where σ2 k is the noise variance of the kth energy-bin image. C k is the contrast in the kth energy-bin image, which is defined as the absolute difference of the average attenuation coefficient between the contrast element and background material in the kth energy-bin image.
Schmidt [4] proved that the weighting factor proportionally to the CNVR of the reconstructed image of each energy bin can maximize the CNR of the combined image. The optimal weight w (
n
) of the nth energy-bin image to maximize the CNR can be expressed as follows [4]:
The numerator and denominator in Equation (14) stand for the CNVR of the reconstructed image of each energy bin and the sum of the CNVR of the reconstructed images of K energy bins, respectively.
Each energy-bin image was reconstructed by FBP, PICCS, and MAP-EM algorithms. All images were generated on a 190×190 pixel matrix, and the contrast element iodine was used to calculate the optimal weights of each energy bin. In PICCS reconstructions, the prior image was generated by a linear optimal combination of FBP-reconstructed images from each energy bin. The regularization parameter β was set to 5, and the size of neighborhood N ( j ) was set to 3×3 in the MAP-EM reconstructions. In PICCS method, the objective function was optimized by the separable paraboloidal surrogate algorithm, and the prior image parameter α was set to 0.5.
Noise level (σ) and CNR, which were analyzed to evaluate image quality, were calculated for the reconstructed images according to Equations (15) and (16), as follows:
where m is the number of pixels in a region of interest (ROI) of the reconstructed image for background material, x
g
and
Reconstructed images acquired with FBP, PICCS, and MAP-EM algorithms
Figure 2(a) shows the energy-integrated (i.e., the number of energy bins is 1) image reconstructed by the FBP algorithm. Figure 2(b)-(e) show the FBP reconstructed images of the phantom acquired with image-based weighting scheme optimized for iodine at 2, 4, 6 and 9 energy bins, respectively. Figure 2 shows the presence of significant visual noises in the reconstructed images, but the noises in the final weighting images are less than that in the energy-integrated image. Figure 3(a) shows the energy-integrated image reconstructed by MAP-EM algorithm, Fig. 3(b)-(e) show the MAP-EM reconstructed images of the phantom acquired with image-based weighting scheme optimized for iodine at 2, 4, 6 and 9 energy bins, respectively. Figure 4(a) shows the energy-integrated image reconstructed by PICCS algorithm. Figure 4(b)-(e) show the PICCS reconstructed images of the phantom acquired with image-based weighting scheme optimized for iodine at 2, 4, 6 and 9 energy bins, respectively.
FBP-reconstructed images of the phantom acquired with (a) energy-integrating and image-based weighting scheme optimized for iodine at (b) 2, (c) 4, (d) 6, and (e) 9 energy bins. MAP-EM-reconstructed images of the phantom acquired with (a) energy-integrating and image-based weighting scheme optimized for iodine at (b) 2, (c) 4, (d) 6, and (e) 9 energy bins. PICCS-reconstructed images of the phantom acquired with (a) energy-integrating and image-based weighting scheme optimized for iodine at (b) 2, (c) 4, (d) 6, and (e) 9 energy bins.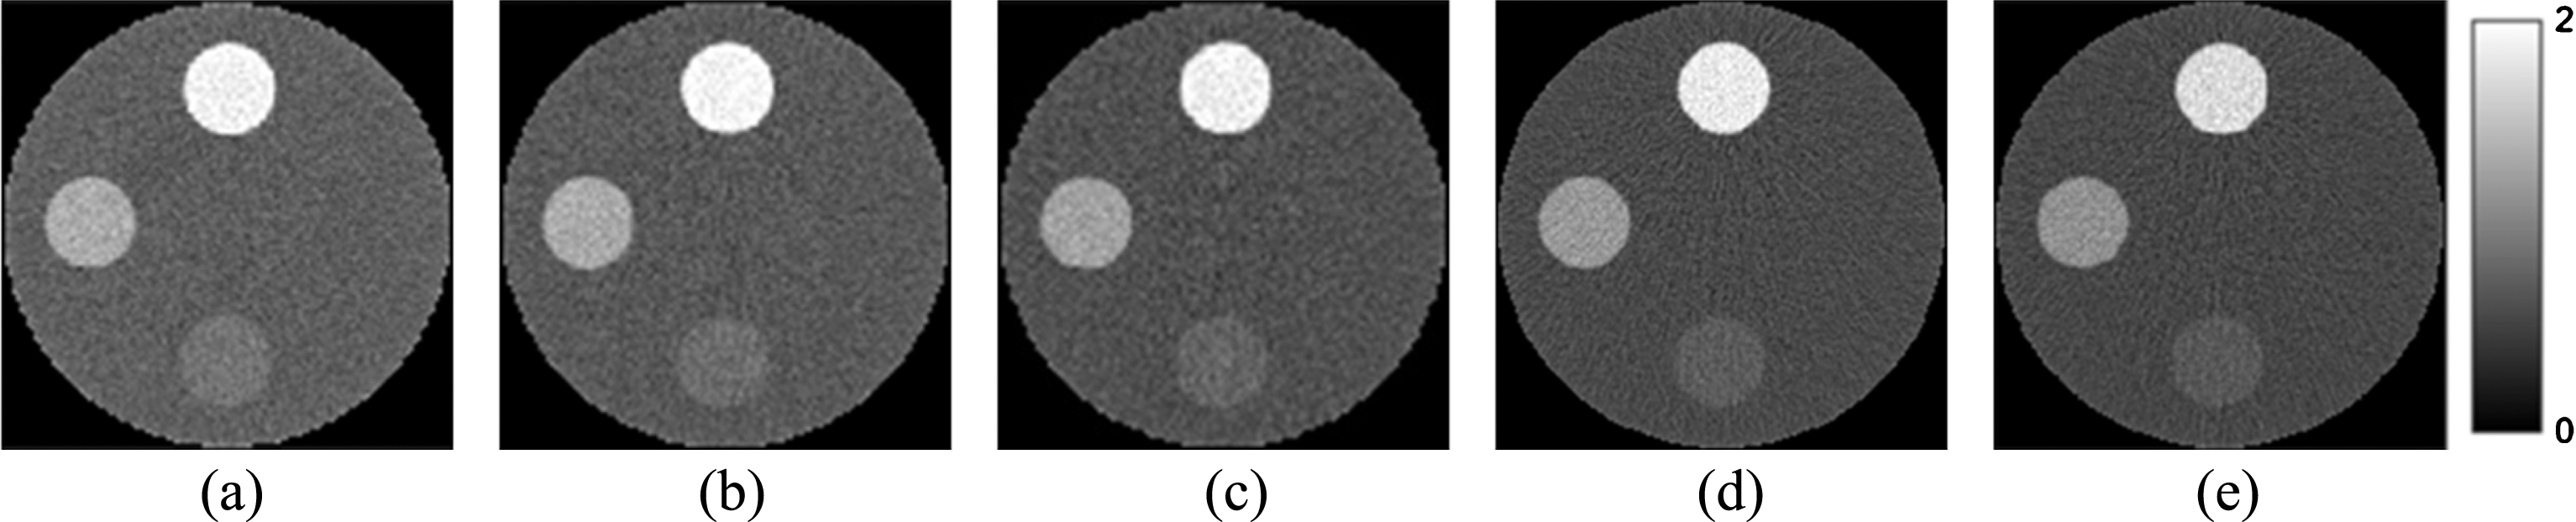

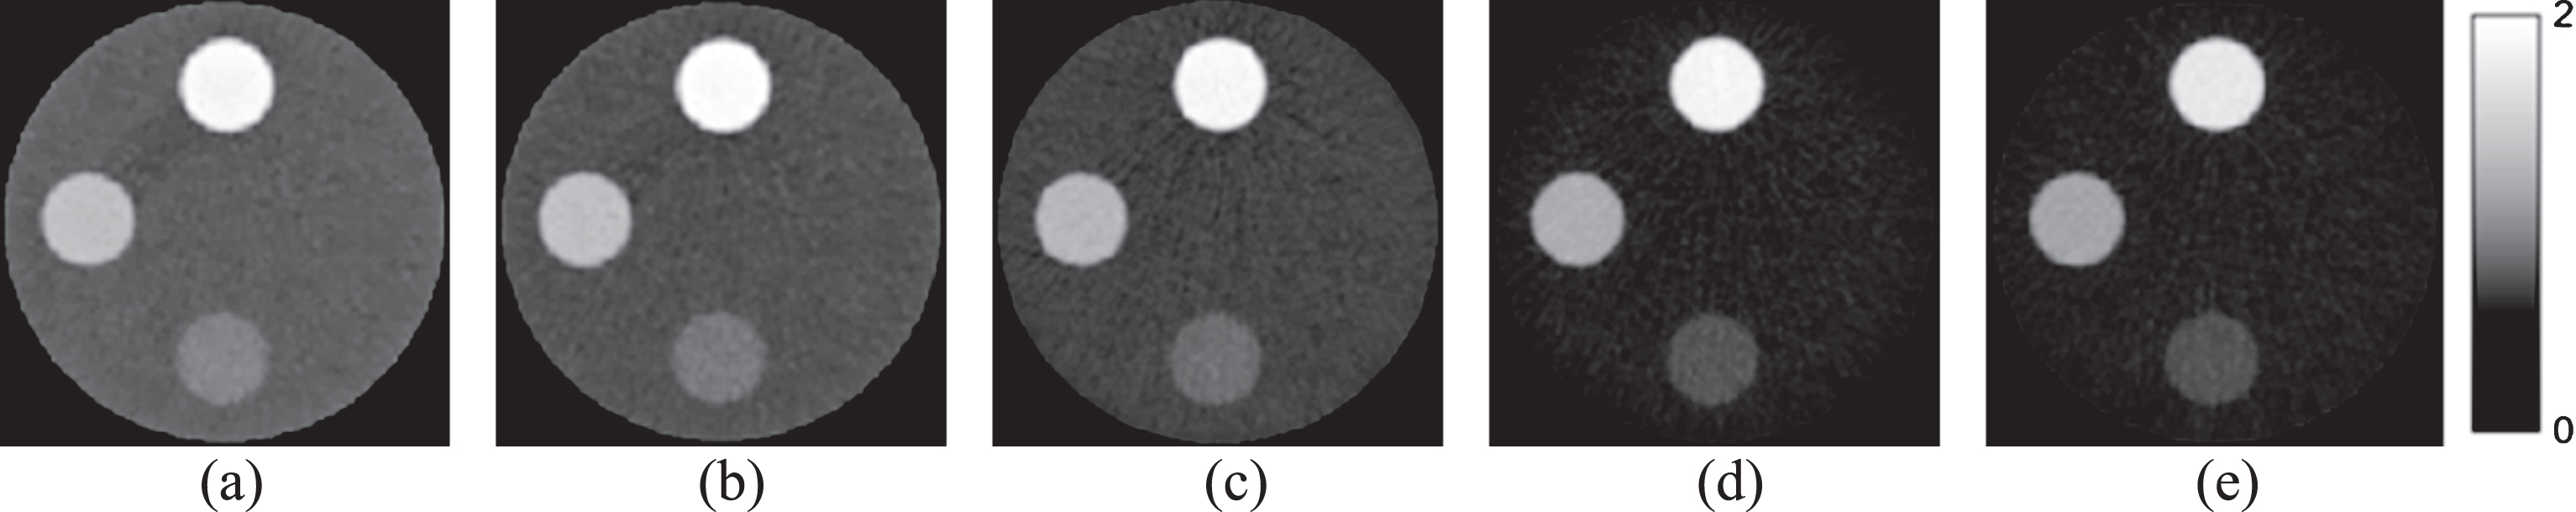
Figures 2–4 show that the MAP-EM and PICCS algorithms perform better than the FBP algorithm. The quality of the final weighting images reconstructed by the two former algorithms is better than that by FBP algorithm.
The noise levels and/or noise reduction values in the energy-integrated and final weighting images reconstructed by PICCS and MAP-EM algorithms at 2, 4, 6 and 9 energy bins were compared with the FBP algorithm listed in Table 3 to facilitate the quantitative evaluation of the images. Compared with FBP, MAP-EM algorithm can offer the noise reduction in the final weighting images at 2, 4, 6 and 9 energy bins up to 85.2%, 87.5%, 86.7% and 85%, respectively. Compared with PICCS method, MAP-EM algorithm can reduce noise by 36.5%, 44.6%, 27.3% and 18% in the final weighting images at 2, 4, 6 and 9 energy bins, respectively. Compared with energy-integrating method, noises in the final weighting images reconstructed by MAP-EM algorithm are decreased by 10.4%, 30.6%, 34.3% and 18.7% at 2, 4, 6 and 9 energy bins, respectively.
Noise levels and noise reductions values in the energy-integrated and final weighting images reconstructed by FBP, PICCS, and MAP-EM algorithms at 2, 4, 6, and 9 energy bins
Noise levels and noise reductions values in the energy-integrated and final weighting images reconstructed by FBP, PICCS, and MAP-EM algorithms at 2, 4, 6, and 9 energy bins
Δσ(1) denotes the noise reduction of MAP-EM with respect to FBP, while Δσ(2) denotes the noise reduction of MAP-EM with respect to PICCS.
Figure 5 shows the noise level as a function of the number of energy bins in the image-based weighting images reconstructed by FBP, PICCS, and MAP-EM algorithms. The noise level decreased when the number of energy bins is increased from 2 to 6, and increased above 6 energy bins. Moreover, the noise levels in the final images reconstructed by MAP-EM algorithm are lower than those by the FBP and PICCS algorithms.

Noise level as a function of the number of energy bins in the imaged-based weighting images reconstructed by FBP, PICCS, and MAP-EM algorithms.
The CNR and its improvement among the contrast elements (calcium, iodine, and soft tissue) and the fat in the final images reconstructed by FBP, PICCS and MAP-EM algorithms for various energy bins are listed in the Table 4. Compared with the FBP method, MAP-EM algorithm can offer CNR improvement ranging from 6.53 to 7.77 at all numbers of energy bins tested. Compared with PICCS method, the MAP-EM algorithm can improve the CNR by factors ranging from 1.17 to 1.81 in the final weighting image at all numbers of energy bins tested. Compared with the energy-integrating method, MAP-EM algorithm can offer CNR improvement ranging from 1.13 to 1.58 at all numbers of energy bins tested. Figure 6 shows the CNR as a function of the number of energy bins in the image-based weighting images reconstructed by FBP, PICCS and MAP-EM algorithms. For the FBP, PICCS and MAP-EM algorithms, the CNR between the contrast elements and fat material increases as a function of the number of energy bins and decreases above the specific number of energy bins. The CNRs are the highest in the images acquired from 6 energy bins.

Contrast-to-noise ratio between the contrast elements (calcium, iodine, and soft tissue) and fat as a function of the number of energy bins in the image-based weighting images reconstructed by FBP, PICCS, and MAP-EM algorithms.
Contrast-noise-ratio (CNR) and CNR improvements in the energy-integrated and final weighting images reconstructed by FBP, PICCS, and MAP-EM algorithms at 2, 4, 6 and 9 energy bins
O/F represents the ratio of CNR in the image reconstructed by the MAP-EM and FBP algorithms, and O/P represents the ratio of CNR in the image reconstructed by MAP-EM and PICCS algorithms.
Image-based weighting imaging based on photon counting detector can be employed to improve the image quality for spectral X-ray CT, with FBP as the generally employed reconstruction algorithm [2, 6–9]. However, the image quality may suffer from the insufficient number of photons in each energy bin. In this study, separate images from each energy bin were reconstructed by MAP-EM algorithm, which was designed to improve image quality. Then, the images from all energy bins were linearly summarized with optimal weights as the final weighting image. Finally, the noise level and CNR in the final weighting image were evaluated and compared.
The image-based weighting scheme can significantly reduce the noise level and improve the CNR compared with the energy-integrating method. The results are in good agreement with a previous published study on image-based weighting where the optimal weights were calculated by the contrast element iodine [4]. This phenomenon is due to the fact that the noise in the reconstructed image is considered in the image-based weighting scheme, and the weighting factor is proportional to the CNVR in the reconstructed image at each energy bin. These characteristics result in lower noise level and higher CNR than those of the energy-integrating method. For FBP, PICCS and MAP-EM algorithms, the noise level decreases as a function of the number of energy bins and increases above the specific number of energy bins (Fig. 5). The CNR increases as a function of the number of energy bins and decreases above the specific number of energy bins (Fig. 6). In this study, the optimal number of energy bins was 6. Compared with the FBP algorithm, PICCS and MAP-EM algorithms can reduce noise and improve the CNR in the final weighting images. In this work, we further gave the optimal weights to all energy-bin images, and the final image was a linear combination of the all energy-bin images. Compare with PICCS algorithm, the performance of MAP-EM method is better than that of PICCS algorithm for image-based weighting imaging. This is due to the statistical properties of the projection data are considered in the MAP-EM algorithm, imposing prior information of the contrast image on the image reconstruction to suppress noise.
Although image-based weighting imaging for spectral X-ray CT using MAP-EM statistical algorithm could significantly improve the CNR and reduce the noise in the final weighting image, there are still some limitations in this study. First, the inherent drawbacks of photon counting detector, such as imperfect energy resolution, detection efficiency, and limited count rates, can degrade the final image quality, which should be addressed by modeling and evaluating on an experimental spectral x-ray CT system in future work. Second, to verify the advantages of the proposed method, for future work, more complex phantoms should be developed and evaluated with more realistic experimental conditions. Third, the number of energy bins was set to 2–9 in this study, which is similar to the most published studies [3, 26]. Since the image quality is also dependent on the number of energy bins, both the sufficient number of energy bins and the width of each energy bin should be investigated in future work. Fourth, the MAP-EM reconstruction techniques can degrade the performance of spatial resolution in reconstructed images, and the characteristics of spatial resolution is quite important in spectral X-ray CT imaging. Future work should address the potential tradeoff between CNR and spatial resolution of the reconstructed images.
Conclusion
In this study, MAP-EM algorithm is applied and evaluated for reconstructing spectral X-ray image. The images from each energy bin are first reconstructed and linearly summarized with optimal weights as the final weighting image. The simulation results show that MAP-EM algorithm can show significant improvement of the CNR and reduce noise of the final weighting images compared with the PICCS and FBP algorithms; and as the number of energy bins increases, the noise level decreases, but it turns to increase as the number of energy bins reaches to a specific number. Therefore, the highest CNR can be achieved only at an optimal number of energy bins.
In conclusion, image-based weighting imaging for spectral X-ray CT using MAP-EM statistical algorithm can significantly improve image quality, which is dependent on the number of energy bins. Therefore, the choice of a suitable number of energy bins is also important to achieve high image quality.
Conflict of interest disclosure
The authors have no relevant conflicts of interest to report.
Footnotes
Acknowledgments
This work was supported by the National Natural Science Foundation of China (No. 51575256), the Key research and development plan (Social Development) of Jiangsu Province (No. BE2017730), the Key industrial research and development project of Chongqing (No. cstc2017zdcy-zdzx0044), and the Priority Academic Program Development of Jiangsu Higher Education Institutions (PAPD).