
Abstract
BACKGROUND:
Improved visualization of lung cancer-associated vessels is vital.
OBJECTIVE:
To evaluate the efficacy of 3-D quantitative CT in lung cancer-associated pulmonary vessel assessment.
METHODS:
Vascular CT changes were assessed visually and using FACT-Digital lung TM software (n = 162 patients, 178 controls). The total number of pulmonary vessels (TNV) and mean lumen area of pulmonary vessels (MAV) vertical to cross-sections of fifth/sixth-generation bronchioles were measured.
RESULTS:
Visual investigation revealed fewer ipsilateral pulmonary vascular abnormalities in lung cancer (151/162) than did quantitative CT (162/162), and required more time (3.2±1.5 vs. 2.5±1.3 min) (P < 0.05). CT measurements revealed that the TNV vertical to the fifth-generation bronchial cross-section of the ipsilateral, contralateral, and control groups was 14.58±4.75, 9.58±3.74, and 10.22±4.07 and the MAV in these groups was 99.70±26.20, 58.76±29.29, and 57.76±18.32, respectively. The TNV vertical to the sixth-generation bronchial cross-section of the ipsilateral, contralateral, and control groups was 16.64±5.14, 11.59±4.06, and 11.75±4.16 and the MAV was 110.22±31.47, 67.62±30.41, and 60.24±16.18, respectively. The TNV and MAV in ipsilateral lung cancer tissues exceeded those in the contralateral side and control group tissues (P < 0.001).
CONCLUSIONS:
Automated 3-D quantitative CT could successfully characterize pulmonary vessels and their lung cancer-associated changes.
Introduction
In 2015, the number of new cases of malignant tumors in China was 4.292 million, of which 17.1% were lung cancer (733,000). The annual mortality rate attributed to these cases was approximately 602,000 in 2015 [1]. Although new targeted drugs have been created for the treatment of these cancers, the prognosis of patients with advanced and metastatic lung cancer remains poor due to the emergence of drug resistance [2]. Therefore, as a disease associated with high morbidity and mortality rates, the early diagnosis and treatment of lung cancer has become an important means by which to improve the five-year survival rates of these patients [3].
Lung cancer grows rapidly and relies on neovascularization to obtain sufficient oxygen and nutrients. Studies have [4] reported that lung cancer preferentially grows towards blood vessels. CT images often depict multiple and abundant blood vessels in the cancerous lesions [5–8]. Due to the application of high-resolution multi-slice spiral CT technology, pulmonary vascular structure can be clearly revealed. In the past, vascular morphology changes have been assessed via visual CT inspection. However, this method is often greatly influenced by the experience of the readers. Some studies [2] have reported that agreement between visual assessments and pathology findings occurs 50–70% of the time, and that consistency between readers is difficult to guarantee. At the same time, because multi-slice spiral CT produces a large number of images (as many as 500–600 images per patient), the technique is cumbersome and difficult to rapidly perform in clinical conditions. This process can be lengthy, especially when conducted by inexperienced doctors. Some studies [9] have pointed that visual investigation is significantly more time-consuming than computer detection.
Although a role for pulmonary small vessel morphology studies in the qualitative diagnosis of lung cancer has been proposed previously, quantitative studies of three-dimensional morphological markers are rare. Therefore, an in-depth assessment of lung small blood vessels in lung cancer patients is urgently required to better the evaluation options for this deadly disease. New perspectives and more objective, effective, and convenient detection methods are thus required.
Recent studies have found that the use of cross-sectional area (CSA) in lung CT images can allow for the quantitative assessment of vessels and determination of changes in small vessel morphology [10, 11]. However, the results of this method are susceptible to different thresholding parameters. Thus, in the present study, we identified and quantified pulmonary small vessels near lung tumor zones with a fully automated 3-D quantitative CT method based on the segmentation of bronchial and vascular trees, as vascular changes are more prominent in small vessels and intrapulmonary arteries are closely related to bronchi and form bronchovascular bundles.
Materials and methods
Patients
From May 2011 to October 2016, chest CT scans from 162 study subjects were continuously collected. CT examination was conducted in the PET/CT room of the First Affiliated Hospital of Xi’an Jiaotong University. Patients’ inclusion criteria were as follows: An age of 40 to 80 years, suspected lung cancer, available full-volume chest CT scan, no chest surgery history, and no history of malignant tumors. Exclusion criteria were: a history of surgery, radiotherapy, or chemotherapy and poor bronchial or vascular results on quantitative CT analysis. During the same period, 178 healthy subjects were recruited and scanned for the control group. Control group inclusion criteria were: an age of 40 to 80 years, being in good health, available full volume chest CT scan, no history of lung disease. The exclusion criterion was poor bronchial or vascular results on quantitative CT analysis. The participant selection pipeline is depicted in a flow diagram (Fig. 1).
The present study was approved by the Institutional Ethics Committee of the First Affiliated Hospital of Xi’an Jiaotong University. Written informed consent was obtained from all subjects. This study was performed with approval from the Chinese Clinical Trials Registry Center (http://www.chictr.org/en/) (Registration No: ChiCTR-OCH-14004935).
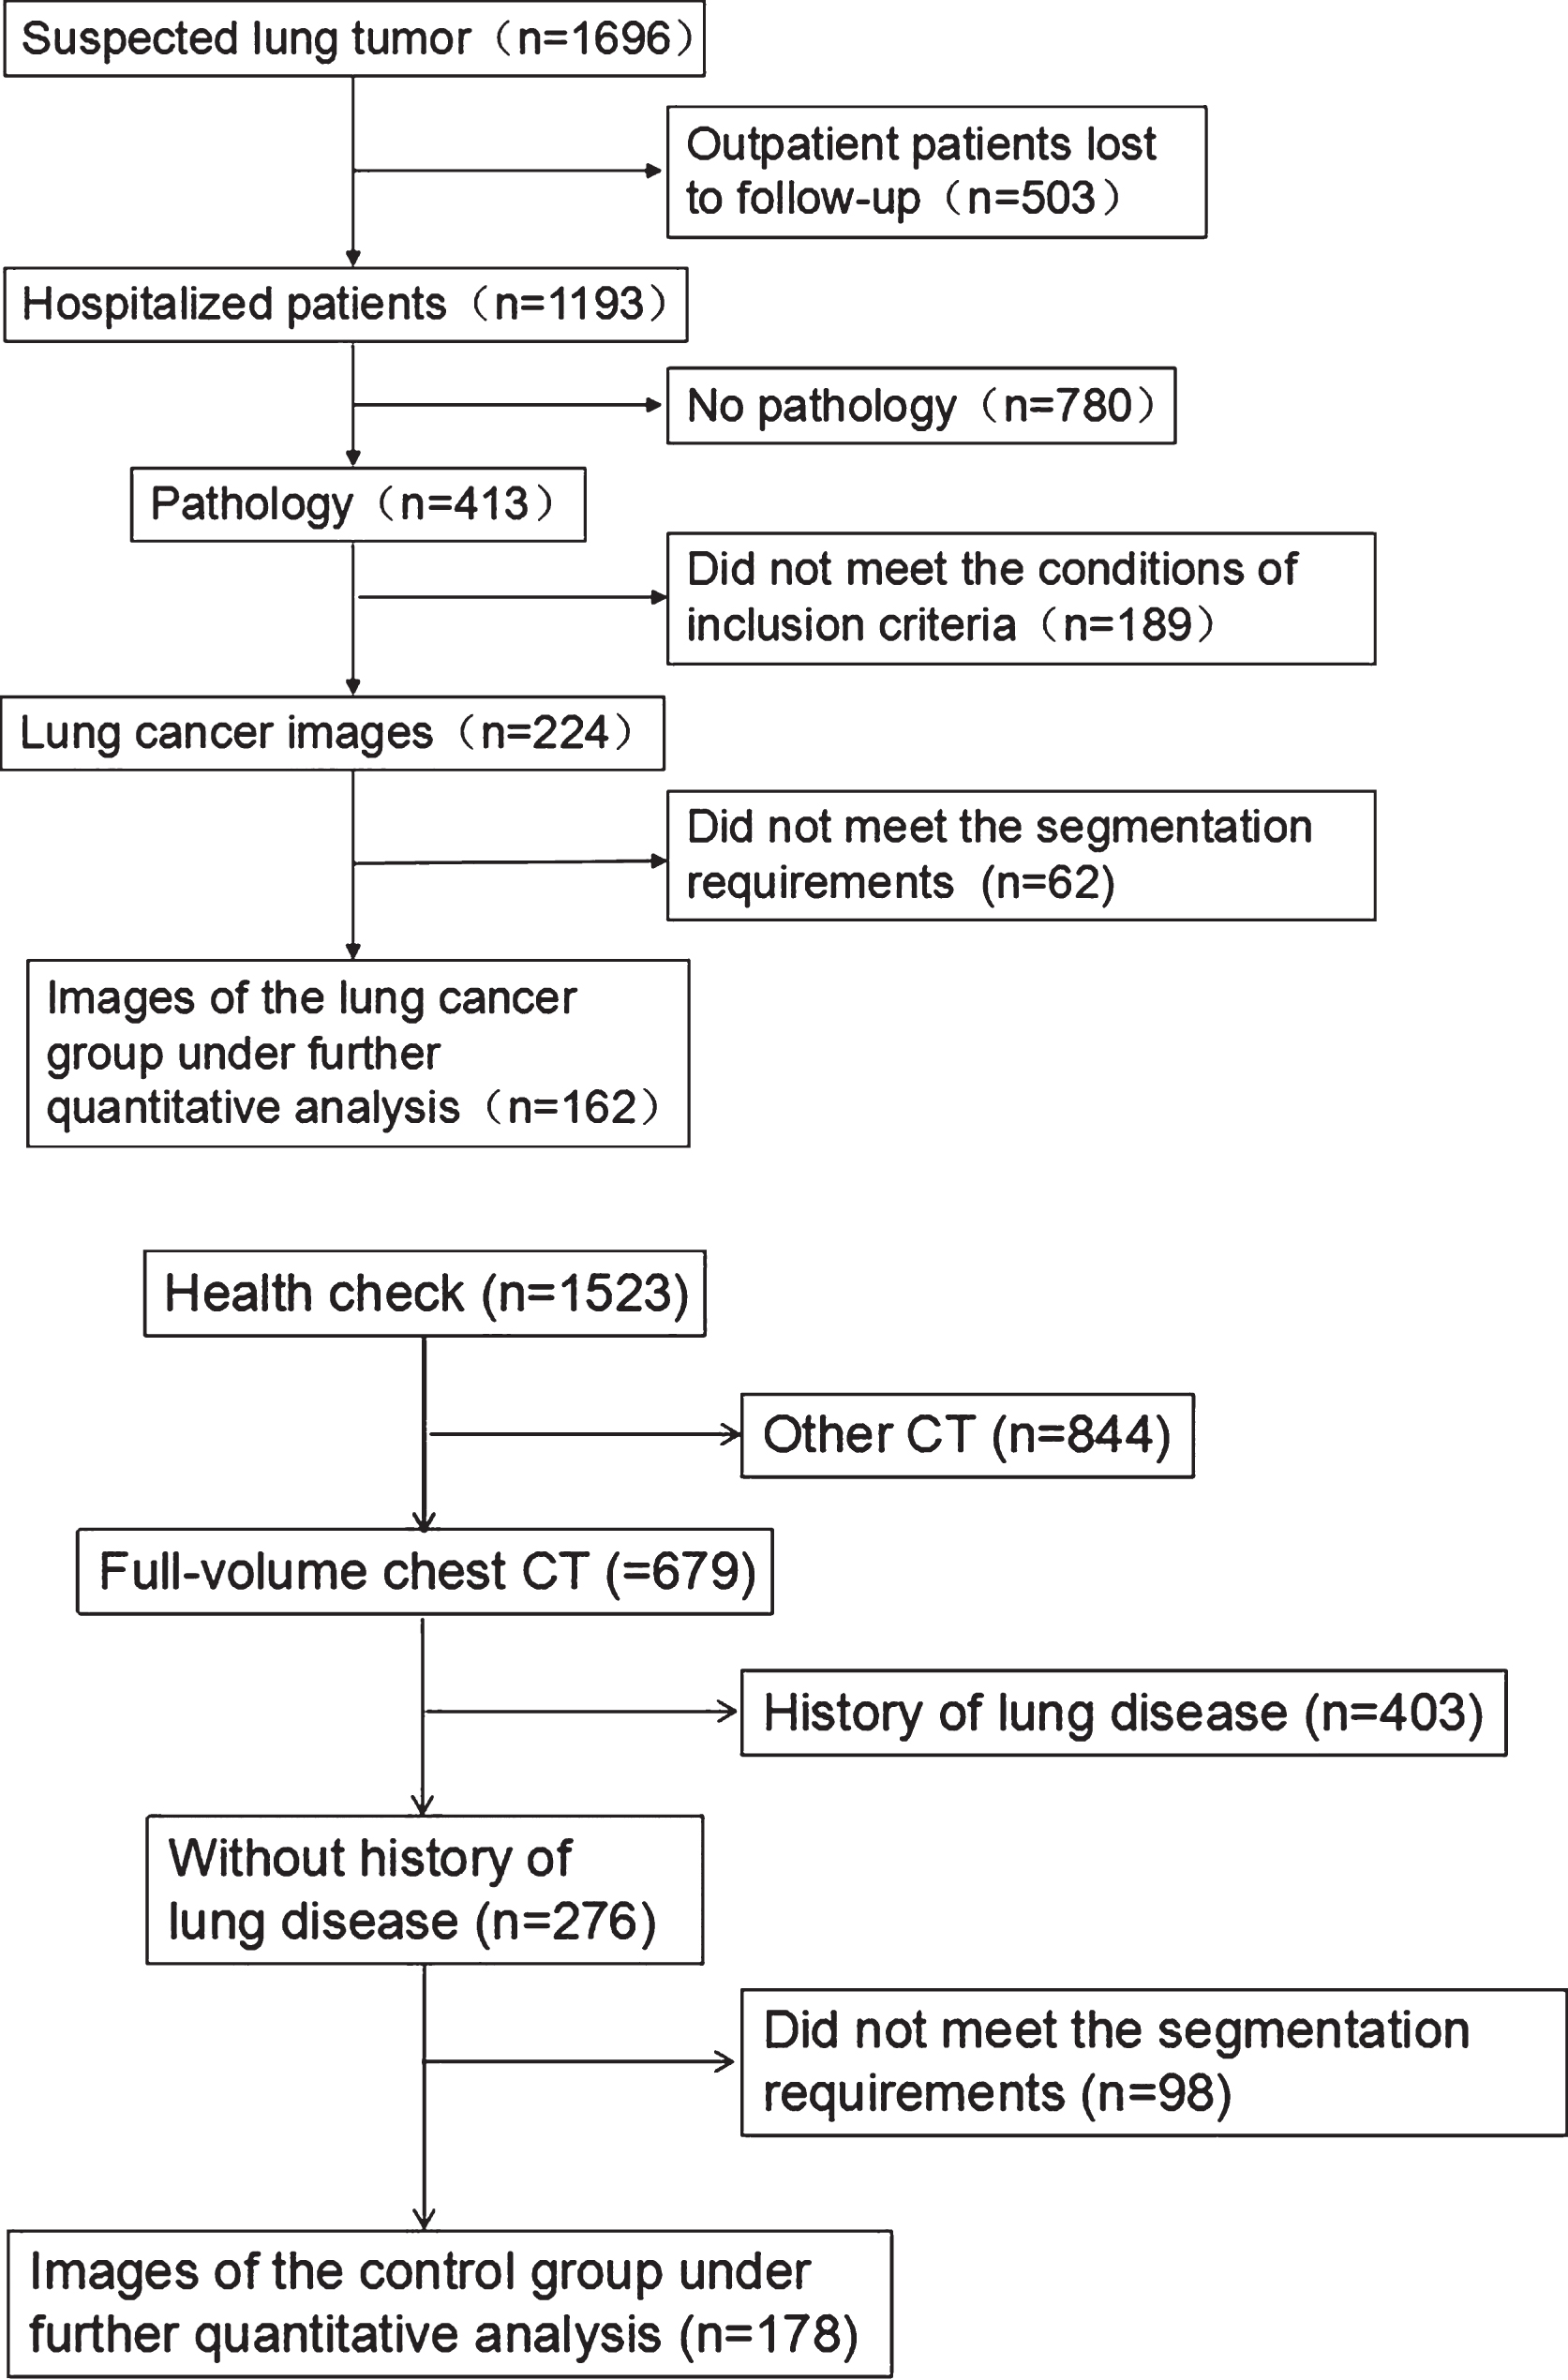
Study population selection pipeline.
A Philips 64 row CT (Philips Gemini TF 64 PET/CT; Philips Healthcare, Best, the Netherlands) was used for all scans. The subjects were placed in a supine position and scanned at the end of a deep inspiration. The scanning field included the entire bilateral lung area. Scan parameters included: a full-volume CT scan, no use of a contrast agent, 120 KV tube voltage, 200 mA tube current, rotation time of 0.5 s, detector collimation of 0.6 mm, thickness of 0.625 mm, and an interval of 0.625 mm. Original data were reconstructed according to a standard algorithm.
Visual analysis and quality control
Quality control in the present study involved the determination and auditing of CT images and their quantitative segmentation, performed by two radiologists (Li and Dai). Pulmonary vessels were detected by examining 500–700 CT slices. If differences were detected, a final decision was made based on a consensus. They discuss their differences, and then reach the final agreement. The two radiologists, who were experts on thoracic imaging, independently applied a visual analysis method to reading the HRCT images and determining whether vascular abnormalities were present by comparing the tumorous side to the healthy, contralateral side (Fig. 2). Visual evaluation was used to determine the following: 1) whether the diameter of blood vessel in the cancerous lung were wider than in the accompanying bronchus; 2) whether blood vessels tapered as they moved away from the hilum; 3) whether the blood vessels in the diseased lung were wider than those in the healthy, contralateral side; and 4) whether there were more blood vessels in the diseased lung than in the healthy, contralateral side. Time spent on this visual method was recorded and averaged. In addition to visually assessing the presence or absence of pulmonary vascular abnormalities, each of them determined whether the results of further quantitative analysis were viable. When bronchial or pulmonary vessel segmentation, interruption, discontinuity, or other abnormalities were found, the image was excluded from further analyses.

The tumor is located in the left lower lobe and is visually evaluated. It is difficult to determine whether there are abnormalities in TNV and MAV in the tumorous side (red box) or in the contralateral side (green box).
FACT-Digital lung TM software (DeXin, Xi’an, China) were used for fully automated segmentation and quantitative measurement of the pulmonary small vessels. A schematic flowchart of this process is depicted in Fig. 3. The specific steps of this 3-D automated approach were as follows: 1) Build a structural model using the moving cube algorithm (MCA) to extract the limbing cubes algorithm and display it in three dimensions, 2) construct the main curvature by calculating the degree and direction of the curve’s bend at each point using calculus, 3) filtration of non-bronchial elements (e.g. spherical structure nodules, strip-shaped fibrous structures, column-like bronchial tubes and blood vessels, and other structures) via identification of the main curvature of the lung tissue structure to retain only column-like structures, 4) correction of bronchial tissue due to error, and 5) automatic display of the results.
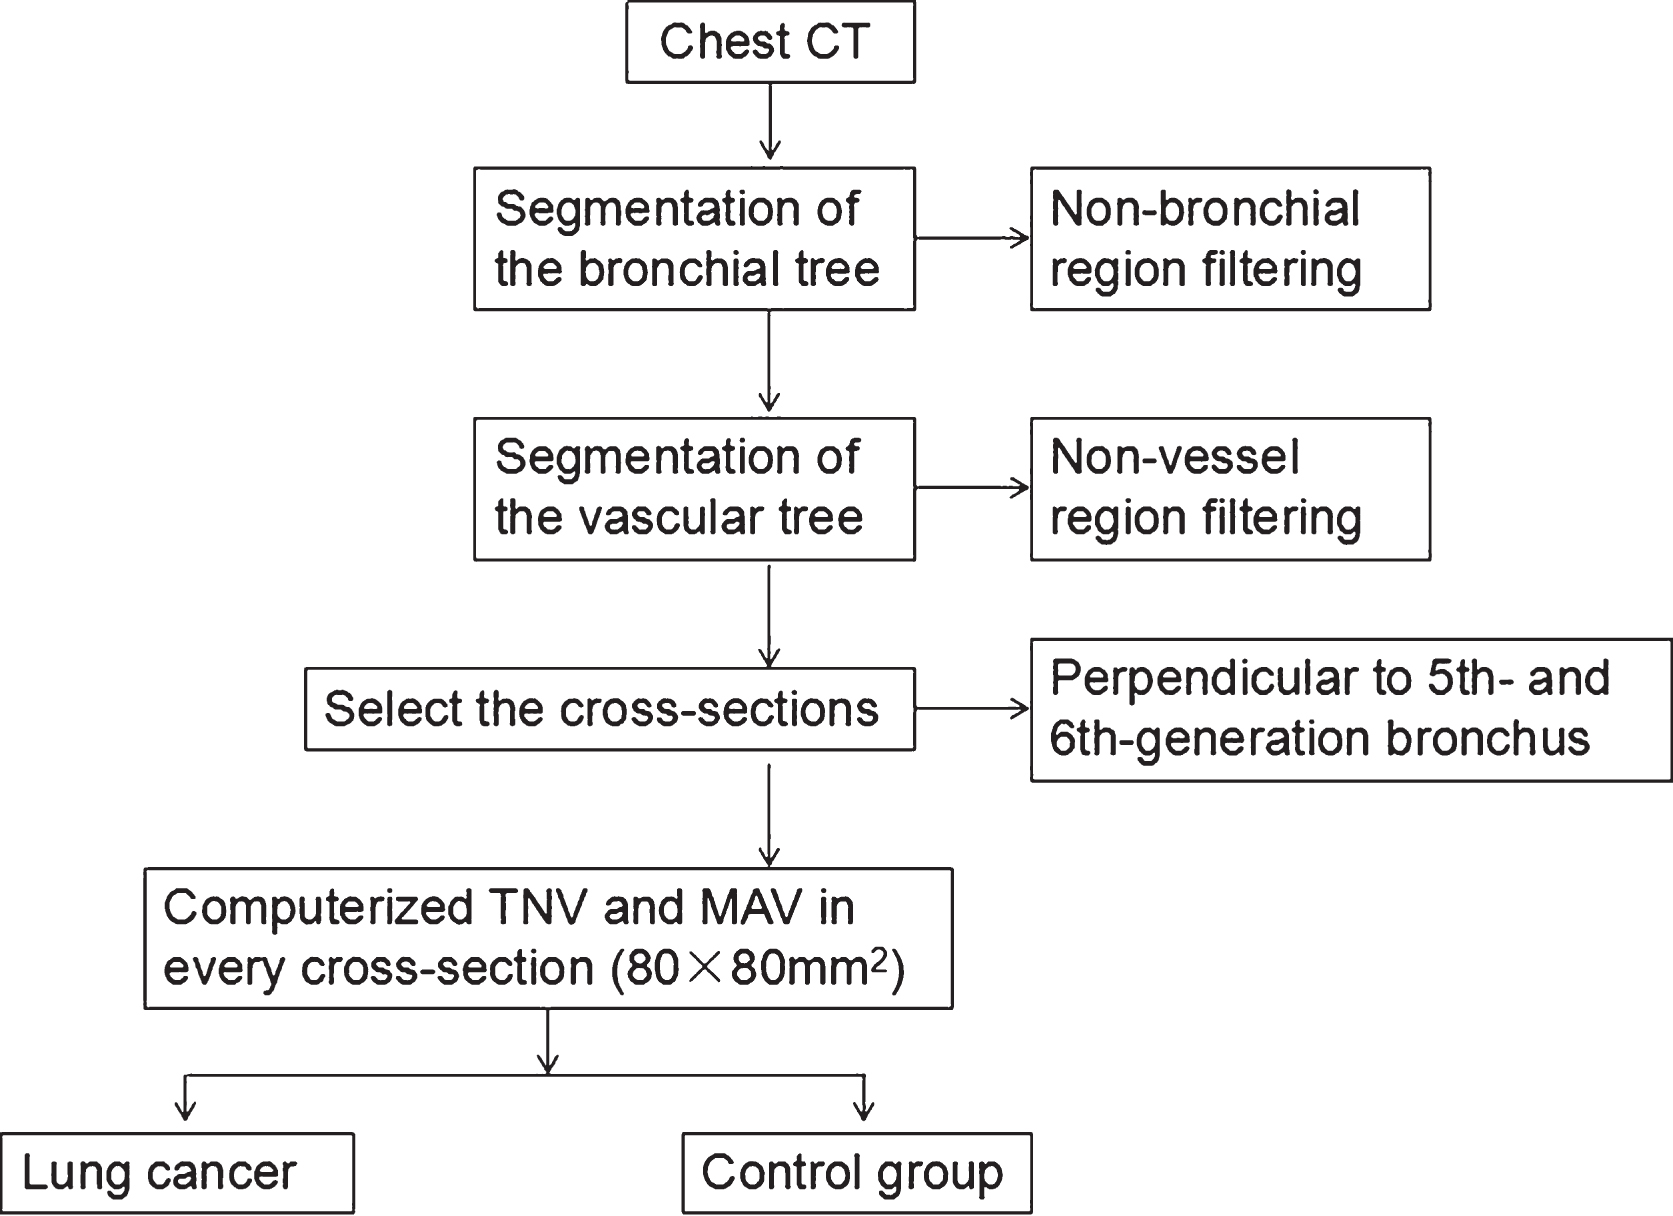
Schematic flowchart of vascular segmentation and measurement procedures.
Based on bronchial tree and vascular tree segmentation algorithms, pulmonary vascular measurements were obtained using the following specific steps (depicted in Fig. 4): 1) 3-D automatic segmentation of the bronchial tree, performed by using a tubular tree segmentation algorithm to extract the centerline and automatically identify branch points in the bronchial tree to mark the bronchus, 2) automatic segmentation of the blood vessel tree, 3) selection of the visual range area at the marked bronchus and depiction of it, 4) automatic display of the pulmonary vessels perpendicular to the cross-sectional area using pseudo-color, and 5) measurement of the TNV and MAV normal to the cross-section (the mean values of pulmonary vascular measurements at the beginning and end of the bronchus). A detailed description of this method and the above steps has been reported elsewhere [12–15]. The trachea was defined as 0 generation, left and right main bronchi were defined as 1 generation, each fork led to an increase of 1 generation, and so on. In this study, the cross-sectional area of the field of view (FOV) was 80×80 mm. Measurement indicators were the TNV and MAV.
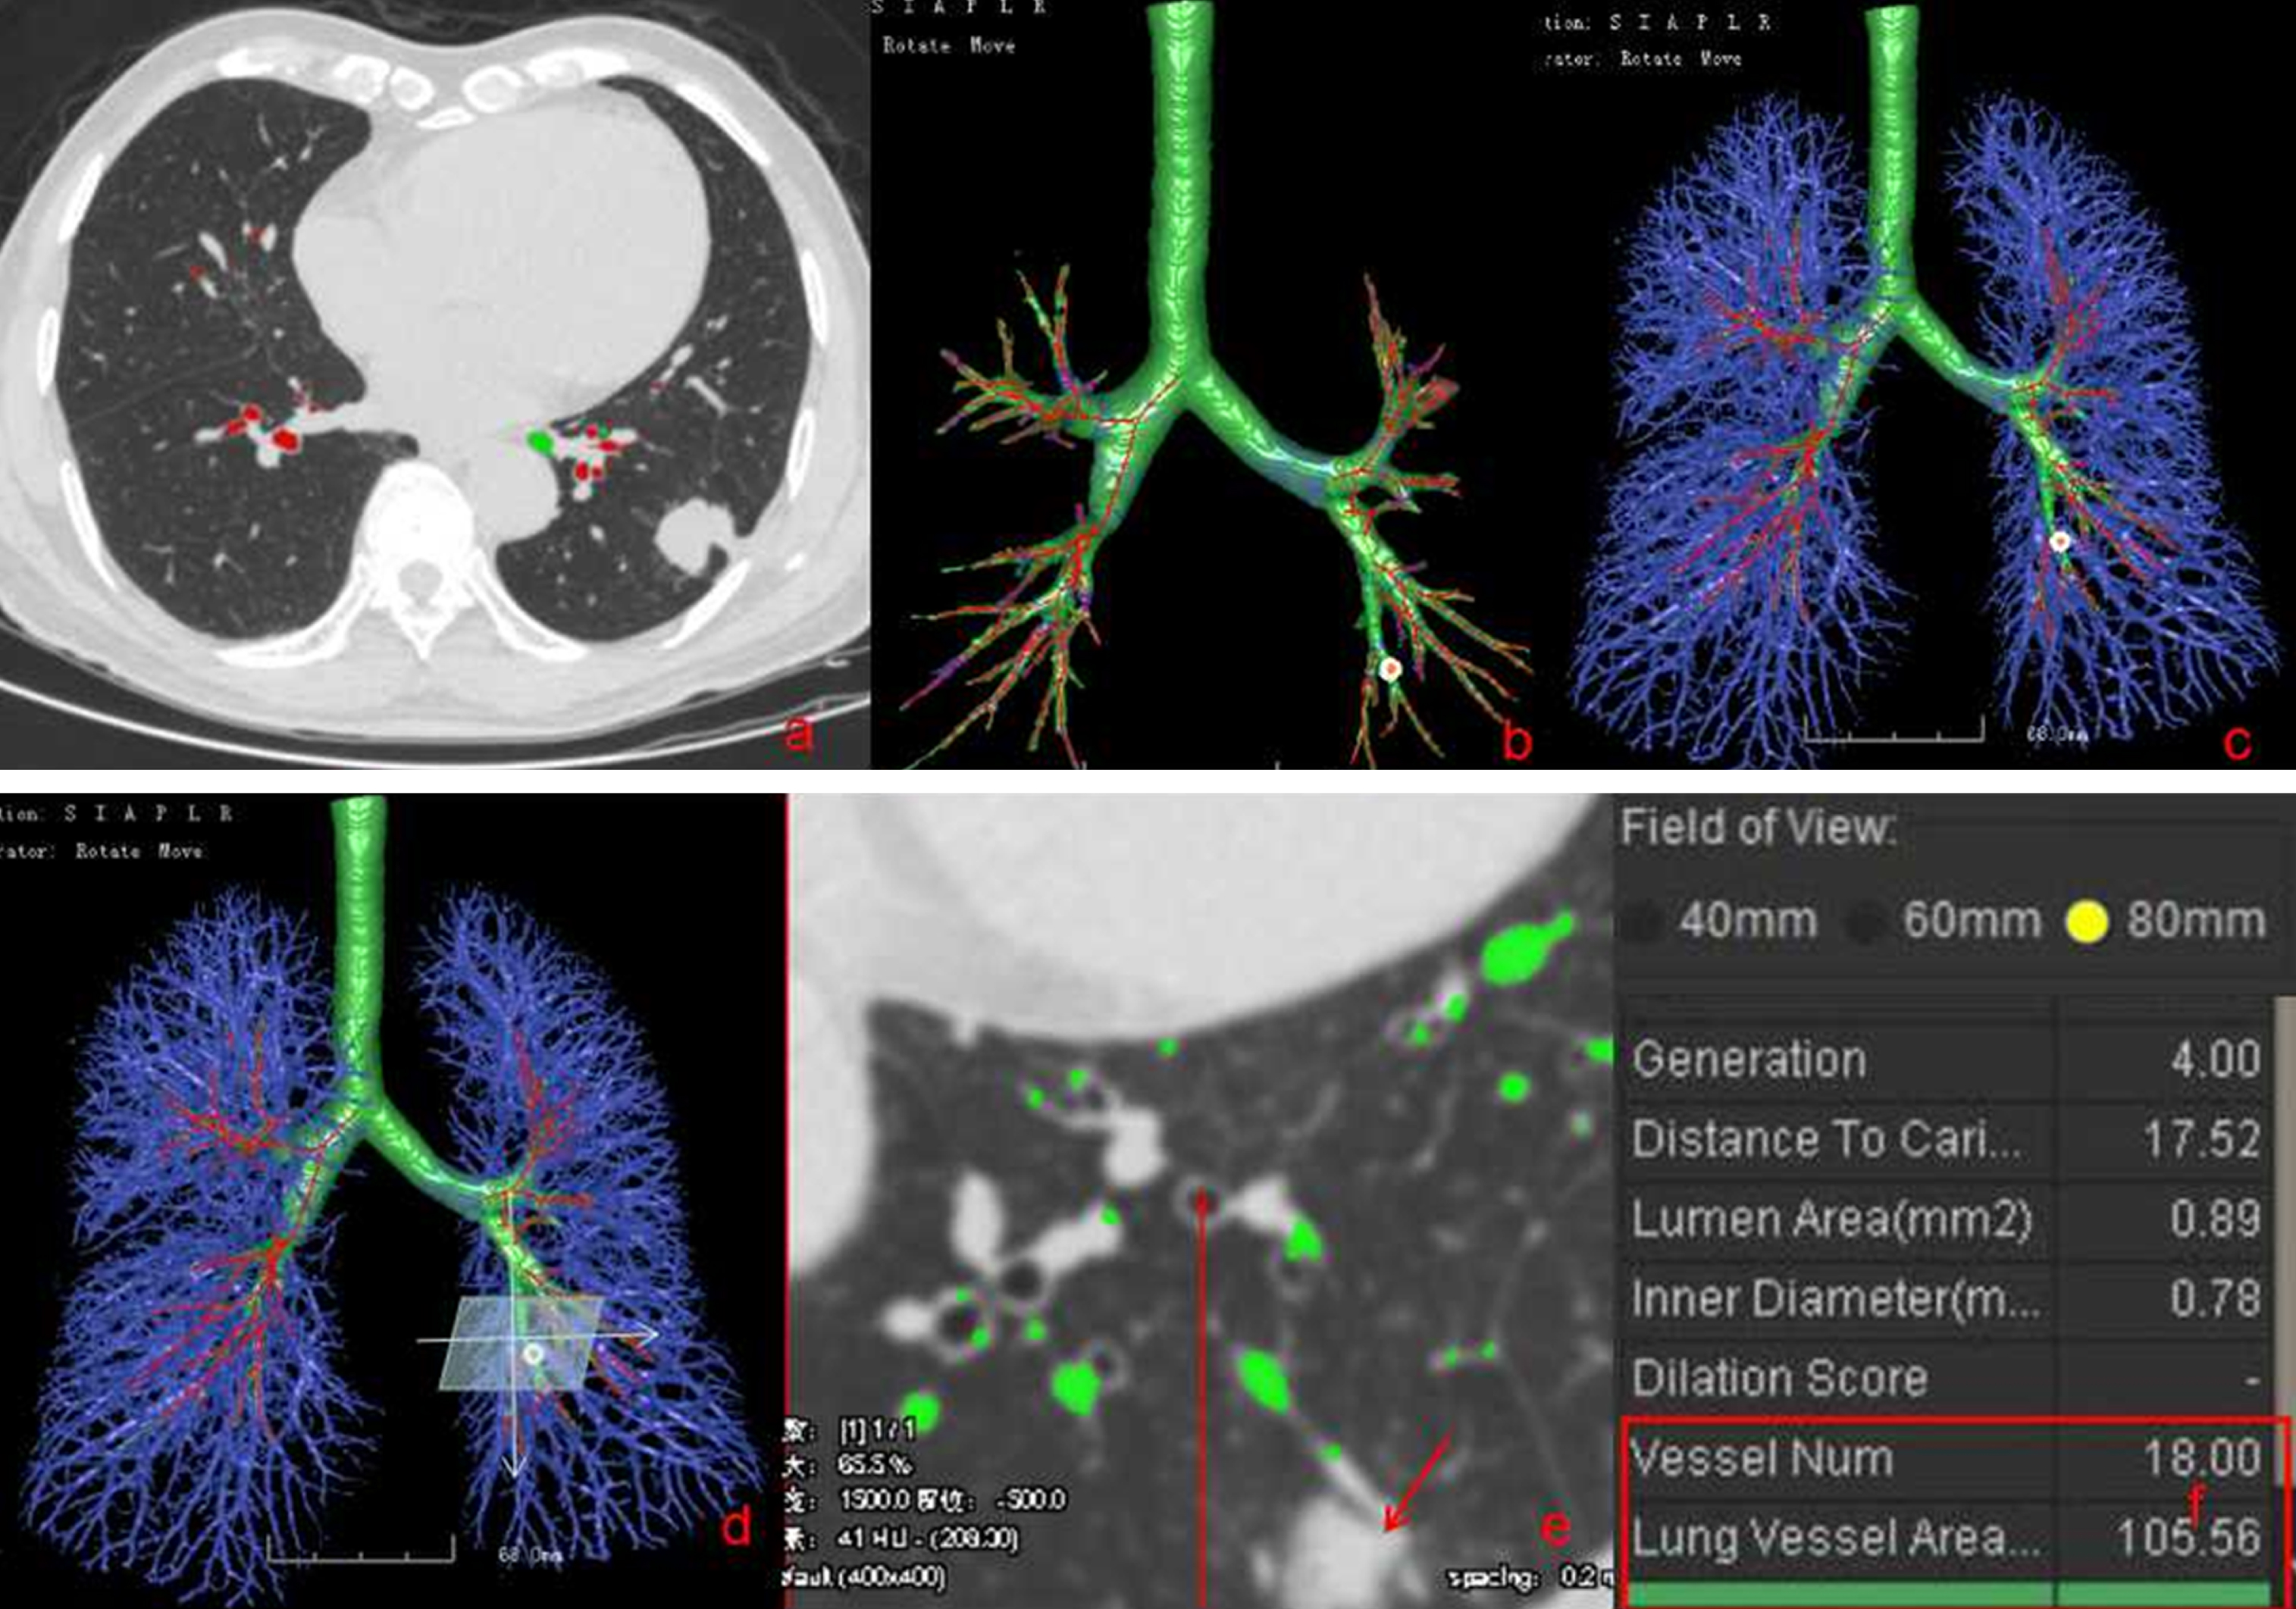
Measurement of pulmonary small vessels by 3-D automated approach: (a) lung cancer was located in the left lower lobe; (b) after selecting the bronchus, the software automatically segmented the bronchial tree, extracted the centerline (green line), and marked the bronchi (red dot); (c) in selection of pulmonary vascular, the software automatically segmented the vascular tree (blue); (d) marking of the bronchus (red dot) and targeting the FOV (light blue area); (e) a zoomed-in display of the cross-sectional area of FOV and the vessels (green point) perpendicular to the FOV and the tumor (red arrow); (f) simultaneous display of the vessel number and lung vessel area (red box).
Quantitative CT measurements included the choice of fifth- and sixth-generation bronchi as marker bronchi in the ipsilateral and contralateral lung cancer lungs and in control lungs. Thus, for example, in cases of left lower lobe lung tumors, the left and right lower lobes of the patient under study were selected as ipsilateral and contralateral targets (Fig. 5).
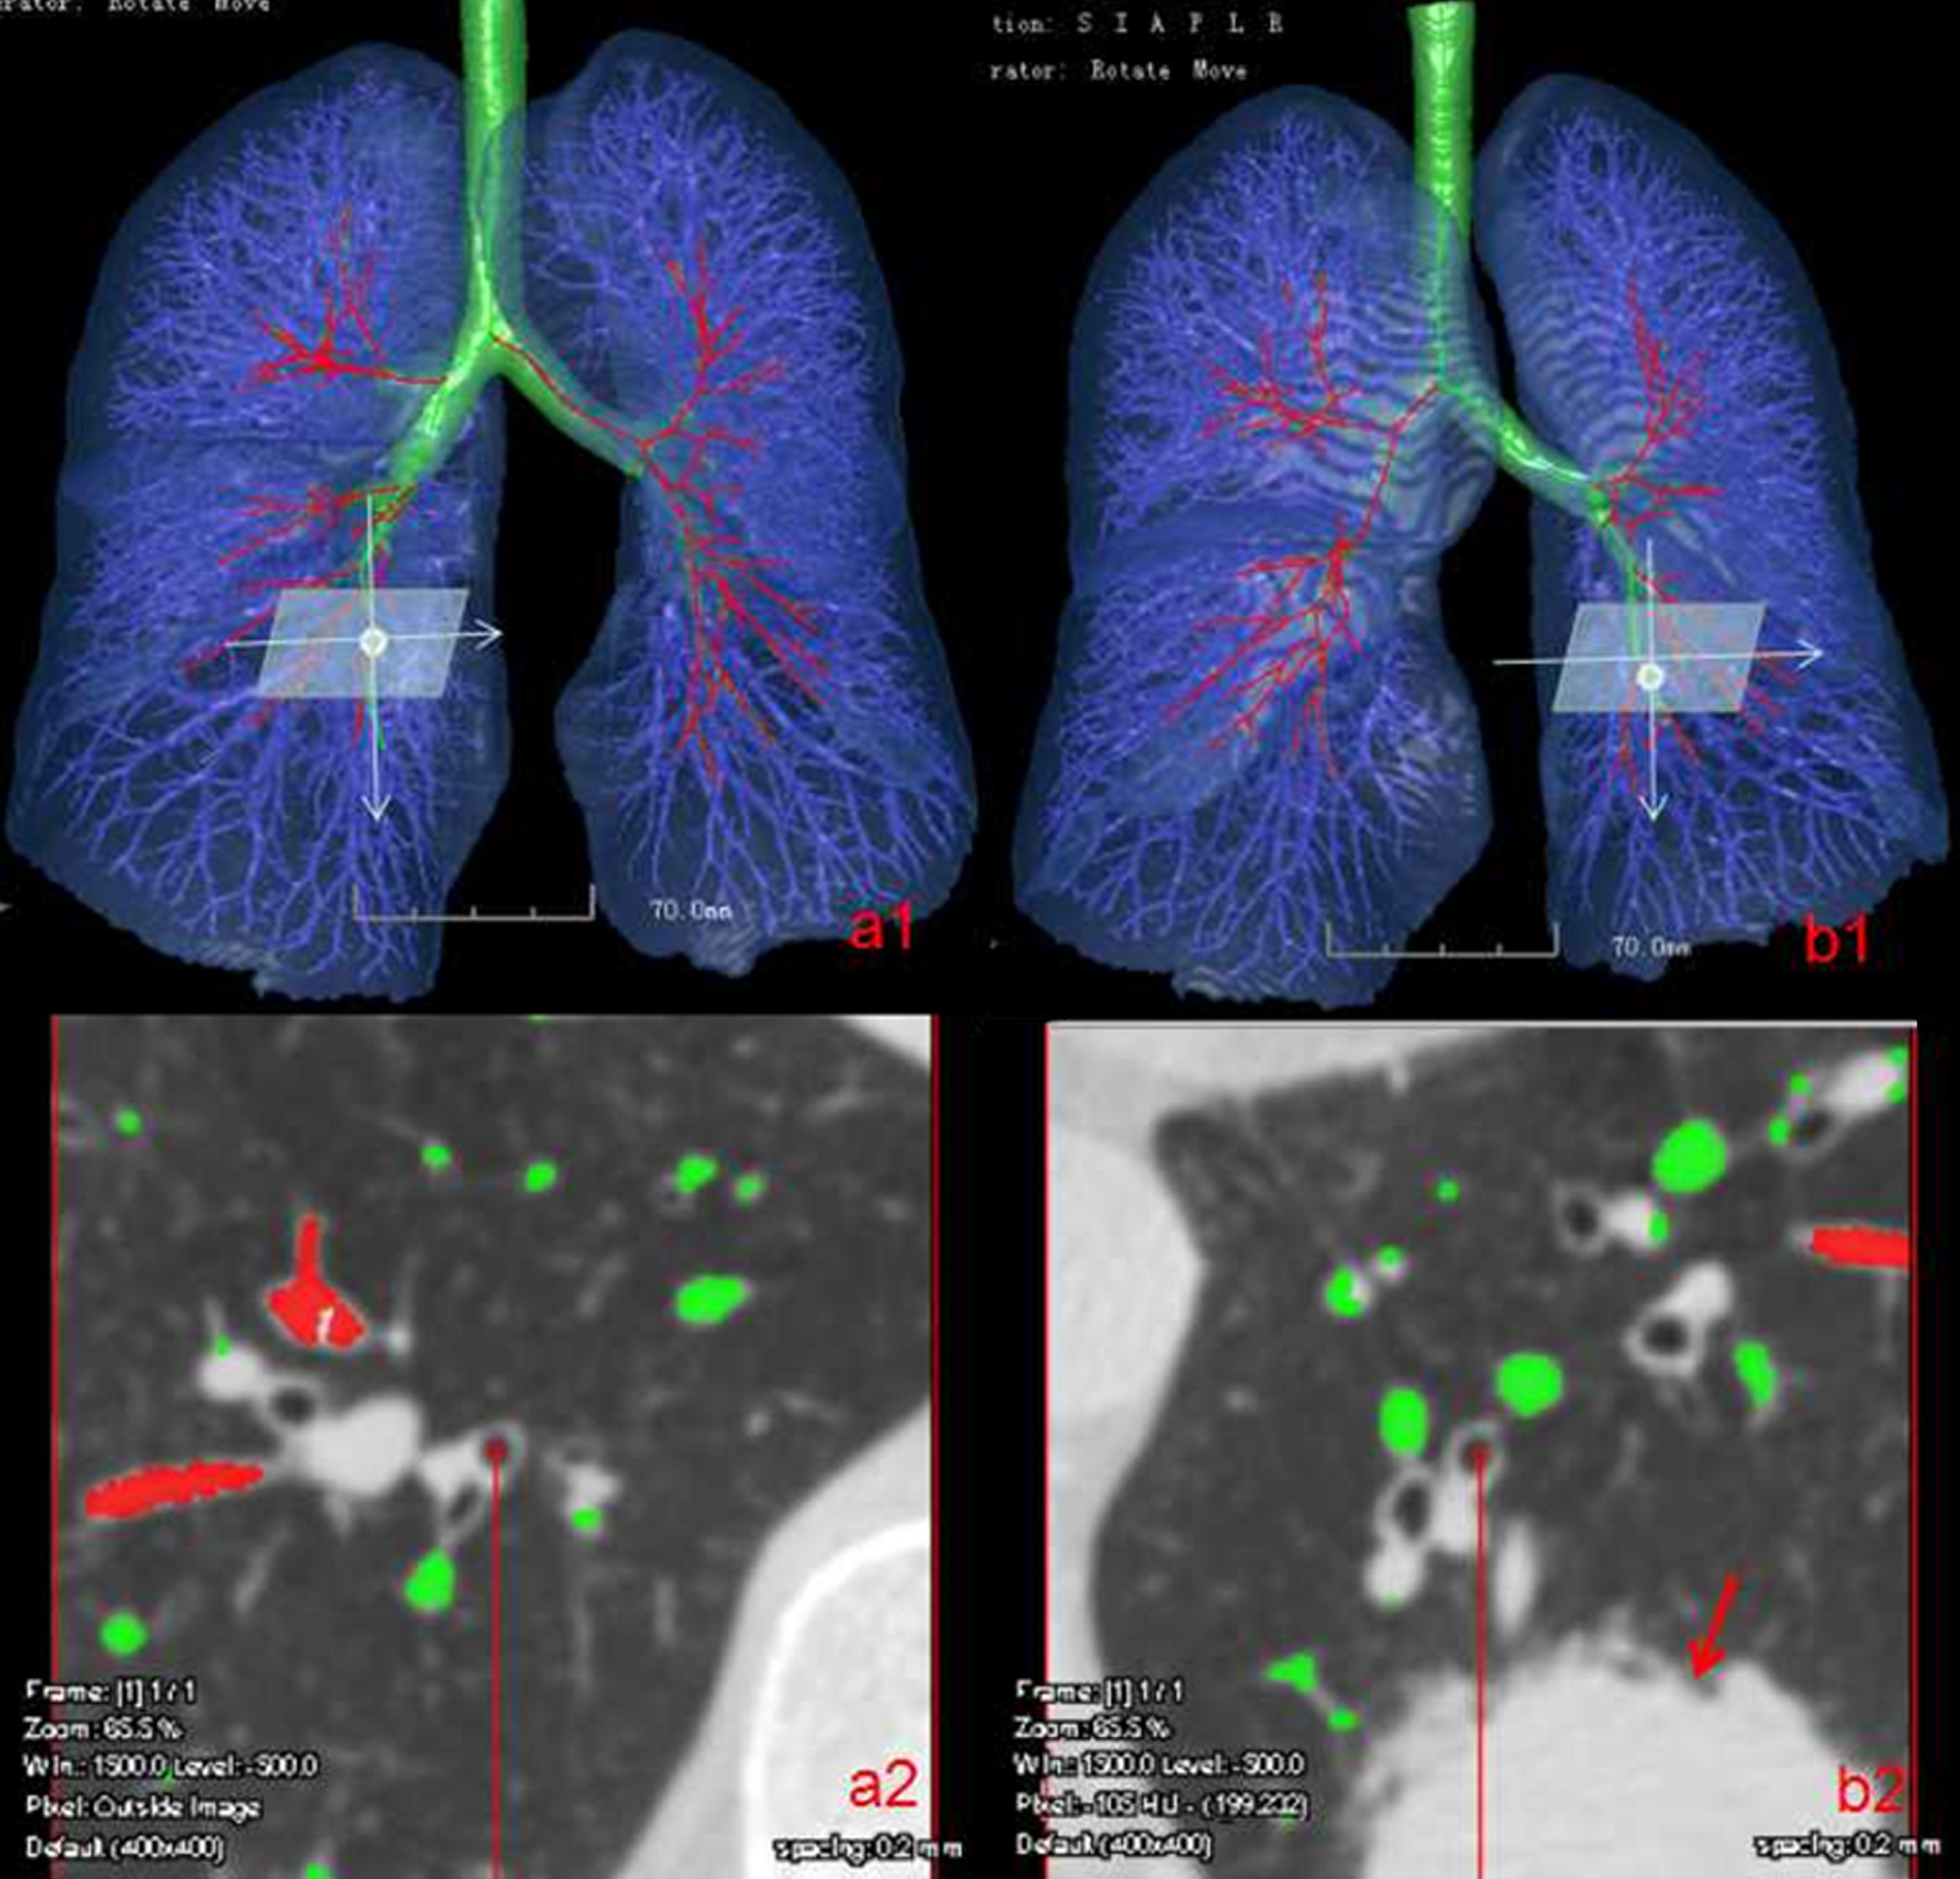
Contrast between the ipsilateral and contralateral vessels: (a1) the contralateral FOV was selected; (a2) zoomed in to display FOV of the contralateral side and target blood vessels (green); (b1) the tumor side FOV was selected; (b2) zoomed in to display FOV of the tumor side and the target blood vessels (green).
Data are expressed as means±standard deviations. The difference in time required for visual inspection and the 3-D automated approach, difference in pulmonary small blood vessels’ parameters (TNV and MAV) between lung cancer tissues, ipsilateral tissues, and control group tissues were analyzed by the t-test via the PASW Statistics for Windows, Version 18.0 (SPSS Inc., Chicago, IL, USA). A P-value < 0.05 was considered to indicate statistical significance.
Results
Study participant characteristics
The patient group in the present study included 162 people. This represented 109 males (87 of whom had a history of smoking) and 53 females (one of whom had a history of smoking) with an average age of 62±10 years, height of 1.67±0.08 m, and weight of 63.94±11.17 kg. A total of 59 cases of lung cancer were in the right upper lobe, 36 cases in the right lower lobe, 35 cases in the left upper lobe, and 32 cases in the left lower lobe.
In total, 178 people were enrolled in the control group: 171 males (including 51 with smoking history) and 7 females (including 0 with a smoking history) with an average age of 57±11 years, height of 1.69±0.07 m, and weight of 65.25±9.08 kg. There were 58 cases of right upper lobe lung cancer, 50 cases of right lower lobe cancer, 35 cases of left upper lobe cancer, and 35 cases of left lower lobe cancer.
The characteristics of the 162 patients and 178 healthy subjects assessed in the present study are summarized in Table 1. Comparisons of the average age, height, weight, and history of smoking between the two groups is shown in Fig. 6.
Study participant characteristics
Study participant characteristics
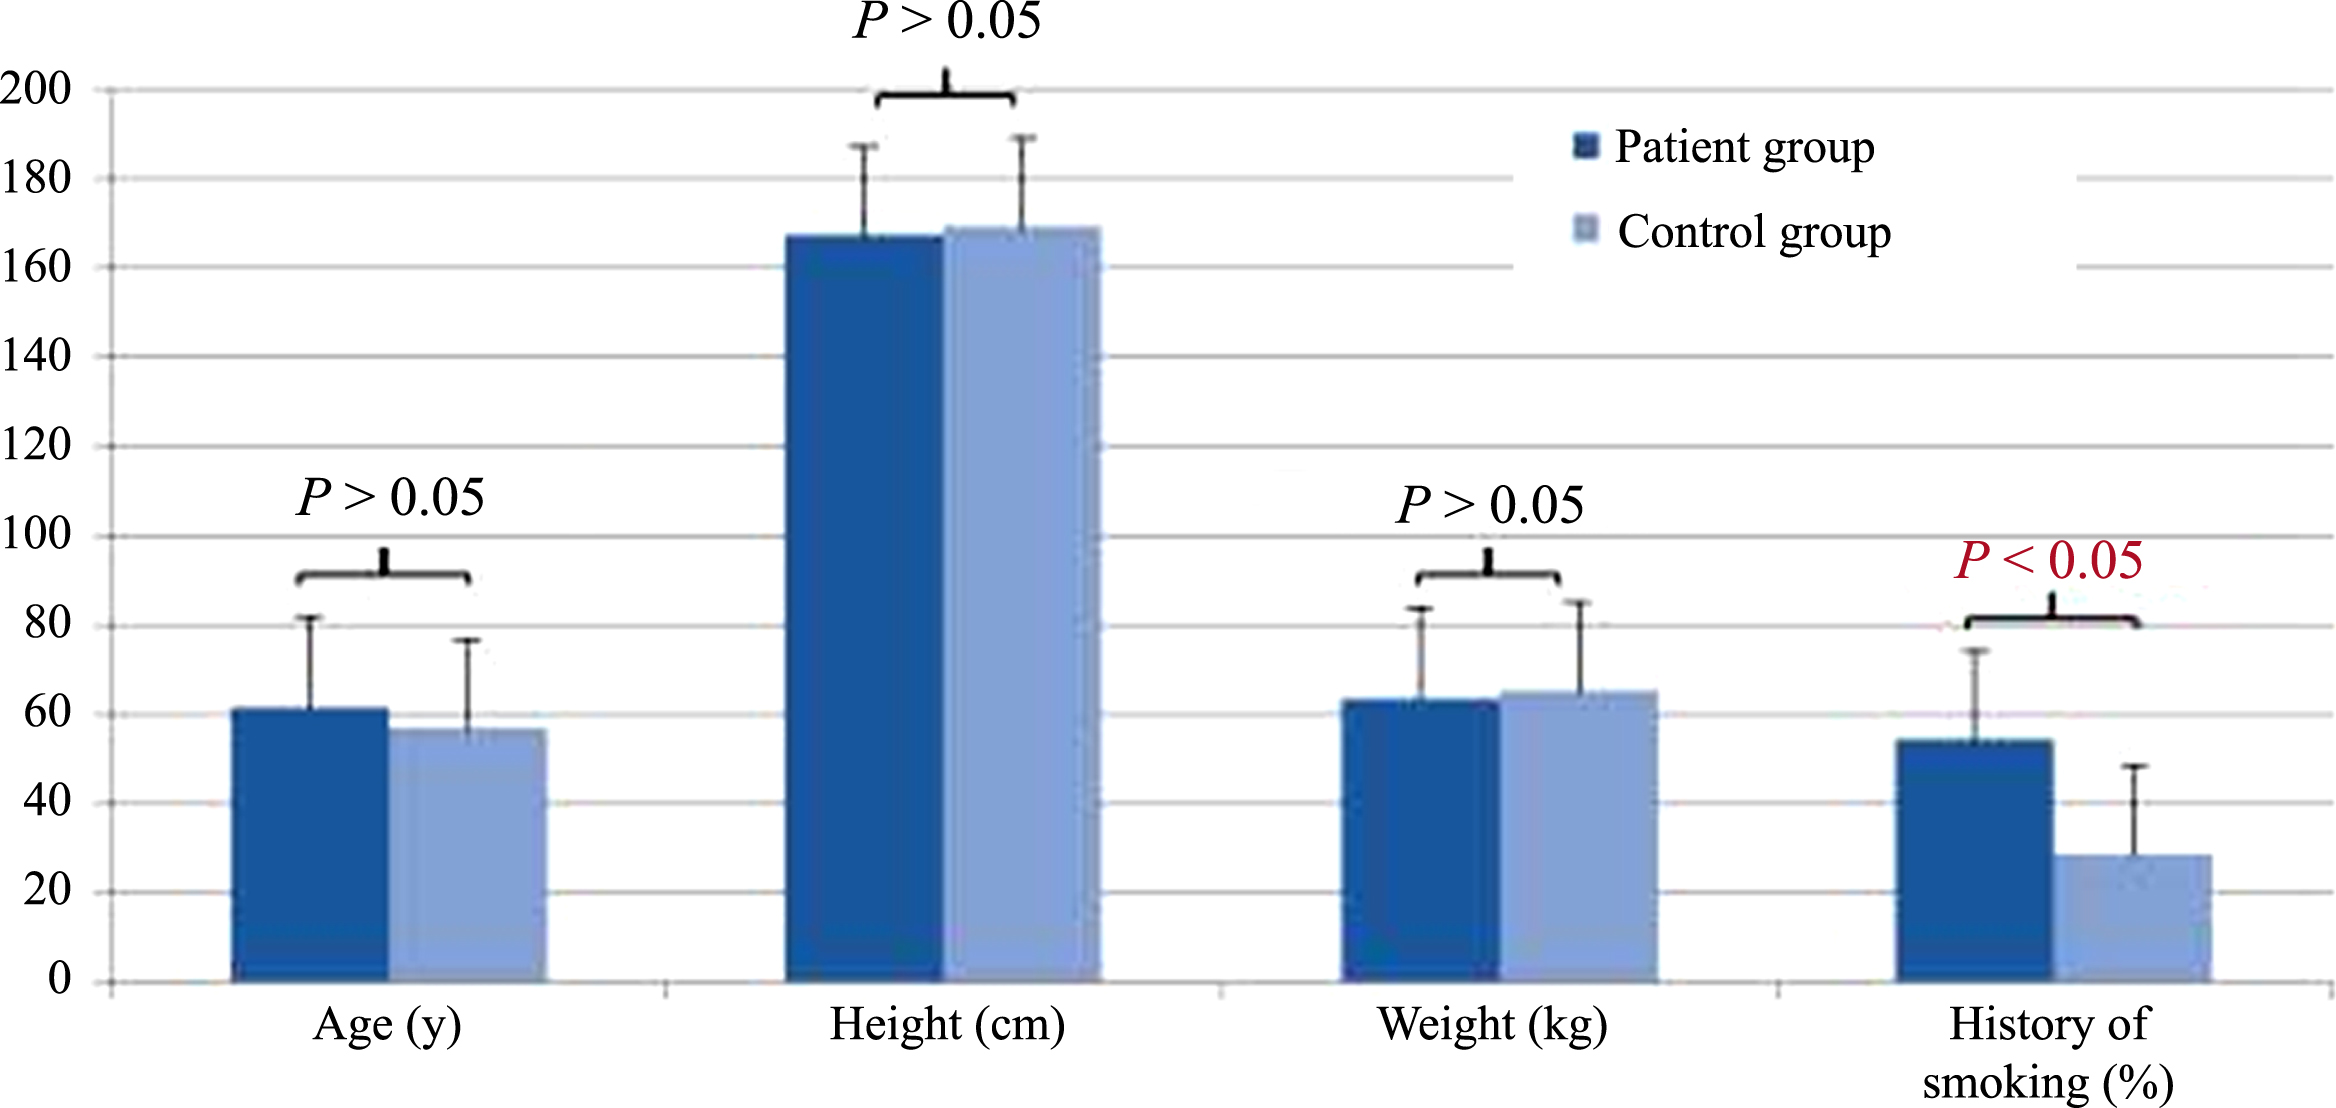
There were no significant differences in age, height, or weight between the patient and control groups (P > 0.05). There was a higher rate of positive smoking history in the patient than in the control group (P < 0.05).
The visual method revealed a lower ratio of ipsilateral lung pulmonary vascular abnormalities in lung tumor cases (151/162) than did the quantitative CT method (162/162). The time required to visually determine pulmonary vascular abnormalities (3.2±1.5 min) exceeded that required for quantitative CT measurements (2.5±1.3 min; P < 0.05). Details of these comparisons are in Table 2.
Identification of vascular abnormalities in lung cancer proximity
Identification of vascular abnormalities in lung cancer proximity
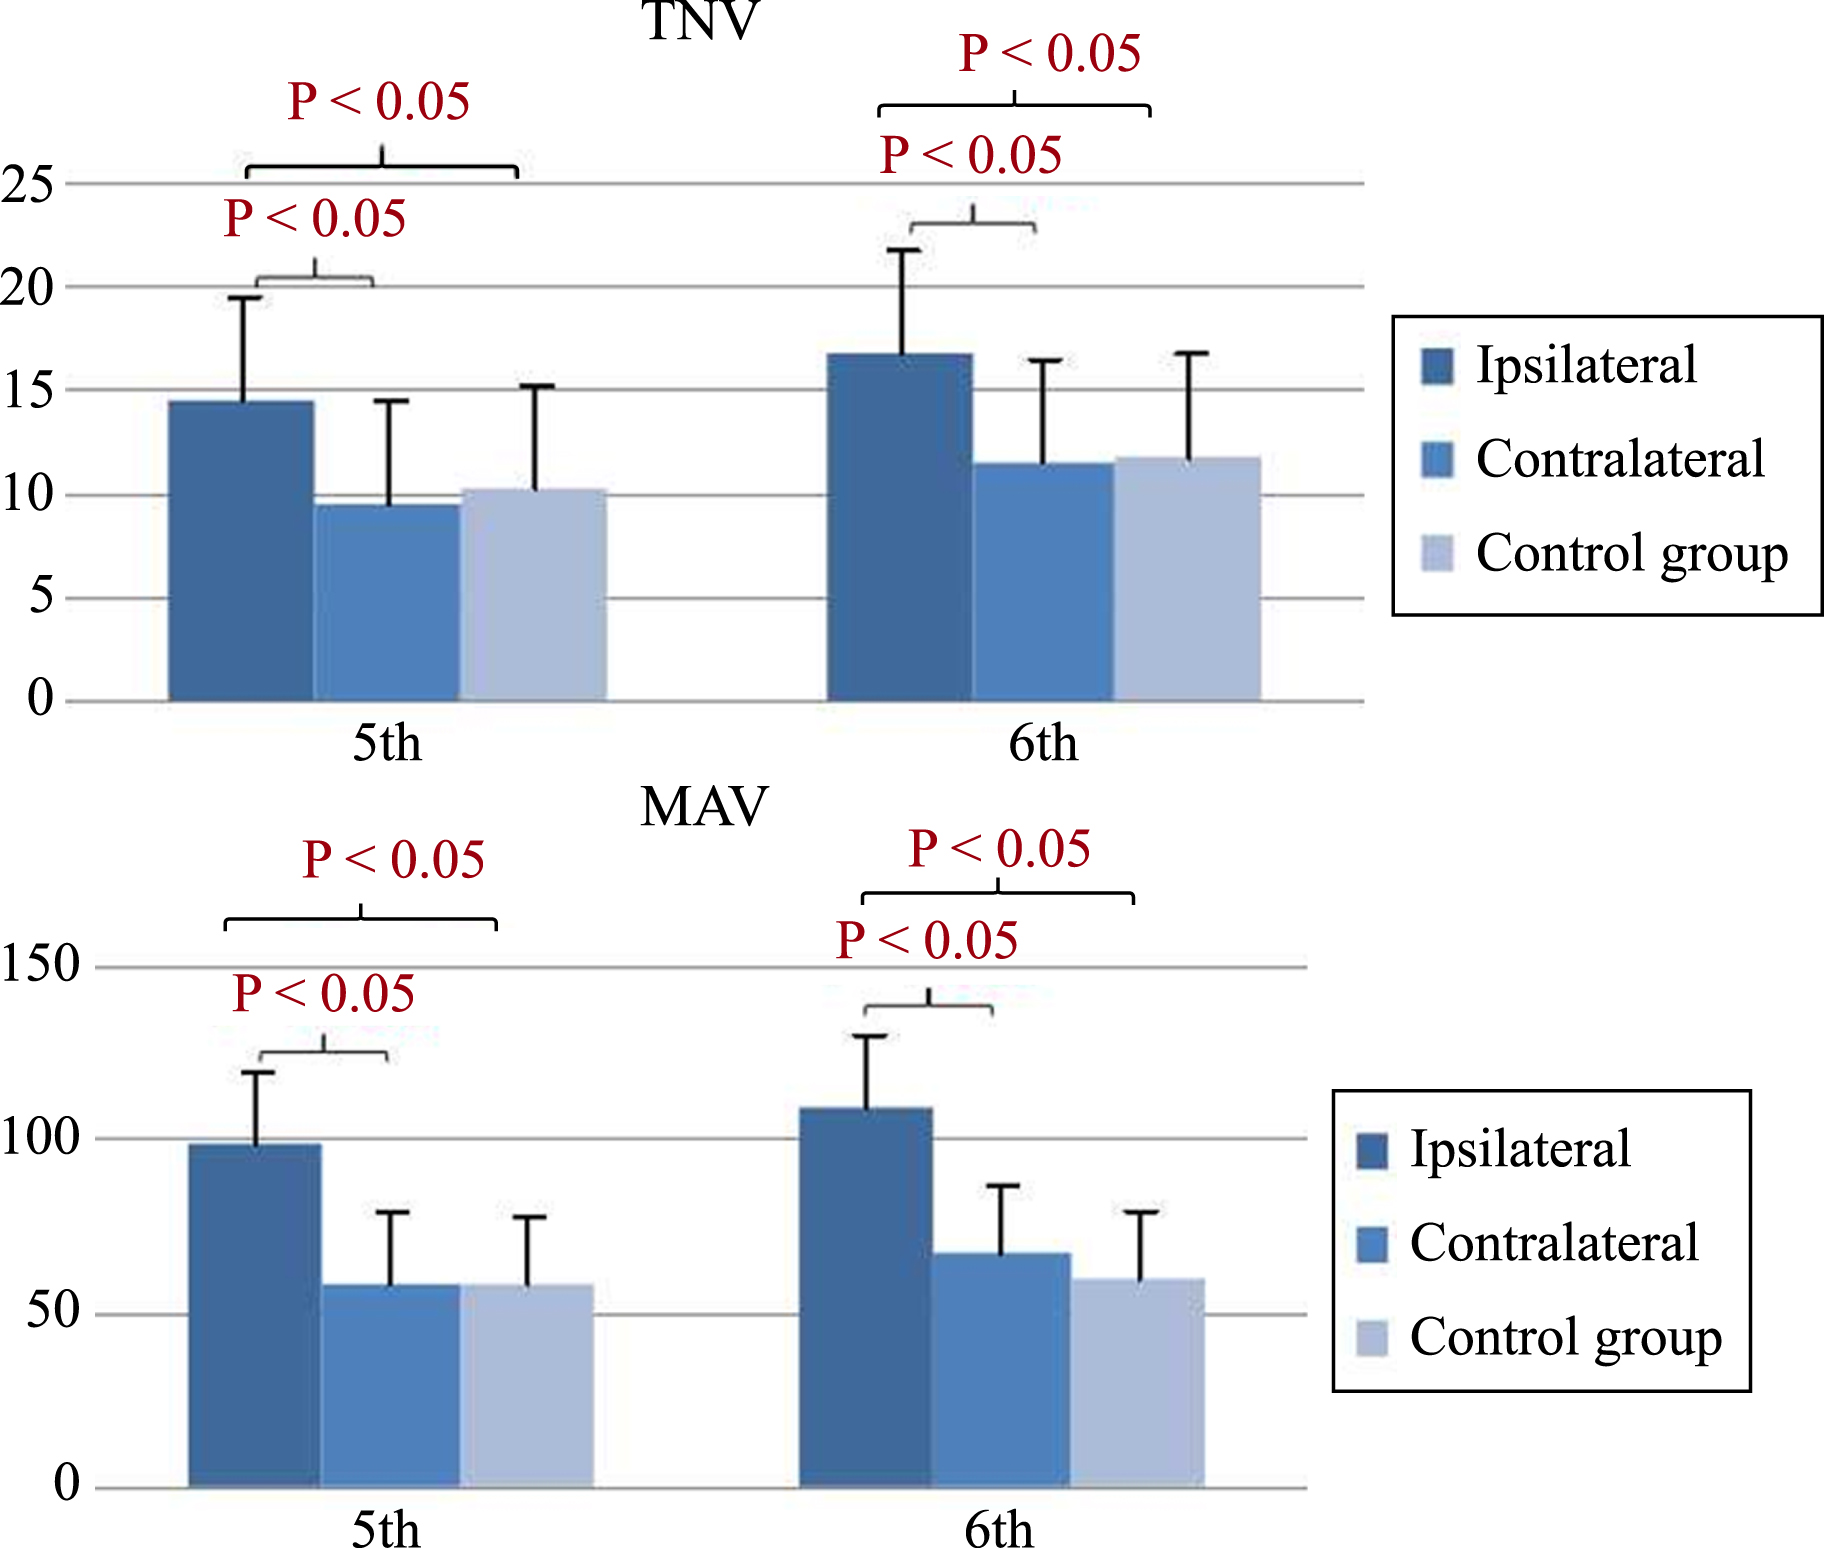
Quantitative CT measurements (listed in Tables 3 and 4) revealed that the TNV vertical to the fifth-generation bronchial cross-sections of the ipsilateral, contralateral, and control groups were 14.58±4.75, 9.58±3.74, and 10.22±4.07, respectively; the MAV were 99.70±26.20, 58.76±29.29, and 57.76±18.32, respectively. The TNV vertical to the sixth-generation bronchial cross-section of the ipsilateral, contralateral and control groups were 16.64±5.14, 11.59±4.06, 11.75±4.16; the MAV were 110.22±31.47, 67.62±30.41, 60.24±16.18, respectively. The TNV and MAV in the ipsilateral lung cancer tissues exceeded those in the side contralateral to the cancer and in the control group (P < 0.001) (Fig. 7).
The number and area of vessels in normal and fifth-generation bronchial cross-sections
The number and area of vessels in normal and fifth-generation bronchial cross-sections
The number and area of vessels normal to the sixth-generation bronchial cross-section
The number and area of vessels typical of the fifth and sixth-generation bronchial cross-section.
The tumorous lung tissues exhibit a highly malignant, rapid growth, and neovascularization is required to provide adequate supplies of oxygen and nutrition [16]. Thus, malignant lung cancer tumors greatly stimulate blood flow, causing vessel expansion. Lung cancer vascular abnormalities are strong indications of lung cancers, which are often readily detected by CT imaging analysis. Most available studies of the vascular morphology of lung tumors have been based on angiography or enhanced CT imaging, the application of which is greatly affected by the particular scanning technology employed, contrast agent concentration, and other conditions, including the expertise of the interpreter. In most lung cancer cases, only non-enhanced CT scans are available and any observations or studies of pulmonary vessels are reliant only on visualization, with no available quantitative methods. Therefore, rapid and accurate processing of CT scans for the prompt identification of abnormal vessels and the quantitative substantiation of positive or negative lung cancer diagnoses is often limited, a topic of considerable concern to the clinical oncology community.
In the present study, computer software that automatically identifies pulmonary vessels was successfully applied to elaborate on a quantitative CT measurement technique. This technique provided for the noninvasive, objective, and real-time detection of pulmonary parenchymal, bronchial, and pulmonary vascular structures. Furthermore, this method was based on the joint usage of pulmonary vessels and bronchial lines, which together form a bronchial vascular bundle. This is unlike reconstructed bronchial and vascular trees, which exhibit a high degree of geometrically similarity characteristics [12–15].
In contrast to obvious signs of abnormal vasculature, some more sensitive changes are challenging to detect and/or require the expertise of highly-qualified doctors. Given this, the time required for visual identification of vessel abnormalities in lung cancer cases varies in direct proportion to the degree of anatomical complexity and in inverse proportion to the consulting physician’s level of experience. In the present study, average time required for assessment of lung tissues via traditional visual methods was 3.2±1.5 min. Quantitative CT offered a significantly shorter processing time (2.5±1.3 min). This technique also clearly emphasized elements of pulmonary vessel target cross-section with different colors, and provided an automatic, unbiased quantification of the total number and area of pulmonary vessels in the cross-section. Therefore, we were able to conclude that the time required to utilize fully automatic 3-D quantitative methods to assess vessels surrounding cancerous lung tissues was significantly shorter than traditional visual assessment methods.
When angiogenic processes in healthy adults are well-balanced, their vascular systems remain at rest under normal physiological conditions. However, in malignancy, the vascular system grows quickly and tumor growth disturbs the balance between angiogenesis and its inhibition to meet the tumor’s blood supply demands [17, 18]. Theoretically, pulmonary vessels ipsilateral to the tumor should be in greater larger number and/or have a larger diameter than those in contralateral or healthy lung tissues. The present study confirmed this, revealing that the TNV on the tumor side were significantly larger than on the contralateral side. Additionally, these results are consistent with previously published theoretical and experimental data [19–21].
The increased vascular numbers found here are were necessarily accompanied by increased vascular diameters, as we contend that a significant increase in the former may result in reductions in the latter. Therefore, vascular measurements were instrumental in determining the true status of vascular diameters in the tissues assessed here. We used the mean lumen area of vessels, a reliable parameter that avoids possible misinterpretation due to simultaneous increases in vascular number and decreases in vascular diameter. In the present study, the MAV on the tumor side was significantly larger than that on the contralateral side, consistent with the theory outlined above.
The bronchial or pulmonary arteries supply blood to lung cancer tissues, rendering these vessels the subjects of enhanced CT or vascular CTA assessments of blood vessel number or diameter changes [22–24]. However, the use of enhanced CT is often cumbersome, with selection of bronchial or pulmonary arteries controlled for at the time of vascular CTA. Given this, the quantitative CT measurement method proposed in the present study not only required no enhancements, but also allowed for visualization of all pulmonary vessels surrounding the tumor.
The advantages of the automated imaging approach used in the present study include the following: 1) the bronchial tree and vascular tree were automatically separated/extracted; 2) any position of the pulmonary vessels was able to be marked; and 3) after selecting a particular vertical bronchial cross-section, we were able to automatically extract from that cross-section the corresponding number and area of its pulmonary vessels. In the present study, as well as in the broader field, the exact segmentation of the bronchi and blood vessels is critical. The fully automated segmentation method proposed here utilizes the main curvature and main direction of anatomical lung structures in a given geometric space, with uses in other applications reported elsewhere [25, 26].
While this study offers a number of significant benefits to the field, it also has some limitations that warrant discussion. These include the visualization of only those pulmonary vessels in a particular cross-sectional field of view area (of 80 mm x 80 mm). The groups were not balanced by sex. An additional limitation was our lack of histological studies with which to compare the imaging results. Future work may pair the methods proposed here with these more direct assessments.
Conclusion
The present study described a fully automated quantitative CT measurement method with which pulmonary blood vessels can be assessed. Vessel characteristics were quantitatively assessed, including morphological changes in the blood vessels near lung tumors. Through these quantitative analyses of pulmonary vascular differences in both diseased and healthy lung tissues, we propose a simple, time-saving, and reliable method for use in the clinical diagnosis and management of lung cancer patients.
Footnotes
Acknowledgments
This work was supported by the Public Science and Technology Research Funds of China (201402013) and the First Affiliated Hospital of Xi’an Jiaotong University fund (2014YK27).