
Abstract
In the lung biopsy image-guided surgery systems, the fiducial markers are used for point-based registration of the patient space to the CT image space. Fiducial marker detection and fiducial point localization in CT images have great influence on the accuracy of registration and guidance. This study proposes a fiducial marker detection approach based on the features of marker image slice sequences and a fiducial point localization approach according to marker projection images, without depending on the priori-knowledge of the marker default parameters provided by the manufacturers. The accuracy of our method was validated based on a CT image dataset of 24 patients. The experimental results showed that all 144 markers of 24 patients were correctly detected, and the fiducial points were localized with the average error of 0.35 mm. In addition, the localization accuracy of the proposed method was improved by an average of 12.5% compared with the accuracy of the previous method using the marker default parameters provided by the manufacturers. Thus, the study demonstrated that the proposed detection and localization methods are accurate and robust, which is quite encouraging to meet the requirement of future clinical applications in the image guided lung biopsy and surgery systems.
Keywords
Introduction
Pulmonary tumors are characterized by the highest fatality rate in the world, and lung biopsy surgery is one of the most commonly used strategies for diagnosing lung cancer [1]. Lung biopsy image-guided systems have allowed more efficient and less invasive surgeries and have thus become an important tool used by clinicians [2–4]. In image-guided surgery, surgeons can utilize anatomical features or fiducial markers to register between the patient space and the image space [5]. However, previous studies have shown that the registration accuracy based on fiducial markers is higher than anatomical features [6]. Thus, point-based registration using fiducial markers has been proven to be the most accurate and widely used registration method in clinical applications [7–9].
In point-based registration, fiducial marker detection and fiducial point localization in the patient space and the image space are critical and greatly influence the precision of registration [10–12]. Normally, in the patient space, the fiducial points are selected by a rigid tool and localized by a tracker. However, these corresponding points on the images are usually localized manually, which is time-consuming and relies to a large extent on the operator’s experiences [13, 14].
Researchers have attempted to develop various fiducial marker detection and fiducial point localization methods in the images. Considering marker detection methods, Tan used a template model to detect fiducial markers based on edge detection [15]. However, the accuracy of the algorithm was sensitive to the edge curve. Chen designed a method with k-means clustering and a polynomial curve to obtain the fiducial markers automatically [16]. But it was affected by the placement of attached fiducial markers. Gu employed a histogram-driven 3D region growing method and removed candidate fiducial markers that were too close to each other [17]. Nevertheless, this method was not evaluated using clinical data.
The following methods have been proposed for fiducial point localization: Wang localized fiducial points by matching the projection image to the model image [18]. Fattori implemented an approach to fiducial localization based on surface extraction and marker recognition according to geometrical parameters [19]. Nevertheless, these two methods both used considerable a priori knowledge, such as the default dimensions of the fiducial marker. Wang designed a method to calculate fiducial points based on the shape index and the curvedness of the surface segmented from CT images [20], but this method is time consuming due to a large number of calculations based on point cloud. Koch localized the fiducial points based on registration using the mutual information similarity measure in different orientations [21]. Unfortunately, it was semi-automatic, and the fiducial points had to be localized by the operator’s intervention.
In this paper, we propose an automatic method to detect the fiducial markers and to localize fiducial points in chest CT images without prior knowledge. The method is validated on various clinical and phantom CT image datasets to demonstrate its performance and clinical suitability. The main contributions of this paper are two-fold. First, our fiducial marker detection method uses the geometrical features of markers in CT images, which is less affected by the placements of attached markers. Second, our fiducial point localization method is based on the projection images of markers, without depending on a priori knowledge of the marker default parameters, which improves the accuracy and robustness of the fiducial point localization. In order to present this study and demonstrate its contribution, the remainder of this paper is organized as follows: the second section describes the algorithms of fiducial marker detection and fiducial point localization; the third section gives the results of experiments on phantom and clinical datasets; the discussion and conclusions are provided in the fourth and fifth sections.
Methods
In this study, we used the fiducial markers as shown in Fig. 1(a), which are the “MM3302 Multi-Modality IGS/CAS Fiducial Marker” from IZI Medical Products. The marker can be viewed as a donut with the manufacturer parameters of thickness 3.5 mm, outer diameter 15 mm and inner diameter 5 mm. We first detect fiducial markers and calculate their centroids based on the shape features of the marker’s CT images. Then, we localize the fiducial points based on the markers’ projection images and centroids calculated in previous step.

Fiducial markers: (a) Markers; (b) Six markers attached to the patient’s chest; (c) Visualization of markers and patient’s chest from CT volume data, with CT scanning coordinate system O-XYZ and a new effective cutting coordinate system O-XYZ.
Image sequence feature calculation
First, candidate markers such as markers and bones can be segmented based on their image intensities, which are higher than their surroundings. When fiducial markers are attached to the patient’s chest, as shown in Fig. 1(b), all markers are scanned along the CT scanning axis Z (shown in Fig. 1(c)), and a series of image slices are generated. Using one of these markers as an example, the transverse views of its image slices are shown in Fig. 2. These image slices, according to their shape features, are classified into two categories. The first is that all pixels of the marker in one image slice belong to one connected component (such as Fig. 2(a-c), (f-h)), and the second is that the pixels of the marker in one image slice are divided into two connected components (such as Fig. 2(d), (e)). Accordingly, the two image slice feature categories are defined as feature A and feature B, respectively. If there are other cases, they are all defined as feature C. Additionally, the image slice features determined by counting up the total number of connected components obtained by region growing algorithm in each image slice of candidate markers.

Transverse views of the marker’s image slices.
The features of each candidate marker’s image slices are arranged according to the order of scanning, which is defined as the image sequence feature (ISF) of the candidate marker. In addition, continuously repeated image slice features should be grouped; for instance, “AAA” is denoted as A. In the example shown in Fig. 2, it is clear that the ISF of the marker is “ABA”. Therefore, the real fiducial markers are detected whose ISF complies with “ABA”.
Due to various attached placements, the ISF of different markers calculated from the CT scanning images varies, which affects the detection of markers. Therefore, a new coordinate system of each candidate marker shown in Fig. 1(c) is needed to ensure that the ISF method is effective for marker detection. In the new coordinate system O-XYZ, the Y axis is defined by the vector from the point O (the centroid of the patient data volume) to the point O (the centroid of the marker). The Z-X plane is built which passes through O and is perpendicular to the Y axis. The point O is also the original point of the new coordinate system, and the Z axis is defined as the effective cutting axis.
After the transformation of coordinates, a plane, which is perpendicular to the Z axis, is used to cut each candidate marker at regular intervals to obtain the image slices and to calculate the ISF for fiducial marker detection. Construction of effective cutting axis can reduce the influence of the marker’s placement on the marker detection.
Marker detection process
To summarize the preceding discussion, the ISF method consists of the following steps (shown in Fig. 3):
I: The candidate markers are segmented based on the image intensities;
II: A new effective cutting axis is built based on the coordinate transformation for each candidate marker, which is cut along the new axis to obtain the slice image dataset S = {S i , i = 1, 2, … N} ;
III: The slice feature is determined by calculating the number of connected components obtained by region growing algorithm in each slice;
IV: All the slice features of each candidate marker are arranged in sequence to determine ISF to detect the real marker.

Marker detection process.
All the markers are confirmed by the ISF method in the previous step, and the centroids of all markers are calculated as follows:
Where N is the number of voxels in each marker, and x i , y i and z i are the 3D coordinates of each voxel.
However, the centroids of these markers are not the fiducial points for registration. A new method is proposed to localize the fiducial point of each marker based on the normal vector, the thickness and the centroid of the marker, which are calculated using the projection image of the marker volume data.
In our method, the marker voxels are projected to the Z-X plane along Y axis (shown in Fig. 1(c)), and the projection image shown in Fig. 4 is obtained.
Each pixel on the projection image generated from one or more of the marker’s voxels is uniformly defined as a value of 1. The shape of projection image is generally an ellipse ring. If the projection direction is parallel to the normal vector of the marker, the shape of the projection image would be a circle. As shown in Fig. 4, the major axis and the minor axis of the outer ring are OA and OB. Similarly, OA and OB are the major axis and the minor axis of the inner ring.
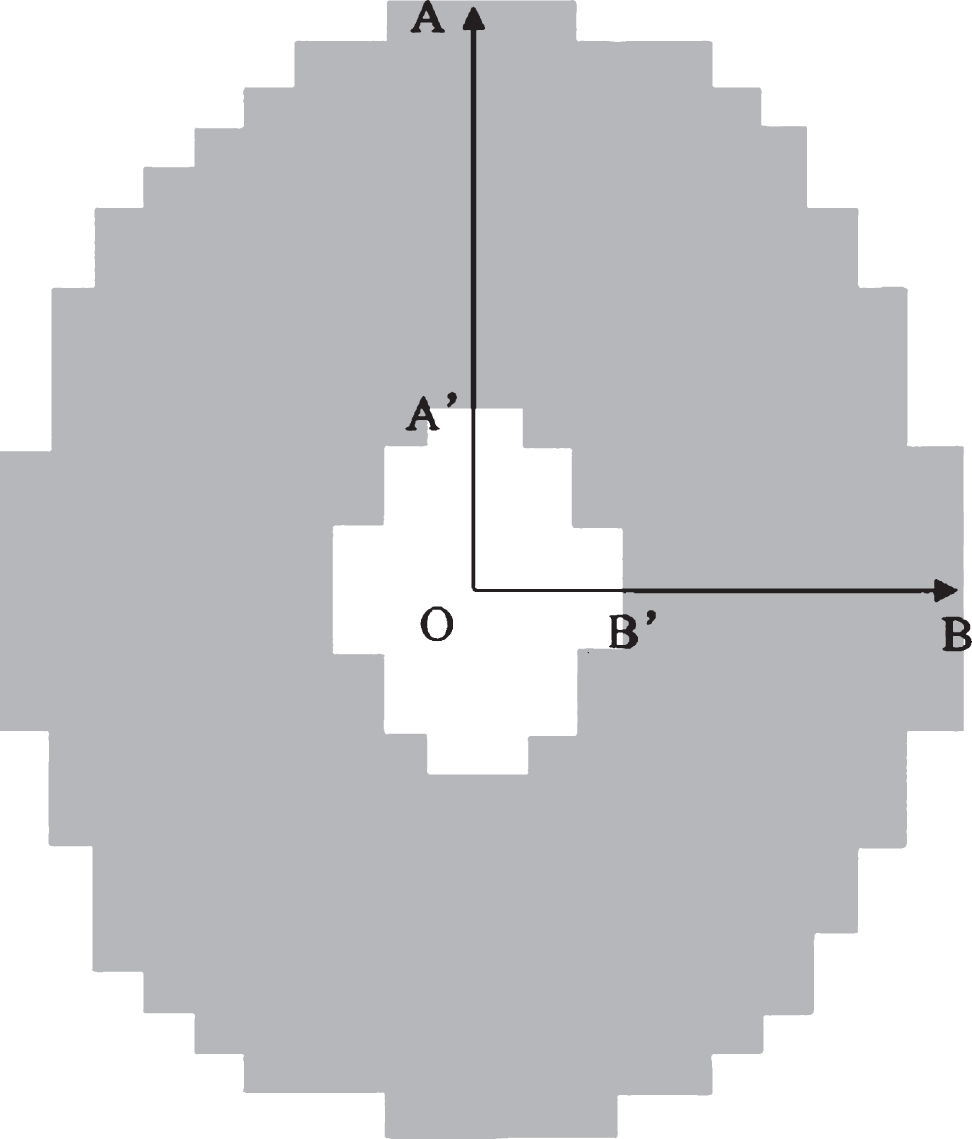
Projection image of the marker.
A plane passing through the Y axis and the minor axis OB of the projection image illustrates how the marker’s normal vector and thickness are calculated (shown in Fig. 5). Point O is the center of both the marker and the projection image. The thickness of the marker can be described as d. θ is the deflection angle between the marker and the projection plane, which is theoretically between 0° and 180°. Then, d and θ can be calculated by the following formulas:

Schematic illustration of marker’s normal vector and thickness calculation.
where R and r are defined as the radius of the outer circle and the inner circle of the marker. The radius R of the marker corresponds to the major axis OA of the projection image, and similarly r is equal to OA. While OA, OA, OB, OB can be calculated from the projection image.
Based on the preceding discussion, the automatic method of fiducial point localization is summarized by the following steps: I: Marker projection image acquirement: Iterate through all the voxels of the marker volume data, and project them to the Z–X plane along the Y axis and obtain the projection image; II: Major and minor axis calculation: Iterate through all the pixels of the projection image, and calculate the distance from point O to each pixel. The minor distance is OB. B is determined as the intersection between the extension line of OB and the outer edge of the projection image. Similarly, OA and OA can be determined, respectively, as the line segments which are perpendicular to OB, pass through the point O, and intersect the inner and outer edge of the projection image; III: Normal vector and thickness calculation: Calculate the thickness d and deflection angle θ of each marker using formulas (2) and (3). If the inner product of the Y axis unit vector and the CT scan axis (Z axis) unit vector is greater than 0, the marker unit normal vector is obtained by rotating the Y axis unit vector clockwise by θ degrees along OA. In contrast, the marker unit normal vector is obtained by rotating the Y axis unit vector anticlockwise by θ degrees along OA; IV: Fiducial point determination: Localize the fiducial point of each marker by moving the centroid O of the marker in the opposite direction of the marker unit normal vector at d/2 distance shown in Fig. 5.
Results
Clinical data study
We validated our approach on 24 patient datasets generated by two CT scanners: 10 datasets from the Aquilion of Toshiba medical system (0.67*0.67*0.5 mm one voxel) and 14 datasets from the brilliance iCT of Philips medical system (0.87*0.87*1 mm one voxel). Six markers were adhered to the chest of each patient for registration. In our experiments, all components of the system were developed in VS2010 and operated on a personal computer, equipped with four 1.8 GHz Core-i7-CPUs and 4G memory.
For the 24 patient datasets, all 144 markers were correctly identified. The mean execution time of 10 datasets with 0.5 mm image slice thickness was 4.7 s, and the mean execution time of 14 datasets with 1 mm image slice thickness was 4.2 s. Furthermore, the most time-consuming process was coordinate transformation for construction of effective cutting axis.
Accuracy test
To assess the validity of our method, we compared the automatically detected centroids and fiducial points of the markers with the ground-truth positions, which were manually selected by two lung biopsy image-guided system experts carefully. The two errors were defined as centroid error (CE) and fiducial point error (FPE). CE can be used to evaluate the accuracy of the fiducial detection algorithm, and FPE can be used to evaluate the accuracy of the fiducial localization algorithm accordingly. The formulas are shown as follows.
Where
From Table 1, we can see that the average values of CE and FPE of all 144 markers in 24 cases were 0.11 mm and 0.35 mm, respectively, which were clinically acceptable [20]. In addition, the standard deviations (SD) of CE and FPE were 0.04 mm and 0.03 mm, respectively. The results showed that our fiducial marker detection and fiducial point localization methods had a good performance in accuracy and robustness for imaged-guided surgery.
Measured markers’ parameters, CEs and FPEs in mm of all 144 markers in 24 cases
Table 1 also illustrated that there were some discrepancies between the marker parameters (thickness d, outer radius R, inner radius r) measured based on the formulas (2) and (3) by our method and the manufacturer default parameters (thickness 3.5 mm, outer radius 7.5 mm, inner radius 2.5 mm) of the“MM3302 Multi-Modality IGS/CAS Fiducial Marker”. To compare with performances of two groups of parameters, we used our proposed method to calculate the fiducial point coordinates and corresponding FPEs based on all 144 markers in 24 cases. And then the parameters measured by our method in the formulas (2) and (3) were substituted by the marker’s manufacturer default parameters to calculate another group of fiducial point coordinates and FPEs. The average value of FPEs for our proposed method was 0.35 mm, against 0.40 mm for the method with default parameters. As a result, there was an average of 12.5% accuracy improvement on fiducial point localization using parameters measured by our method, compared with the default parameters. Thus, the measured parameters had a better performance than the default parameters in fiducial localization.
Impact of image slice thickness
In addition, we examined the influence of image resolution on the localization accuracy of fiducial points. A homemade phantom fabricated of tempered glass was used to simulate the arch of the human chest, and six fiducial markers were adhered to different positions on the top and two sides of the phantom to simulate markers attached to the skin, as shown in Fig. 6.
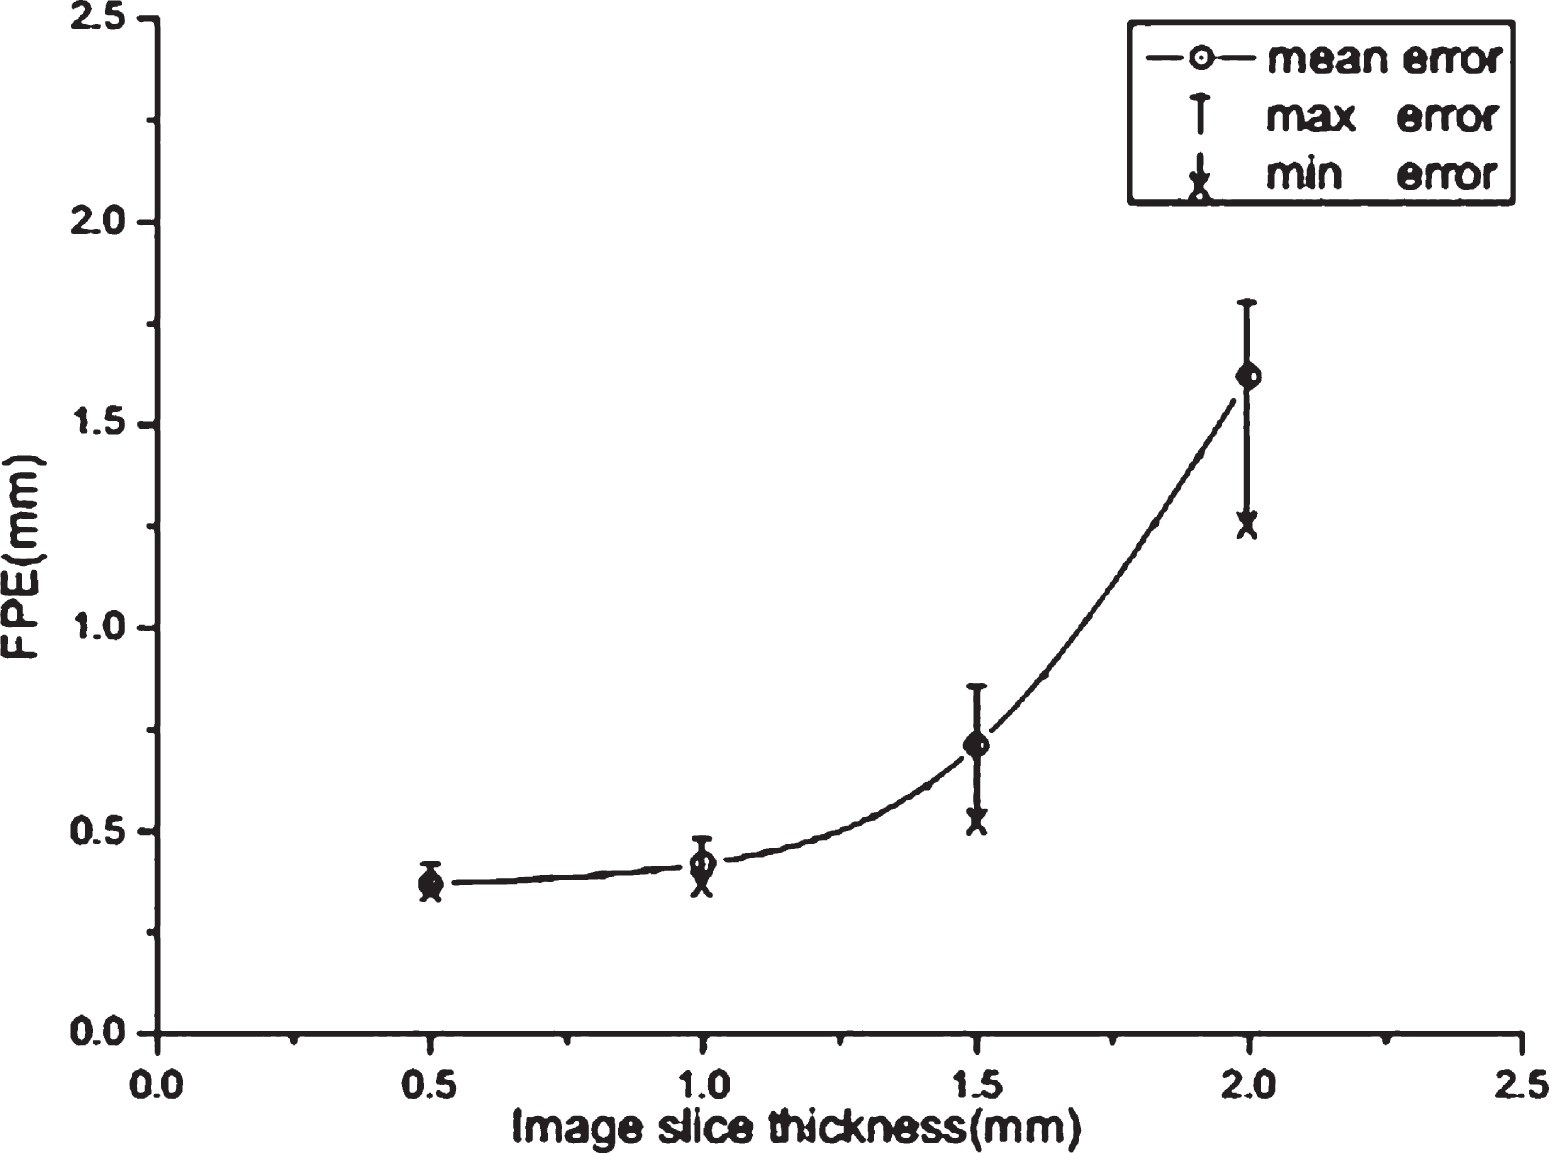
The phantom was scanned five times, respectively, at four resolution levels (image slice thicknesses of 0.5 mm, 1 mm, 1.5 mm, and 2 mm), and FPEs were assessed as shown in Fig. 7. The figure illustrates the relationship between the FPE and the image slice thickness in the fiducial point localization algorithm. We found that the FPE and the error range increased with increasing image slice thickness.
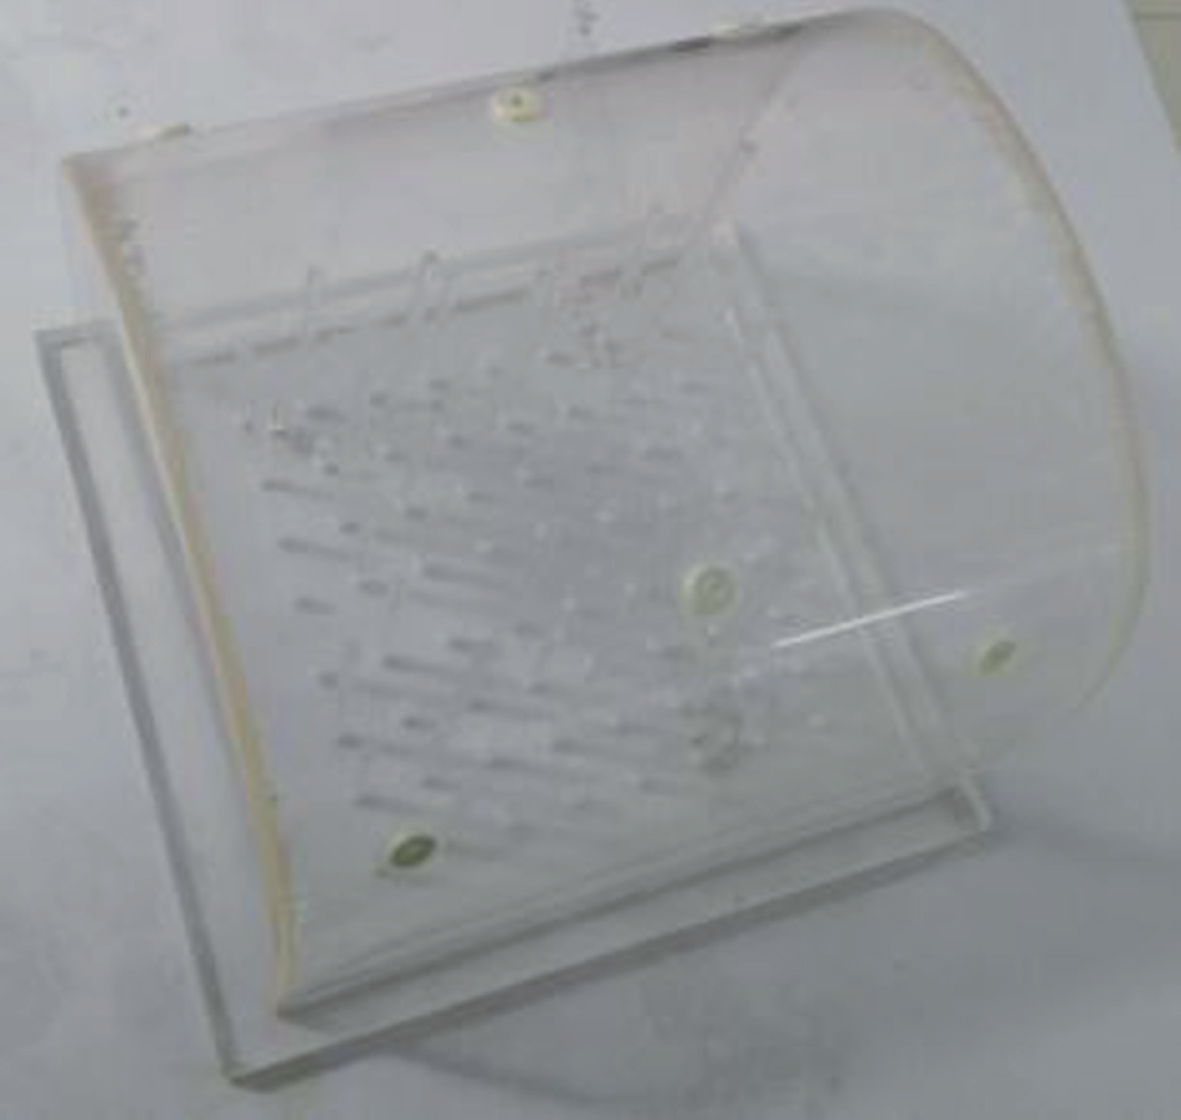
Six fiducial markers adhered to the geometrical phantom.
FPE versus CT image slice thickness for the phantom dataset.
In practice, some fiducial markers were damaged during application, as shown in Fig. 8(a). Some aged markers (shown in Fig. 8(b)) became thinner than normal markers. Such marker impairments are often observed in image-guided surgery systems. If the fiducial points calculated based on these imperfect markers are used for registration, the influence of marker impairments on the accuracy must be evaluated.
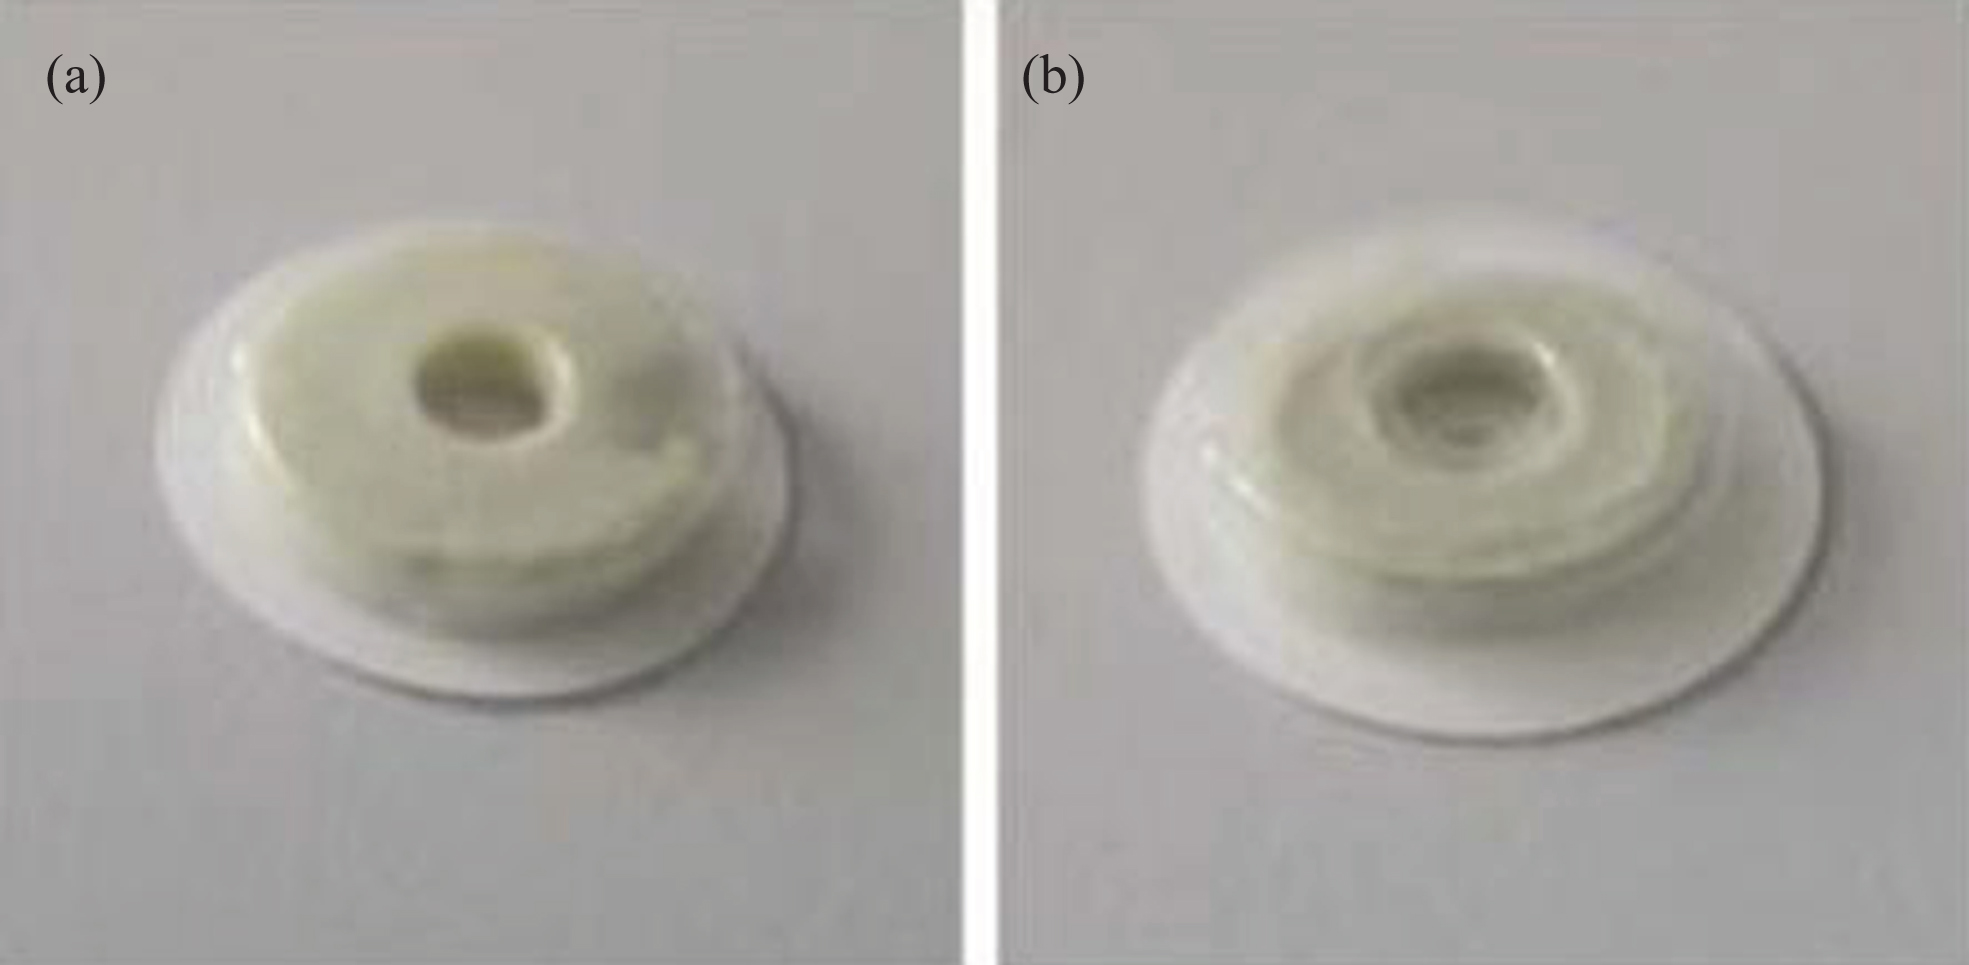
Imperfect markers: (a) a damaged marker, and (b) an aged marker.
In our experiment, six markers were used for registration based on the homemade phantom. In one case, one of the six markers was damaged while the remaining five markers were normal. In another case, an aged marker was attached to the phantom instead of the damaged marker. In the last case, all markers were normal. We localized the fiducial points and calculated the CEs and the FPEs in the three cases. In addition, the patient space and the image space were registered based on these markers, and fiducial registration error (FRE) was calculated according to the following formula [22].
where P and I are defined as the patient space and image space, respectively, N is the number of fiducial markers,
The experiments were performed, and the results were presented in Table 2. The CE, FPE and FRE calculated based on the normal markers are approximately equal to the values calculated when an aged marker was included, whereas the values calculated when a damaged marker was included are significantly higher than the values calculated in the other two cases.
CE, FPE and FRE in mm based on normal, damaged and aged markers in phantom experiments
In this paper, we propose automatic fiducial marker detection and fiducial point localization algorithms, which perform well in the lung biopsy image-guided surgery system. Table 1 clearly shows that the average value of FPEs is 0.35 mm, which is acceptable in clinical surgery. In addition, there are some small deviations between the parameters of the fiducial markers measured by our method and the default parameters provided by the manufacturer. The comparison of the CEs and the FPEs of the markers calculated based on the two different groups of parameters confirmed that our method is more accurate. Instead of traditional methods, which depend on a prior knowledge including the marker default parameters, our method improves the accuracy and robustness of the algorithm and gives more flexibility to variations on marker dimensions during application.
Table 1 also shows that the average value of FPEs is markedly larger than the average value of CEs, as the position of the fiducial point is calculated based on the marker’s projection image, which affects the FPE. Nevertheless, the projection image and the fiducial point localization method are sensitive to the image resolution, which has little effect on the fiducial marker detection and CE calculation. Therefore, the CT image resolution is the primary source of FPE. In the experiment, the phantom was scanned at four different image slice thicknesses to calculate FPEs (see Fig. 7). The mean FPE was 1.72 mm for the 2 mm image slice thickness and 0.73 mm for the 1.5 mm image slice thickness, which were both considered unacceptable. In contrast, the mean FPEs of the other two image slice thicknesses (1 mm/0.5 mm) were 0.42 mm/0.35 mm, respectively. The difference between these two errors is very small, and they both meet clinical requirements. Thus, clinicians can apply either of them in image-guided surgery, as needed.
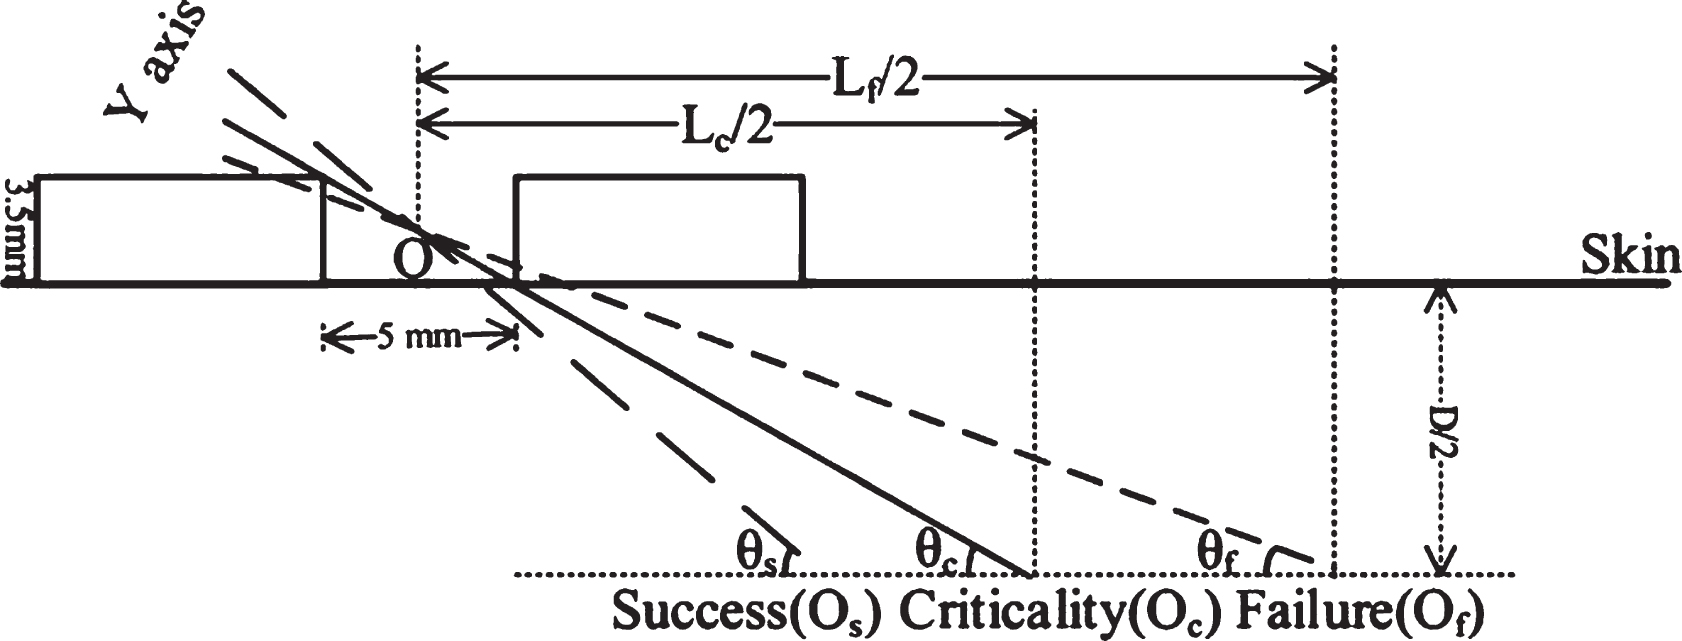
For the ISF method, the coordinate transformation can reduce the influence of the marker’s placement on the detection. However, there is also critical situation of marker’s placement which makes that the ISF method is not ideal for detecting markers. The three different situations of marker placement are shown in Fig. 9, including critical, success and failure situations. For example, in the critical situation, the Y axis (the vector from the center of the patient volume data O c to the centre of the marker O) passes through the upper and lower edges of the marker’s inner ring, and the plane that cuts the marker to generate the image slices is parallel with the Y axis. In this situation, the slice feature always corresponds to feature A, and the ISF method does not function for marker detection. In this case, the angle θ c between Y axis and the chest skin is 35°, which is calculated according to the thickness of the marker (3.5 mm) and the diameter of the marker’s inner ring (5 mm). For typical size of patients, the thickness D/2 (vertical distance from the centre of the patient volume data O c to the chest skin) is less than 20 cm. If D/2 is considered to be the critical value (20 cm), L c /2 (horizontal distance from patient volume data centre O c to marker center O) is approximately equal to 29 cm, which is far bigger than a person’s typical size. In the other situation, the angle θ f is less than θ c , and the ISF method cannot be used either, which is defined as a failed situation. Similarly, in this case, L f /2 (horizontal distance from O f to O) is larger than L c /2 (29 cm), which also does not conform to the typical size of a person. Therefore, it is not possible that the critical and failure situations occur. Conversely, the angle θ s is larger than θ c , and in this case, the ISF method is successful to detect markers, representing a success situation. Therefore, it was proven that our ISF method can be applied for the detection of fiducial markers attached to the chests of typical patients.
Schematic illustration of the three situations of marker placement.
In addition, impairments of the fiducial markers affect fiducial point localization. The two types of common impairments are damaged markers and aged markers. In the experiment discussed in the third section, damaged markers caused greater CE (0.32 mm), FPE (0.78 mm) and FRE (0.95 mm). These errors were not acceptable, and therefore, damaged markers should not be used in image-guided surgery. The damaged markers have little effect on the calculation of ISF and marker detection, but they will influence the calculation of the marker centroids and the analysis of marker projection images, thus leading to unacceptable results. In the case of an aged marker, the CE was 0.13 mm, the FPE was 0.43 mm, and the FRE was 0.45 mm. The result is highly acceptable and confirms that the utility of our algorithm is not restricted to the marker default dimensions parameters.
In general, our fiducial marker detection and fiducial point localization methods provided satisfactory results. Failures were rarely observed in the experiments of clinical and phantom datasets, which is extremely encouraging for applications in lung biopsy image-guided surgery systems. Furthermore, the proposed methods are robust for applications with different marker dimensions and placements. Although only chest CT datasets were investigated in this study, the proposed methods can be easily applied to other types of surgery. However, our methods are sensitive to the resolution of the CT images; therefore, our future work will focus on optimizing the marker projection image algorithm and reducing the dependence on CT image resolution.
Footnotes
Acknowledgments
The authors would like to thank the editor and reviewers for improving the quality of the paper. This work is supported by National Natural Science Foundation of China (NSFC) (Grant No. 61701103).