
Abstract
BACKGROUND:
X-ray CT/micro-CT methods with photon-counting detectors (PCDs) and high Z materials are a hot research topic. One method using PCDs allows for spectral imaging in 5 energy windows while conventional X-ray detectors only collect energy-integrating data.
OBJECTIVE:
To demonstrate the enhanced separation of contrast materials by using PCDs, multivariate analysis, and linear discriminant methods.
METHODS:
Phantoms containing iodine and aqueous nanomaterials were scanned on a MARS spectral micro-CT. Image volumes were segmented into separate material-specific populations. Contrast comparisons were made by calculating T2 test statistics in the univariate, pseudo-conventional and multivariate, spectral CT data sets. Separability after Fisher discriminant analysis (FDA) was also assessed.
RESULTS:
The T2 values calculated for material comparisons increased as a result of the spectral expansion. The majority of the tested contrast agents showed increased T2 values by a factor of ∼2 -3. The total significant T2 statistics in the pure and mixed lanthanide image sets increased in the spectral data set.
CONCLUSION:
This work consolidates the groundwork for photon-counting-based material decomposition with micro-CT, facilitating future development of novel nanomaterials and their preclinical applications.
Keywords
Introduction
In the past 10–15 years, the X-ray imaging field has seen a drastic increase in literature concerning “spectral” computed tomography (CT). The term “spectral” has been used to describe any X-ray-based imaging technique which utilizes the energy- and material-dependence of photon interactions with matter. This differs from conventional X-ray CT which only utilizes the material-dependence of these interactions. Therefore, a spectral CT data set inherently contains more information about the scanned sample than a conventional CT data set, where the increase in information obtained is directly related to the ability of the spectral technique to differentiate the energy component(s) of the radiation used during the scan. An analogy can be found in visible light detection where photons from the broad visible spectrum can be measured by cameras which subsequently bin the photon counts into one (BW) or several (RGB) channels. In the same way that RGB expands the dimension of measured visible photons from a single dimension to three dimensions, spectral CT methods provide the means for expanding of the energy dimension of measured X-ray photons. Several spectral methods are currently available which utilize unique hardware configurations including dual-source [1, 2], fast kVp switching [3–8], and photon-counting detectors (PCDs) [9–16]. Each of these methods differ in how energy information is obtained and at what resolution (i.e. how many channels or energy bins). The higher the energy resolution (more energy bins), the greater the energetic expansion in the measured data.
Coupled with the spectral expansion of CT imaging data, the adoption of multivariate statistical methods should be used to analyze the information contained in the resulting data sets. Indeed, He et al. [16] demonstrated how the spectral data can be compressed without significant data loss through the use of principal component analysis (PCA). This multivariate method extracts the similarities contained within the spectral dimensions of the data set and can be used to improve contrast resolution and signal-to-noise ratio in comparison to each of the original energy images. That being said, however, the purpose of many imaging techniques is centered at material differentiation whether it be between healthy and disease-state tissues or, in the case of dynamic contrast-enhanced (DCE) imaging techniques, between native tissue and the contrast agents (e.g. iodine, gadolinium). Therefore, multivariate statistical methods which extract similarities between energy bins (e.g. PCA) may be ill-suited to achieve material separation at high sensitivities versus methods, such as Fisher’s discriminant analysis (FDA), which build models that maximize separation between materials. This is especially true in areas which contain low concentrations of contrast materials or in applications involving a combination of contrast materials. The objective of this paper is to demonstrate the increased ability to differentiate contrast materials through the use of spectral imaging techniques (specifically through photon-counting detectors), multivariate statistics, and linear discriminant methods.
Dual-source and fast kVp switching have been adopted in many clinical scanners produced and developed by the major companies in the area, namely Siemens and GE. These methods utilize source-level variations in the X-ray spectra, while the detectors in these scanners are conventional, energy-integrating detectors. A dual-layer detector is used by Phillips for dual-energy data sets. Known differences in the spectra and the addition of contrast materials (most often iodine-based) have allowed for the first wave of material decomposition (MD) through spectral means. These methods have been used in several clinical applications including diagnosing thyroid disease [6], cardiac scanning [1], and venography [8]. In the end, these methods allow for the expansion of the spectral dimension from a single, energy-weighted dimension into two, energy-weighted dimensions, where the count variations measured in these two channels are directly related to the differences in the spectra.
In contrast to the dual-energy methods (dual-source, fast kVp switching, and dual-layer detection), photon-counting detector methods of spectral imaging have yet to be incorporated into the clinic. This slow transition may be attributed to the fact that the specialty semiconductor arrays used for X-ray detection work at comparably low-count rates relative to conventional detectors. Additionally, it is quite expensive to manufacture clinically-sized, photon-counting detector arrays. Despite the current clinical limitations of these detectors, they have been the subject of many simulations [10, 13, 15] and have been incorporated into pre-clinical scanners [16–20], such as the Medipix All Resolution Scanner (MARS) micro-CT developed by CERN and MARS Bioimaging Ltd. As with the dual-energy methods, expansion of the spectral dimension can be achieved; however, instead of an expansion from 1D to 2D, the Medipix 3.0 detector allows for up to 8 dimensions of spectral data, 5 of which have specialized electronics which correct for charge-sharing, to be measured in a single exposure through the use of application-specific integrated circuits (ASICs). This is achieved by setting energy thresholds which determine the arrangement of 5 differential energy bins. The early studies cited here have focused on utilizing this spectral expansion to demonstrate the ability of photon-counting to increase material separation and decomposition compared to energy-integrating detectors. Up to this point, separation of materials within this framework has been demonstrated through segmentation via linear least squares [21, 22] and the comparison of angular measures between energy-bin pairs of attenuation coefficients [23].
Another major technique for MD which has been discussed is through K-edge imaging. This method places thresholds at the same energies of the discontinuities seen in high Z materials’ attenuation curves (a.k.a. the K-edge). Energy bins on either side of a K-edge will have different attenuation coefficients (lower in the window below the K-edge bin), which has been hypothesized (and shown through simulation) to help differentiate between multiple K-edge materials in an image. These measurements allow for the decomposition of the acquired data into the following basis function model [11, 22, 24]:
Despite the bin-width optimization put forth by our group [15], several real-world limitations of the detectors are not considered in such simulations. The optimized bin widths were determined to be ∼4 keV, yet bin widths that are this narrow are impossible to achieve with the current scanners. This results in detection errors of up to ±5 keV. Despite this limitation of the current detectors, K-edge information is still very valuable in spectral imaging, and the development of novel contrast materials are actively being explored by several groups around the world [5, 7, 25, 26].
Outside of the K-edge model framework, the built-in MARS-MD algorithm uses a three-step heuristic process which culminates in the use of a rejection criteria to settle on an MD solution containing the most likely combination of materials to which the algorithm is calibrated. Calibration is highly sensitive to scan parameter changes as well as the sample materials and concentrations. Retroactive calibration and MD is possible, but requires a calibration phantom that contains multiple concentrations of the materials of interest, water, and lipid [22]. The heuristic approach to solving the underdetermined inverse problem divides the problem into multiple sub-problems, solves each sub-problem, and uses rejection criteria to select the “best” sub-solution. Two versions of the algorithm are described, including a linear least squares based bin segmentation [21]. Multivariate FDA methods (as developed in this paper) have been shown to be very similar to linear least squares method in both theory and practical application [27].
In this paper, aqueous formulations including iodine, tantalum or lanthanide nanomaterials were loaded in an acrylic phantom and scanned using the MARS spectral micro-CT. The energy thresholds were placed irrespective of the materials being imaged. Instead, the thresholds were determined by distributing the total detector counts evenly between each of the energy bins. Multivariate statistical methods were used to demonstrate the enhanced material separability achievable through the spectral expansion afforded by PCDs compared to univariate, energy-integrating detector. Furthermore, Fisher discriminant analysis (FDA) was used to further enhance the statistical separability of materials by maximizing the ratio of between-material and within-material scatter. The FDA models built in this paper reduced the spectral data to 3 dimensions defined by a set linear combinations (LC) of the raw spectral data. These models were then used to map the images into commonly used color spaces (RGB and L*a*b*) whose resulting color maps reflected the material separation achievable by FDA dimensionality reduction.
This paper is organized as follows: Section 2 provides the details regarding phantom preparation, image pre-processing, statistical analysis, and FDA. Section 3 contains the results of these analyses. A brief discussion and concluding remarks are found in Section 4.
Phantom preparation
530 μL suspensions of K-edge-material-containing nanoparticles (NP) in water were prepared at ∼27.0 mg NP/mL where 15% of the mass concentration of the NP is the high Z contrast component. Several lanthanide elements as well as tantalum were tested for contrast-enhancement relative to low-contrast materials (oil, water, and acrylic). Table 1 shows all of the nanoparticle formulations used in this study. Dispersion of the nanoparticle formulations was ensured by sonication. As comparisons, solutions of four different iodinated molecules (sodium diatrizoate (DiaNa), iohexol (iodinated formulation that is administered to patients orally for CT at 300 mg/mL), hydrophobic iodine (HydrophoI), and diatrizoic acid (DiaAcid)) were also made and tested at concentrations of 18.0 mgI/mL water, 30.0 mgI/mL water, 18.6 mgI/mL formamide, and 19.6 mgI/mL formamide (FA), respectively. Well-dispersed solutions/suspensions were loaded into threaded acrylic tubes such that air bubbles were minimized throughout the samples. The tubes were then arranged in a 50-mm diameter acrylic holder (Fig. 1). Each scanned phantom arrangement contained at least one sample holder containing oil, water, and air.
Iodine constructs and lanthanide dopants of NaYF4 nanoparticles tested as contrast.
Iodine constructs and lanthanide dopants of NaYF4 nanoparticles tested as contrast.
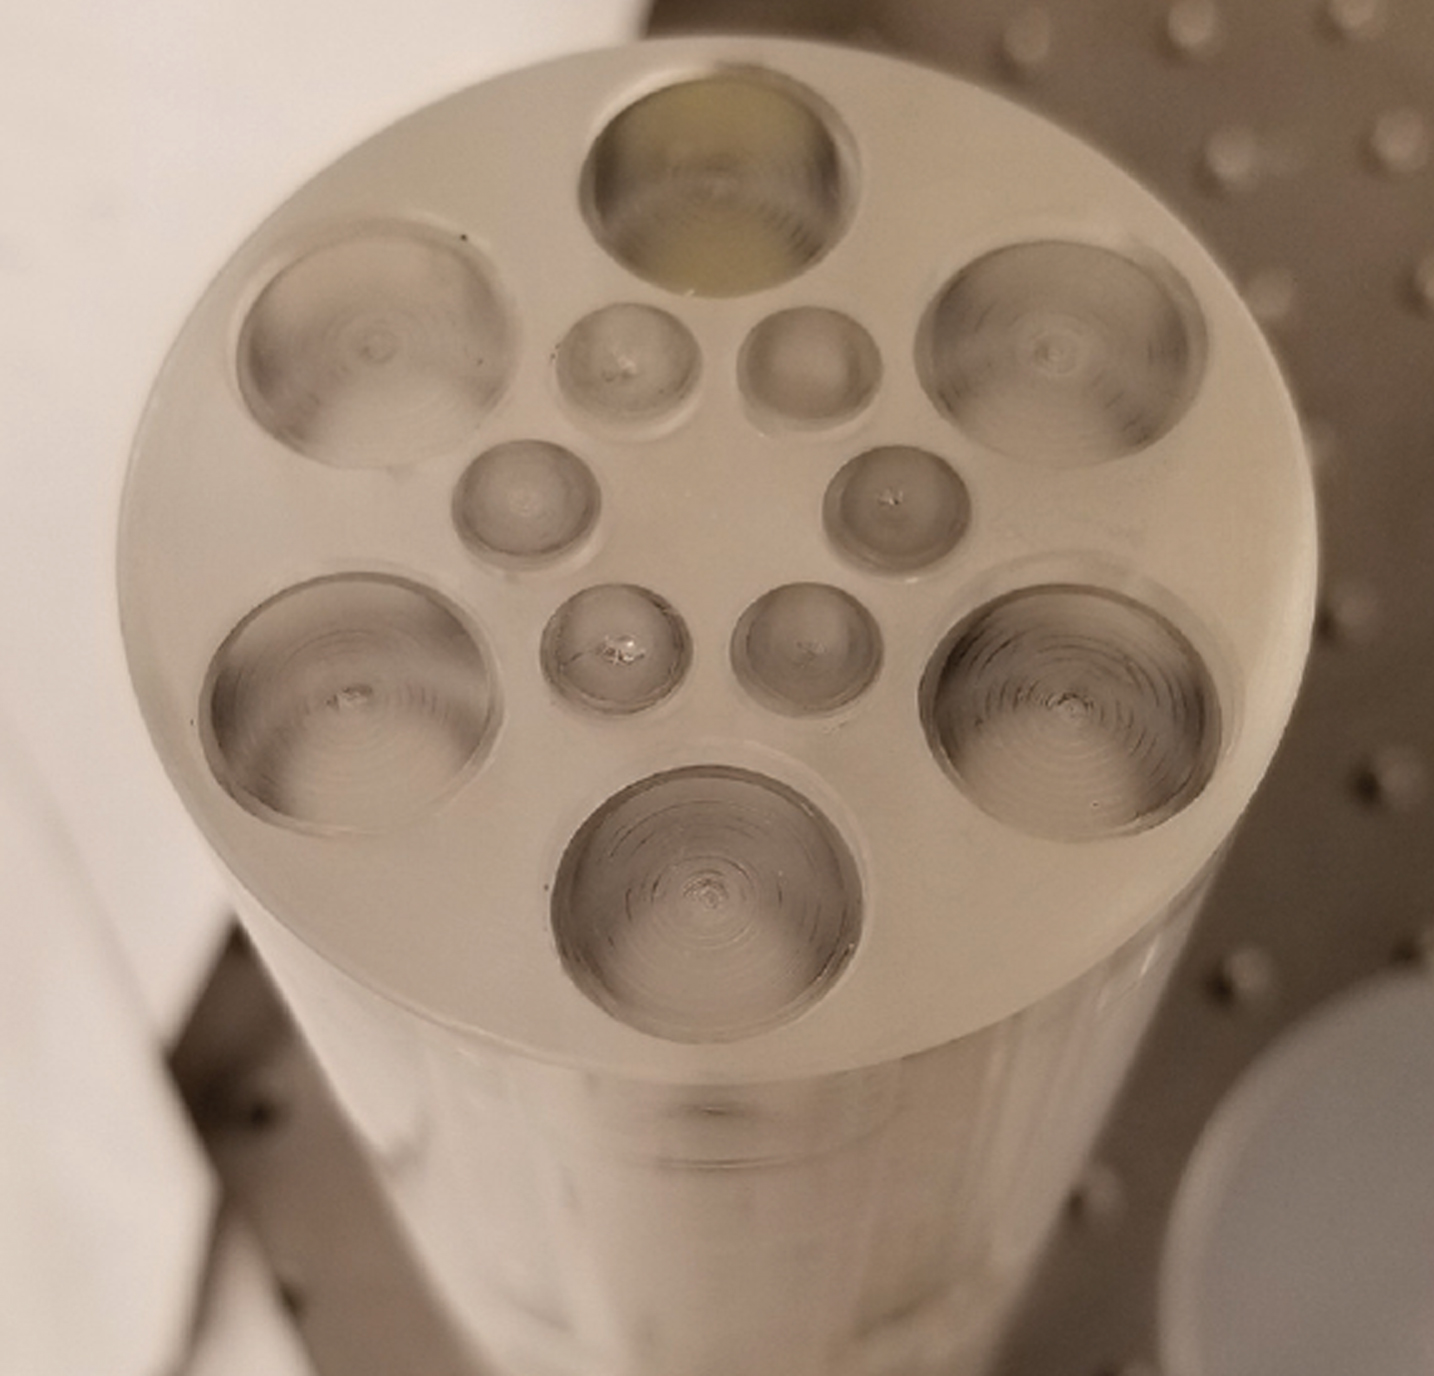
The 48-mm diameter acrylic phantom can hold up to 12 liquid mixtures. The larger diameter tubes hold ∼2 mL while the smaller tubes hold ∼500 μL.
The MARS spectral micro-CT scanner was used to acquire projection data and reconstruct the tomographic images. Table 2 contains the important imaging protocol and reconstruction parameters used in this study. Tube current was adjusted in order to maintain an open-beam count-rate of <10 counts/msec with an average of ∼2000 total counts per pixel per projection. The energy thresholds were determined during the protocol design such that the total open-beam counts were distributed equally between all 5 energy bins simultaneously for each projection. Fig. 2 shows the placement of the energy thresholds as well as the linear attenuation curves of the K-edge materials used in this study. The default scanner reconstruction is an iterative, algebraic (ART) cone-beam method - MARS v1.2 - which can take up to 2 hours to reconstruct a scan length of 10 mm [28, 29]. The results of the reconstruction include 5 energy binned volume sets where the voxel values are energy-window-specific linear attenuation coefficient (μ) approximations. Two other algebraic reconstruction algorithms are supplied with the MARS scanner, but further discussion of these algorithms are outside of the scope of this paper.
Imaging, energy binning, and reconstruction parameters.
Imaging, energy binning, and reconstruction parameters.
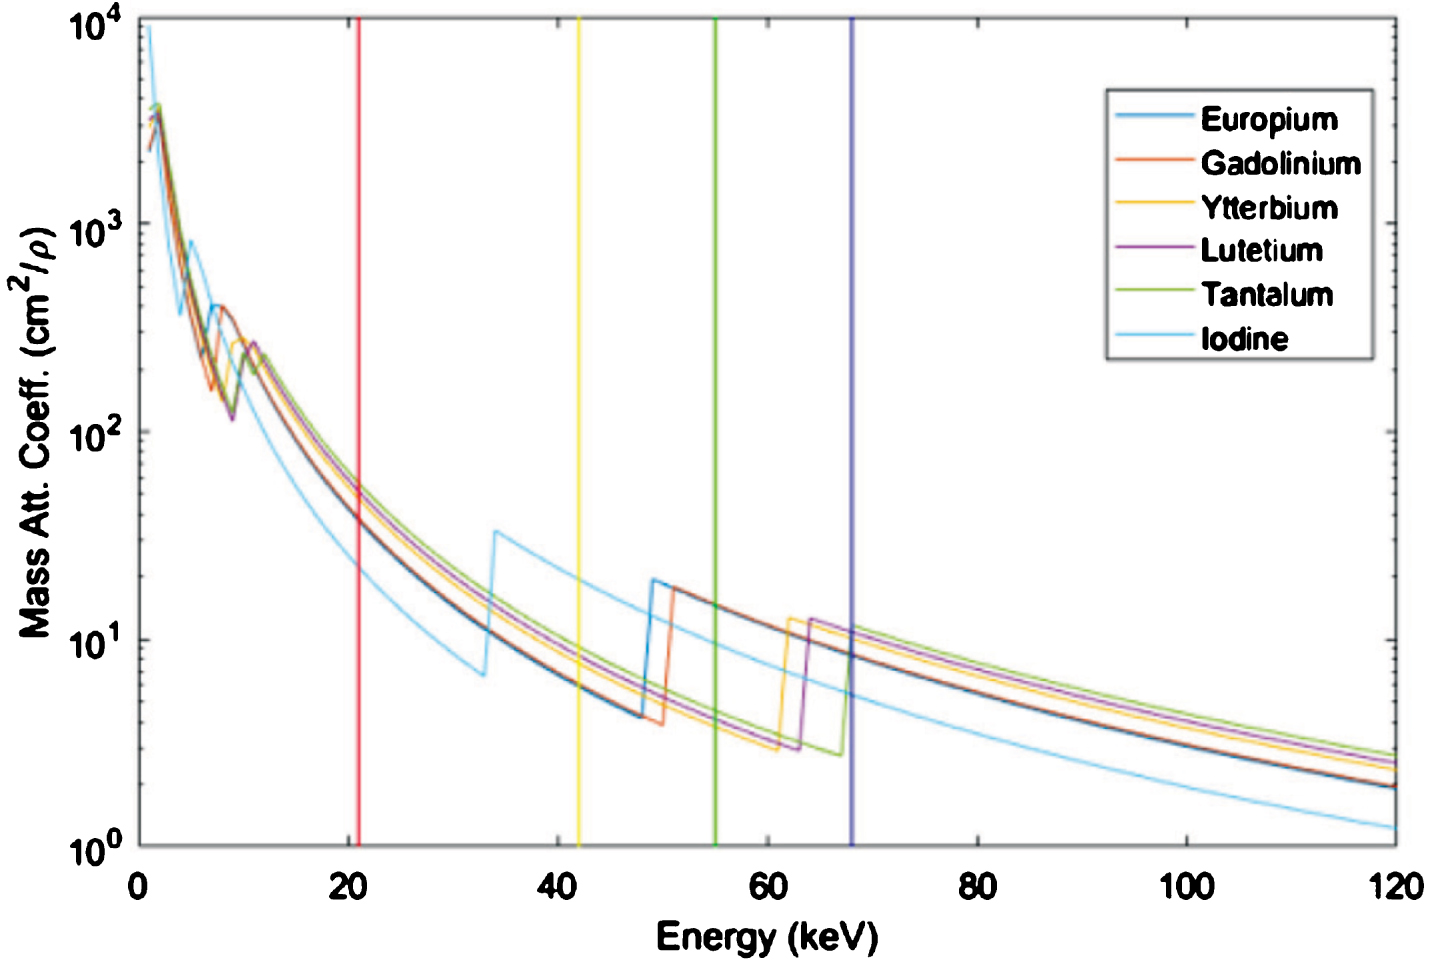
The mass attenuation coefficients for the contrast materials used in this study are shown in the context of the MARS spectral detector threshold placements. These thresholds were determined by distributing total detector counts across all bins equally.
After reconstruction was complete, images were analyzed using a pipeline in MATLAB which found and isolated the inner volumes of the 12 sample tubes. The method (description to follow) is one combination of the many possible computer vision and image segmentation methods that can be utilized to segment the 12 tube phantom. The relative success of the available methods is largely dependent on contrast-to-noise ratio (CNR) or other contrast metrics (T2) between the sample and the holder. As a major goal of this paper was to quantify the T2 metric between various sample materials, the task of the pipeline was to quickly and robustly identify the inner contents of all 12 sample holders so that further statistical analysis could be done on the extracted data.
First, the energy bin image volumes were collected into a 4D array whose first three dimensions were determined by the size of field of view (FOV) divided by the voxel size in x, y, and z, respectively. The fourth dimension corresponded to the number of energy bins. A semi-automatic segmentation was developed for material labelling needed to train the FDA models. Each energy bin volume was quantized (i.e. intensity values were revalued between 1 and 6) using Otsu’s multithreshold method. The sum of the quantized energy bin volumes, the result of which was a single 3D volume, was analyzed for circles (corresponding to the sample holders) on a z-slice-by-slice basis. Circles which were common between z-slices were considered to be sample holders. These steps alone were capable of consistently identifying 9 of the 12 sample holders, where the missing three corresponded to the large diameter samples containing water and oil (i.e. samples containing low contrast relative to acrylic holder). The arrangement of the samples containing air (which were easily identified by the algorithm) was a symmetric representation of these missing samples. Therefore, by reflecting the identified air samples across the axis of symmetry, all 12 sample holders could be identified and used to create a binary, volumetric mask. This mask was used to extract the multivariate data points for each material, which were arranged in an N × 6 matrix where N corresponds to the total number of data points in all samples. The first column of the data matrix contained a material class label (c i ) from 1 to 12 and columns 2 through 6 contained the voxel intensities from the images corresponding to energy bin 1 through energy bin 5, respectively.
Univariate analysis
In order to determine the utility of the inherent dimensionality expansion achieved by the photon-counting detector (PCD), the multivariate spectral data was first compressed to a univariate space to serve as the energy-integrating comparison. This was done by simply calculating the normalized mean across all bins for each data point. Quantification of contrast in univariate, conventional CT images is often done using metrics such as CNR; however, to our knowledge, no expansion of this contrast metric to multivariate spaces exists. Therefore, normalized sample intensity means were individually compared to one another using the square of the T test statistic as calculated by
After the univariate case was analyzed, the multivariate energy information, as given by the reconstructed energy bin data and the FDA determined LCs of the energy bin data, were analyzed and compared to the univariate results. The natural multivariate extension of the T2 test statistic is the Hotelling’s T2 test statistic. The multivariate expansion of Equations 1 and 2 are given as
Separability of the various samples were also analyzed after applying Fisher’s discriminant analysis (FDA) for dimension reduction. This method attempts to model the differences between these samples on the basis of a LC of the original variables in an MD data set. The l resulting linear discriminant functions used in the FDA models are determined by analyzing some known combination of segmented and normalized sample means as well as the between-sample, and within-sample correlation matrices of k samples, where k ≥ l + 1, as follows:
Equation 5 shows the linear mapping (
In the case of dimension reduction via FDA from 5 energy bins to 3 LCs of the energy bins, the natural corollary is to map the resulting LCs into one of the common 3-channel color spaces used in digital image processing. The most common of these color spaces is the RGB space, or true-color space, which models the color output of physical devices. Although the mapping of the LCs is straightforward, 6 (3!) different color-mapping combinations are possible from each FDA model. Each colormap may have its own advantages or disadvantages in terms of how a human perceives the information available in the resulting images. Alternative 3-channel color spaces exist, including the L*a*b* space, which is meant to model human visual perception. Again, 6 different L*a*b* combinations of can be made from a single FDA output. In addition to calculating and quantifying the total significant T2 statistics after applying the FDA models, the “best” models were mapped, both in RGB and L*a*b* color spaces, to allow for qualitative analysis of perceivable differences in image quality and sample discernibility. A subset of these mapping results which demonstrated notable qualitative features are reported.
Results
Iodine contrast
The univariate data set was meant to emulate the type of information available to algorithms and humans making decisions using conventional, energy-integrating detectors. High concentrations of common iodinated contrast agents were scanned as a measure of comparison for the later scans containing aqueous mixtures of lanthanide nanomaterials. Figure 3 shows an example slice from the image volume whose voxel intensities are the normalized mean for that voxel across all 5 energy bins. Each of the iodinated samples is statistically different from the low-contrast samples (water, oil, and formamide) as seen by the robust T2 statistics calculated for these comparisons (T2 ⪢50). However, it should be noted that differences between the low-contrast samples are much less pronounced, which resulted in several qualitatively “different” samples that were not statistically different when compared directly (e.g. water vs oil). Similarly, iohexol subjectively has much higher signal than the other iodinated samples due to its relatively higher concentration; however, the T2 statistic (∼15 in all iodine comparisons) falls just below the adjusted 95% confidence threshold (∼16). The maximum SNR in the univariate image is given as 18.25 dB and corresponds to the iohexolsample.

The pairwise comparison results for iodine samples demonstrate how strong the contrast between iodine-based molecules at the concentrations used and low-contrast solutions as the values of the significant T2 test statistics have values as high as 180. None of the contrast materials can be distinguished from any of the other contrast materials (HB-adjusted α* = 0.0126, α** = 0.0014).
Given that the univariate analysis alone allows for differentiation between the iodinated and low-contrast samples, it should be expected that little enhancement of these differences can be gained from the dimensionality expansion provided by the photon-counting spectral detector. Figure 4 shows the same volume slice shown in Fig. 3 for each of the 5 energy bin reconstructed images as well as the quantitative effect of the dimension expansion (T2 comparison grid). Just as in the univariate (energy-integrating) analysis, each of the iodinated samples is readily distinguishable from the low-contrast samples, however this time with even more robust T2 statistics (⪢125). Again, very little statistically distinguishes these iodinated samples from each other, despite the qualitative evidence to the contrary. The spectral expansion does, however, allow for better separation of two of the low-contrast samples, water and oil, whose comparisons are seen to give a significant T2 statistic in each of the available comparisons. Formamide, on the other hand, was significantly different from oil in the univariate case, but is no longer statistically distinguishable from oil after the spectral expansion, as its T2 statistic falls just short of the α* threshold. The highest SNR is reported for each energy bin image and these values each correspond to the signal seen in the iohexol samplevolume.
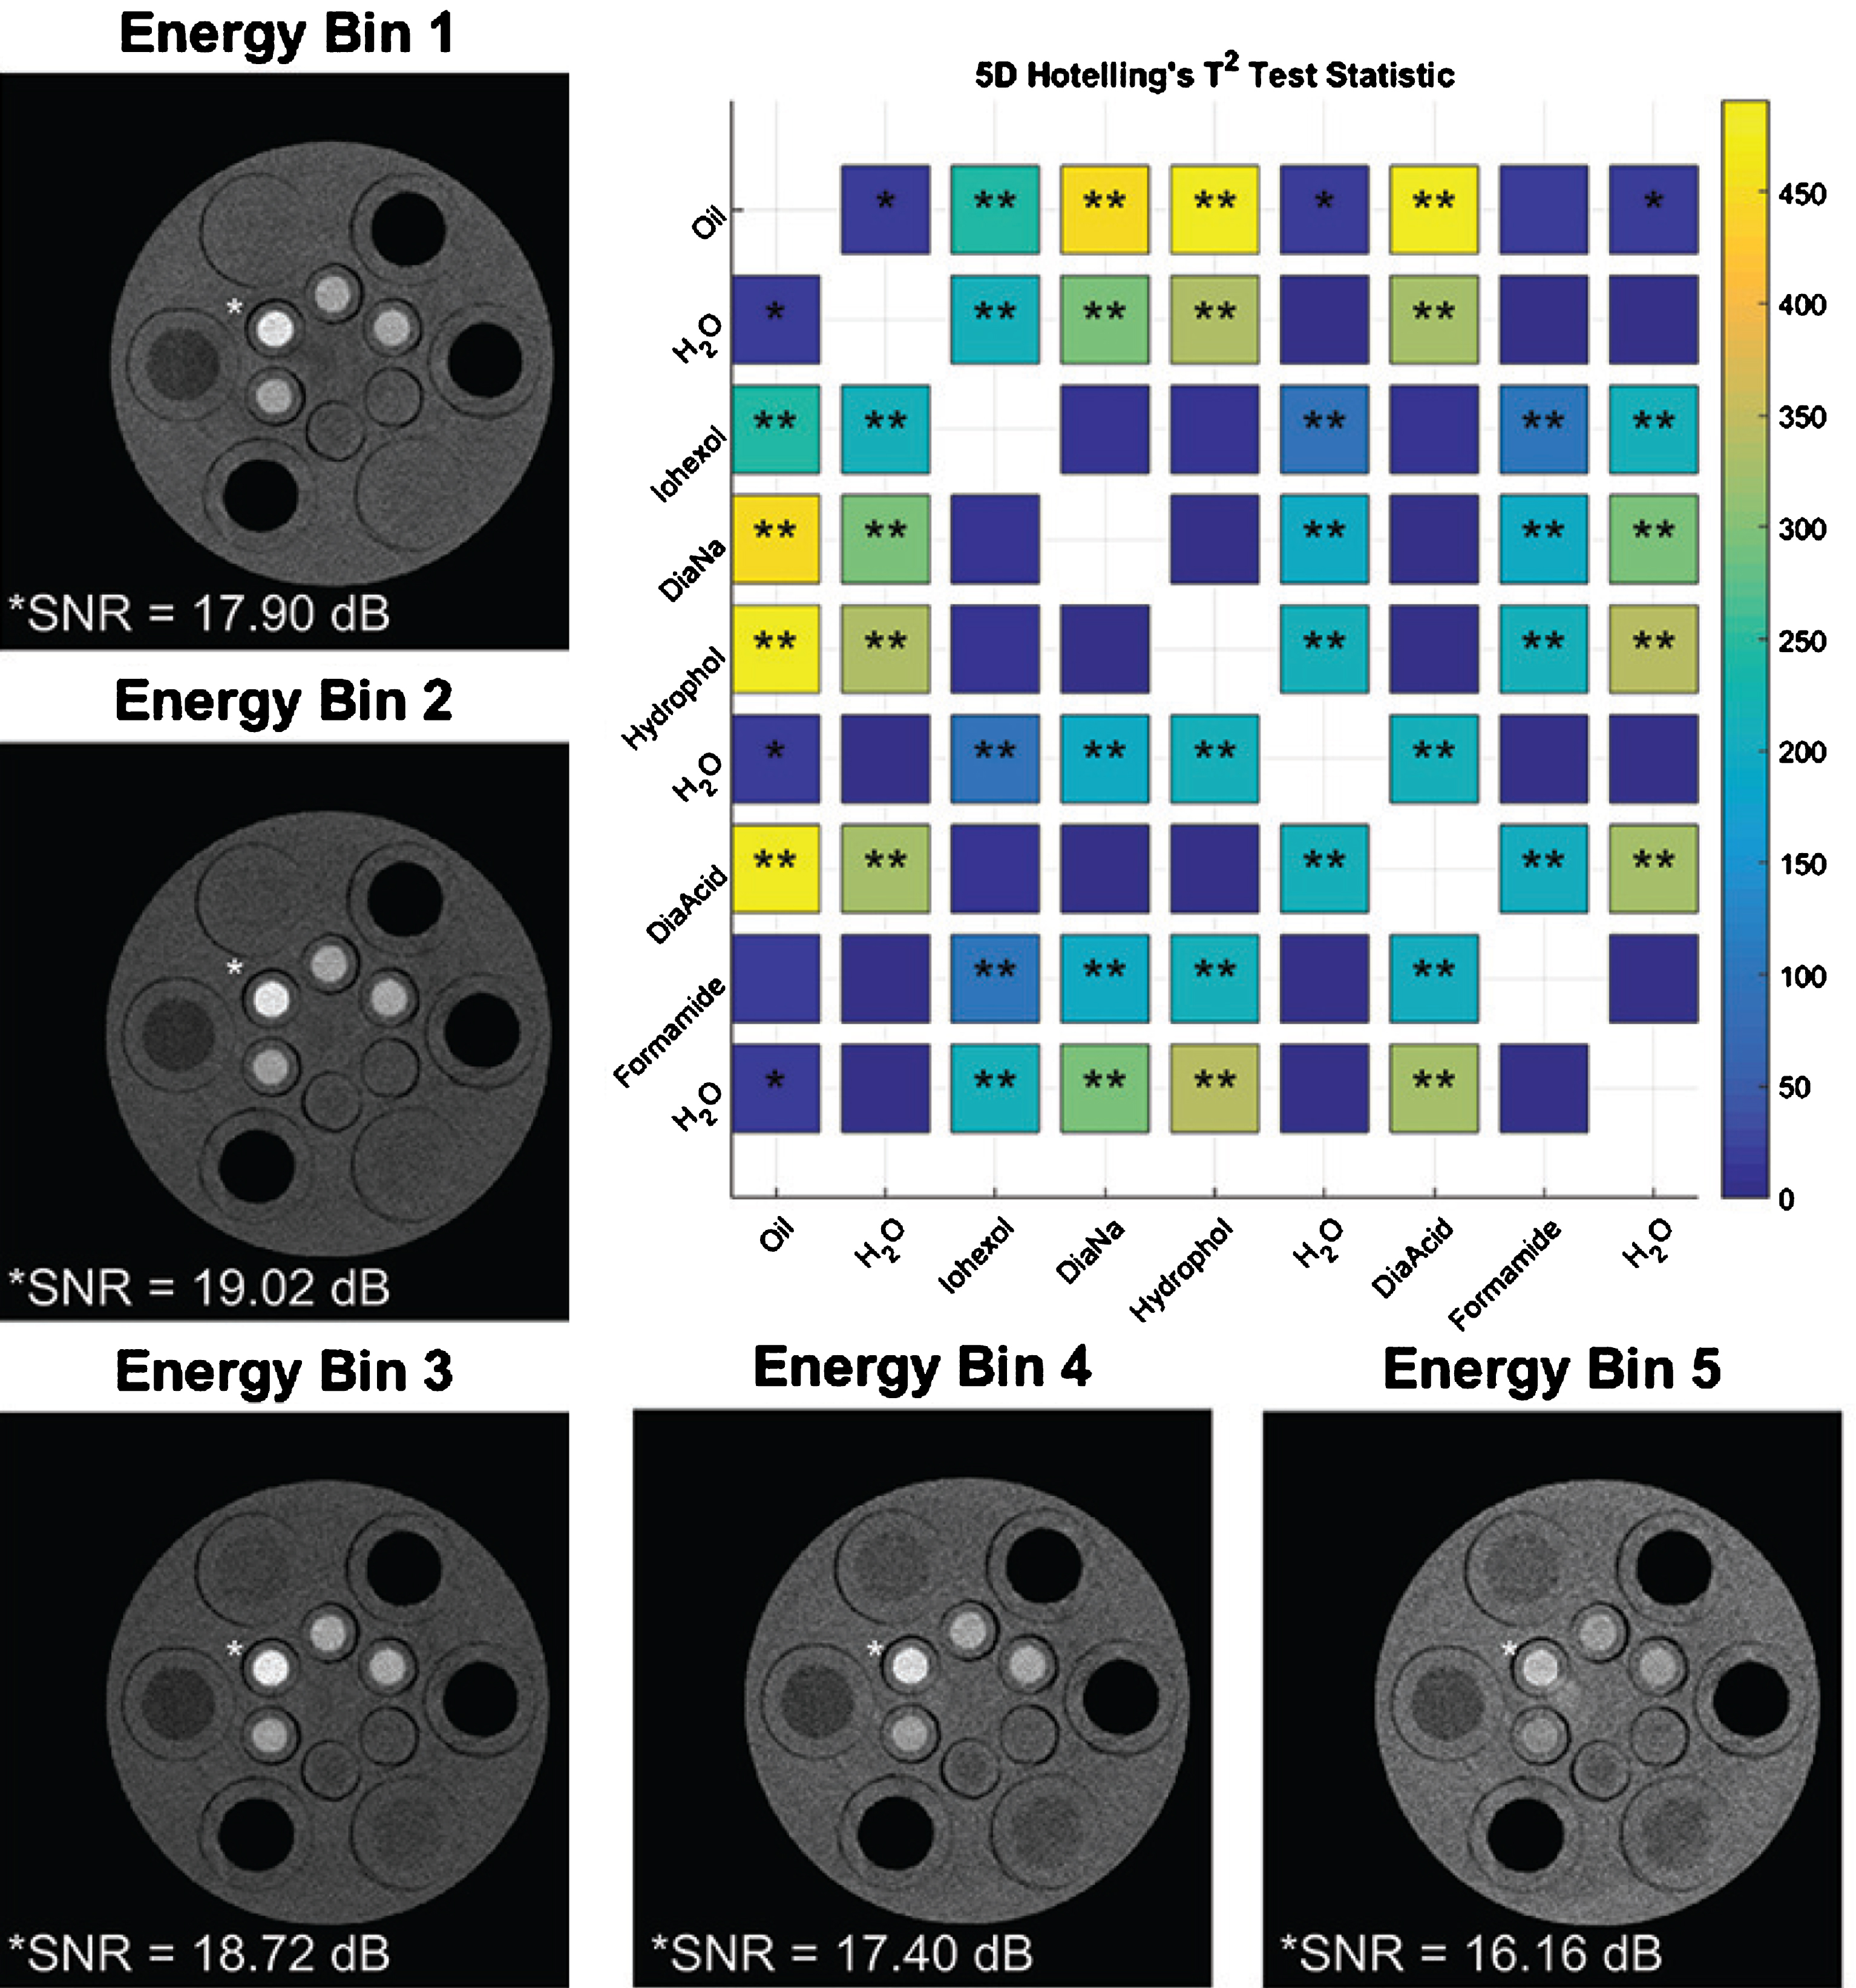
The pairwise comparison results for the iodine samples with 5 energy bins look very similar to the conventional comparison results. The only change in the significance of the pair-wise comparisons is in the ability to differentiate water from oil, although formamide can no longer be discerned from oil (HB-adjusted α* = 0.0038, α** = 0.0013). It should be noted, however, that the significant T2 statistics are now as high as 450, nearly 3X greater than in the univariate comparison.
The nanoparticle formulations comprising of single lanthanide (and tantalum) elements were then tested as contrast (second column of Table 1). The images and models from these scans are labeled as pLn which stands for “pure lanthanide”. The univariate data set was again formulated by averaging the pixel intensities across all 5 energy bins. Figure 5 shows results from the univariate T2 statistics calculated between each sample group. Evidently, oil can be more easily discriminated from the contrast-containing samples than can water. However, oil cannot be distinguished from water. Ta and Eu based contrast agents are the only (of the five tested) in this image set that can be discriminated from water (T2 ∼ 16, while all of the other (Gd, Yb, and Lu) have test statistics too low to reject the null hypothesis that their means are equal to that of water. Additionally, none of the contrast materials can be discriminated from one another. The maximum SNR found in this image is 3.015 dB and it corresponds to the Eu-based nanomaterial.

The pairwise comparison results for the pLn NP samples show that despite the contrast materials ability to be distinguished from oil, they cannot (with the exception of Ta and Eu) be distinguished from water. In this image, the significant T2 statistics have values as high as 40. This reflects the difficulty of telling many of these materials apart from one another (even qualitativley). None of the contrast materials can be distinguished from any of the other contrast materials (HB-adjusted α* = 0.0016, α** = 0.00044).
Despite the inability of the univariate (energy-integrating) data to detect contrast from most of pLn nanomaterials at 27.0 mg NP/mL, Figure 6 demonstrates how the dimension expansion from the PCD greatly enhances not only the ability to distinguish contrast materials from water, but also the ability to distinguish contrast materials from each other. As seen in the pairwise comparisons, Eu-based materials are easily separable from Yb-, Lu-, and Ta-based materials (T2 ∼ 40. Similarly, Ta-based materials can be easily distinguished from Gd- and Eu-based materials. Furthermore, the Gd-based particles show increased separability from water compared to the univariate data set (T2 ∼ 25). The maximum SNR found in each energy bin image corresponds to the Eu-based contrast, yet it is degraded compared to the SNRs measured in the iodinated images.

The pairwise comparison results for all samples show much greater separability can be achieved between the Ta- and Eu- nanoparticles and water. Additionally, several of the nanoparticles can even be distinguished from one another (HB-adjusted α* = 0.0049, α** = 0.00048). The significant T2 values are as high as 80, which is 2X greater than in the univariate comparison.
Several nanoparticle formulations also used mixed lanthanide (mLn) formulations as outlined in the third column of Table 1. Figure 7 shows the layout of these samples in the phantom as well as the pairwise comparisons for each of the samples as measured by energy-integrating detectors. Mixed lanthanide (mLn) NPs do not demonstrate very strong contrast at 27.0 mg NP/mL when compared to low contrast materials such as water (T2 ⪡ 10). As a group, they are shown to have different contrast than oil with some consistency (T2 ∼ 14), however the Yb/Lu dopants do not show significant contrast when compared to oil. The highest SNR is reported at 15.11 dB, which corresponds to the signal from the Gd/Lu sample.

The pairwise comparison results for all mLn NPs suggest that none of the materials could be used as contrast at concentrations even as high as 27 mg NP/mL in an energy-integrating system (HB-adjusted α* = 0.011, α** = 0.00054). The T2 values for these samples hover well below 10.
In the spectral expansion image, a few of the mLn NP formulations are more readily discernible from the low contrast materials. Figure 8 shows the results from the multivariate analysis of the raw spectral data. While the strongest contrast comes from Gd/Eu mixture (T2 ∼ 28), the mLn materials, in general, do not seem to be as strong of attenuators as the pLn NPs, as indicated by their respective T2 statistics when compared with water. The inability to discriminate these materials is in spite of restored SNRs ∼15 dB which are comparable to the SNR levels seen in the iodinated images. All the maximum SNRs correspond to the Gd/Lu sample with the exception of energy bin 1 whose maximum SNR corresponds to the Yb/Er sample.

The pairwise comparison results for the mLn NPs with 5 energy bins suggest that a few of the formulations, namely Gd/Eu, can be distinguished from the other low-contrast materials. (HB-adjusted α* = 0.0025 and α** = 0.0011). Its T2 value when compared to one of the water samples was 30.
The pairwise T2 analyses performed for both the univariate and multivariate image sets demonstrate the raw power of dimension expansion attributable to the photon-counting detector. However, there are several multivariate methods available for refining the separation of sample data. One relatively simple example is Fisher’s discriminant analysis (FDA). The purpose of this analysis is to reduce data redundancy between the measured variables, in this case - binned X-ray attenuation calculated according to energy threshold placements at the detector level - while simultaneously maximizing the separation between the samples used to develop the model. FDA is also a form of dimension reduction whose resulting model subspace has dimension l which, according to its governing equations (10)-(12), is equal to the rank of S B as determined by the l + 1 samples used to make the model.
Supposing (1) that a data reduction from 5 energy bins to 3 LCs is optimal for the purposes of data visualization (RGB or L*a*b* color-mapping of the images) and (2) that the current phantom arrangements contain nine samples of interest (1 air, 2 water, 1 oil, and 5 contrast samples), 126 combinations of 4 different samples are available per phantom to build an FDA model for further contrast discrimination. All 126 possible combinations were analyzed to determine the combination(s) which built the highest performing FDA models as assessed by the total number of significant T2 statistics. Figures 9 and 10 compare the FDA models for all combinations of samples in both the pure and mixed lanthanide phantoms, respectively. As was shown in the raw spectral comparisons, more pLn NPs show significant levels of contrast relative to the low-contrast materials as well as to the other contrast-enhancing materials. The FDA models of interest are those which have the maximum number of T2 scores that are significant (>α*, α**). Table 3 shows the combinations of FDA training materials which provided sequentially improved models compared to prior, according to the number significant T2 scores. Results from combinations 1, 2, 7, and 8 are used for color-mapping and visualization.
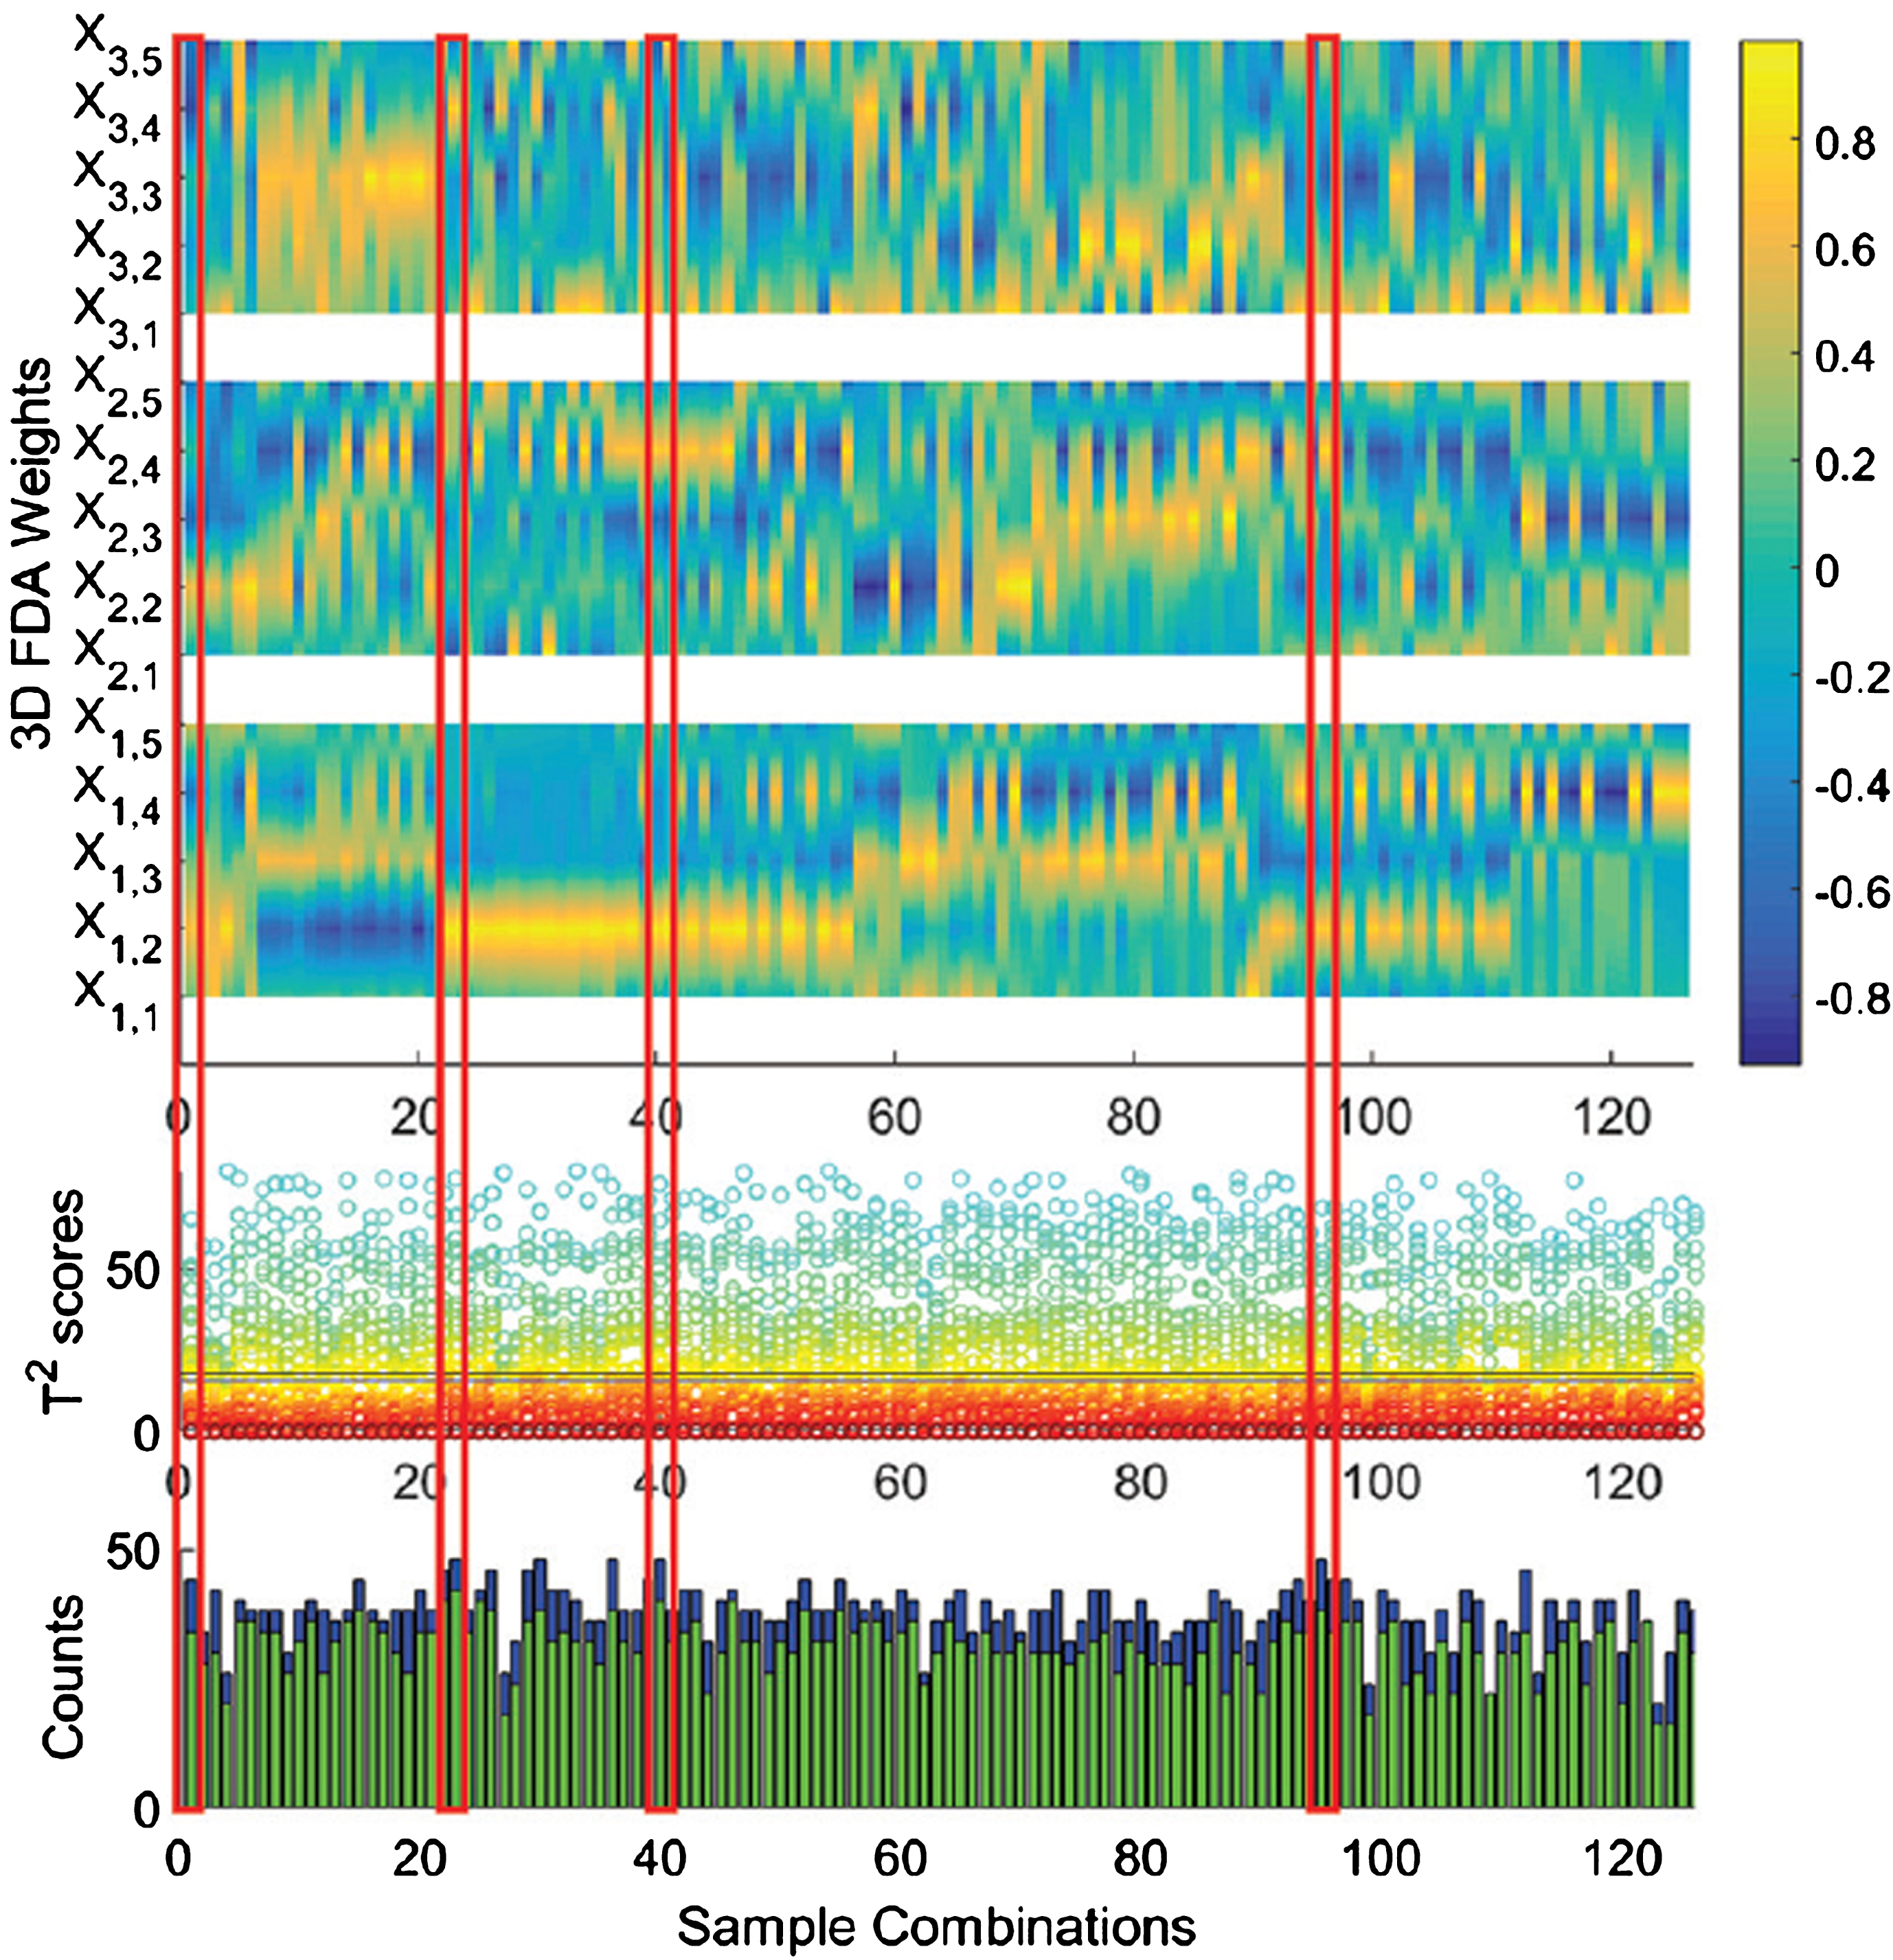
The top row shows the weights for all of the 126 four-sample combinations for the pLn phantom which were used to calculate 3 LC FDA models. The middle row shows a scatter plot of T2 scores for each combination as well as the α* and α** values which shown as blue and green horizontal lines, respectively. The bottom row the total number of significant T2 statistics as compared to α* and α** values.

The top row shows the weights for all of the 126 four-sample combinations for the mLn phantom which were used to calculate 3 LC FDA models. The middle row shows a scatter plot of T2 scores for each combination as well as the α* and α** values which are shown as blue and green horizontal lines, respectively. The bottom row the total number of significant T2 statistics as compared to α* and α** values.
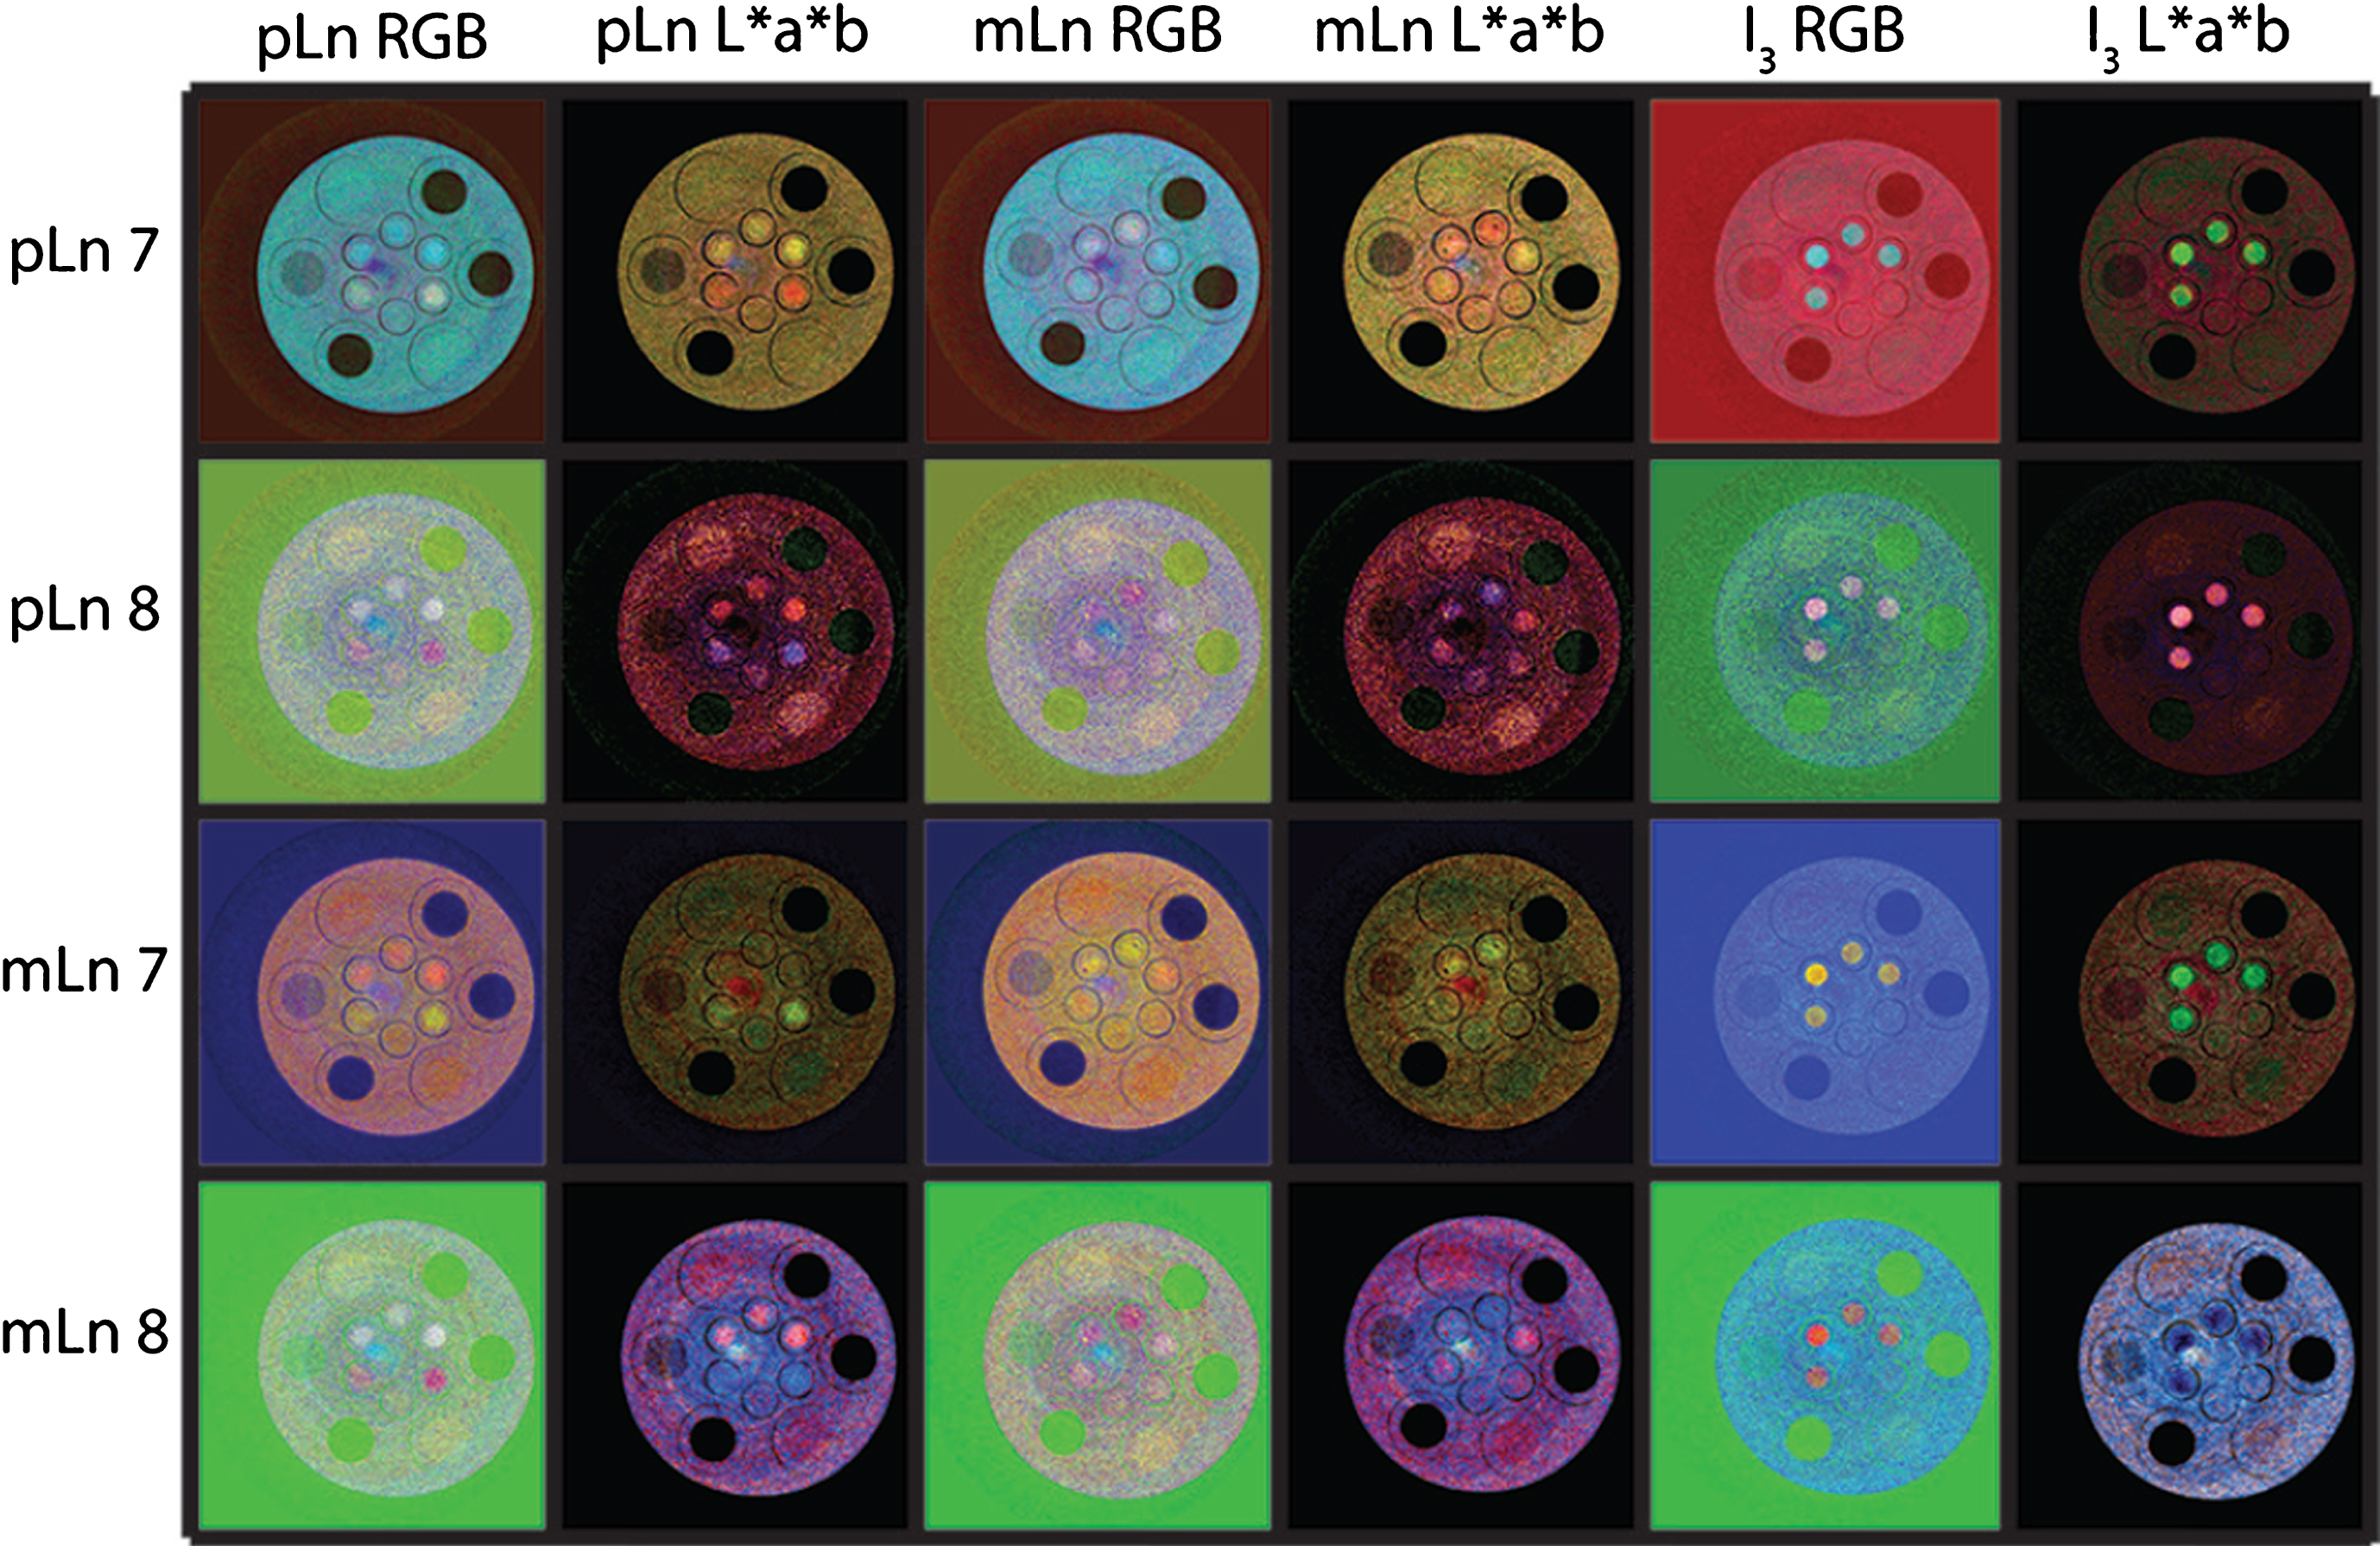
Figures 11 and 12 show example slices from each of the phantom arrangements after mapping via 8 different 3 LC FDA models from 2 different scans (4 from each). Each result is displayed as a single RGB and a single L*a*b* color space image. The color combination chosen for display was the qualitative “best” image – showing the best contrast between those samples whose T2 values supported their being different colors. Several aspects of these color representations of the spectral data are of note.
Several of the images show distinct ring artifacts which are especially present toward the center of the images (not necessarily the center of the phantom). In fact, the center artifacts (bright blue in pLn/mLn 8 combinations) are likely a result of a slight geometric miscalibration and are more apparent in the high energy bin images. Several of the images show a proclivity for exposing the Gd and Eu containing contrasts. Gd and Eu show up as similar colors in nearly all of the images. This is reflected by the lack of differentiation shown in the 5 bin spectral data. Furthermore, K-edge theory and the “equal-counts” threshold placement support this inseparability (see Fig. 2). Several of the images also show a proclivity for exposing Ta, Yb, and Lu. These, too, present themselves as similar colors although a different color than Gd and Eu. Again, this grouping is both reflected by our statistical analyses as well as theory. Interestingly, the color of these were often slight increases in water’s intensity/color saturation. Although the training materials from the two image sets used to build the FDA models are different, their results were often very similar (e.g. pLn1 vs mLn1, pLn2 vs mLn2, & pLn8 vs mLn8). This shows both that the models presented are not subject to over-fitting and that these may be used as robust classifiers in future MD problems. The oil sample is consistently darker than both the acrylic phantom and the water samples. However, areas of both the water and acrylic show strong effects of noise. This is especially true in the FDA models which do not train on water or oil. It should be noted that training for water was done with one of the three available water samples in the phantom and the ability to discern some of the Ta/Yb/Lu samples was often affected by which water sample was used in the training of the FDA model. When applied to the phantom containing iodine, the models - trained by both pLn and mLn samples - continue to allow for iodine discrimination. However, the disparity in relative contrast between the 18-30 mg/mL iodine samples and the 27 mg/mL pLn and mLn samples results in large shifts in the dynamic ranges utilized by the reconstructed images. This can be seen by the “dimming” of the low-contrast signal relative to the iodine samples in several of the reported color space images.
Sample combinations for FDA models.
Sample combinations for FDA models.
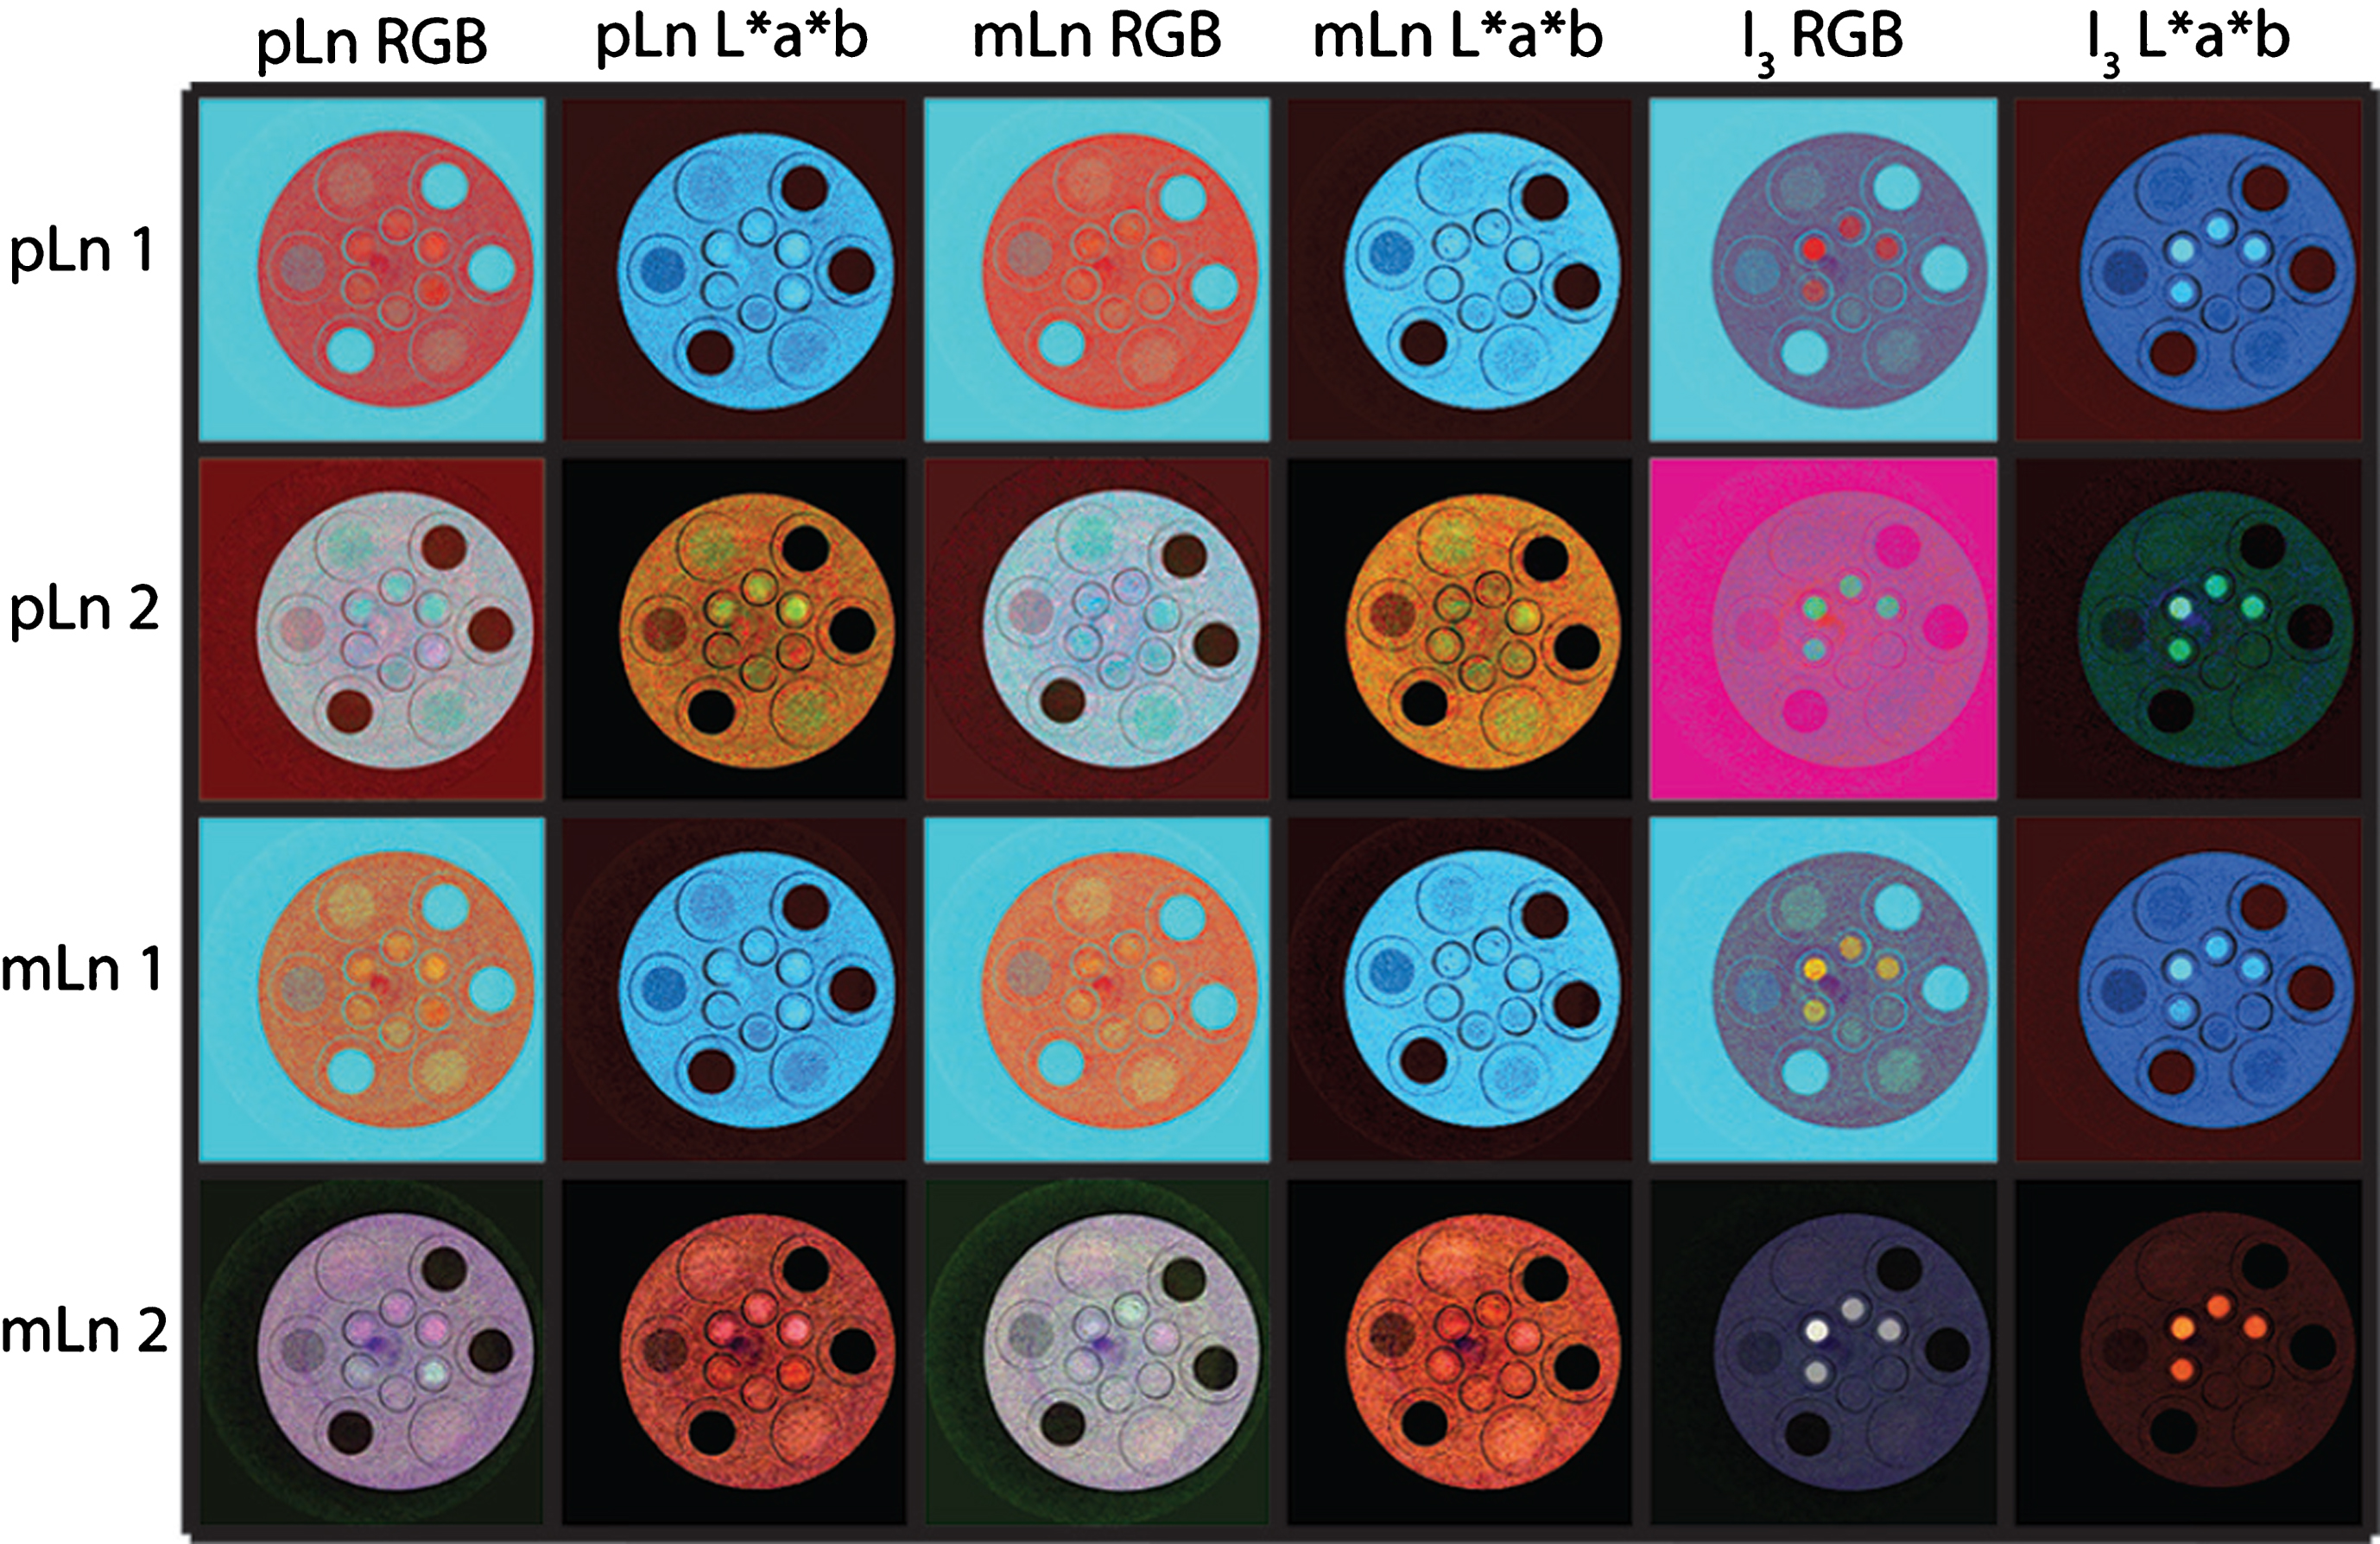
FDA models mapped into multiple color spaces demonstrate the combination-dependence of the 3D FDA models that can be used to separate different contrast materials based on the color representation of the data.
In this paper, the material-discriminatory ability achieved through PCDs is evaluated. Several phantoms which included various arrangements of iodinated-contrast as well as tantalum and lanthanide nanomaterials were scanned. The full power of the PCD-based material discrimination can be seen in images of low contrast as well as in phantoms containing multiple materials. Alone, the multivariate spectral data demonstrate larger numbers of statistically different contrast distributions between material volumes as calculated by T2 test statistics. Furthermore, FDA models built with various four-material combinations were shown to be effective for data visualization and color-mapping which reflected the material differences measured by the 5 energy bins. These models were also shown to be robust by mapping image data not used to build the models. Despite these results, the separability achieved by the FDA models are highly dependent on the materials used to build the model. For this reason, all possible combinations were analyzed.
This paper also demonstrates how the inherent K-edge information of materials is utilized in material separability. As seen in Fig. 2, Gd and Eu have K-edges which happen to fall in the 3rd energy bin while Yb, Lu, and Ta’s K-edges occur near the threshold dividing the 4th and 5th energy bins. This natural K-edge grouping is reflected in all aspects of the data shown here, i.e. both statistical separation and color representations demonstrate differences between (and not within) these two groups of materials. It should be noted that the FDA methods described in this paper have been shown to be very similar [27] to the MD methods that come equipped on the MARS micro-CT scanner which are based on linear least squares. These methods were disclosed as recently as February of this year [21, 22]. Future work will focus on developing algorithms for optimizing bin threshold placement for a given set of materials using complex multivariate statistical and machine learningtechniques.
FDA models mapped into multiple color spaces demonstrate the combination-dependence of the 3D FDA models that can be used to further separate different contrast materials.
In conclusion, material separability measures are significantly enhanced in PCD-based spectral imaging relative to energy-integrating detector-based imaging. Furthermore, material-based FDA models can be used to produce robust LC models. These models can then be mapped into commonly used color spaces to achieve qualitative images which reflect the quantitative measures. Lastly, this work consolidates the groundwork for further exploration and development of novel contrast materials as well as molecular CT through targeted contrast.
Footnotes
Acknowledgments
This work was partially supported by the Ministry of Science and Innovation (New Zealand), NIH/NIBIB (U01 EB017140, R01 EB016977), and the Clark & Crossan Endowment fund from Rensselaer Polytechnic Institute. The funders had no role in study design, data collection and analysis, decision to publish, or preparation of the manuscript.