
Abstract
There are several factors that may contribute to the increase in radiation dose of CT including the use of unoptimized protocols and improper scanning technique. In this study, we aim to determine significant impact on radiation dose as a result of mis-centering during CT head examination. The scanning was performed by using Toshiba Aquilion 64 slices multi-detector CT (MDCT) scanner and dose were measured by using calibrated ionization chamber. Two scanning protocols of routine CT head; 120 kVp/ 180 mAs and 100 kVp/ 142 mAs were used represent standard and low dose, respectively. As reference measurement, the dose was first measured on standard cylindrical polymethyl methacrylate (PMMA) phantom that positioned at 104 cm from the floor (reference isocenter). The positions then were varied to simulate mis-centering by 5 cm from isocenter, superiorly and inferiorly at 109 cm, 114 cm, 119 cm, 124 cm and 99 cm, 94 cm, 89 cm, 84 cm, respectively. Scanning parameter and dose information from the console were recorded for the radiation effective dose (E) measurement. The highest mean CTDIvol value for MCS and MCI were 105.06 mGy (at +10 cm) and 105.51 mGy (at – 10 cm), respectively which differed significantly (p < 0.05) as compared to the isocenter. There were large significant different (p < 0.05) of mean Dose Length Product (DLP) recorded between isocenter to the MCS (85.8 mGy.cm) and MCI (93.1 mGy.cm). As the low dose protocol implemented, the volume CTDI (CTDIvol) were significantly increase (p < 0.05) for MCS (at +10 cm) and MCI (at – 10 cm) when compared to the isocenter. The phantom study revealed a noticeable different in radiation dose between isocenter and experimental groups due to degradation of the bowtie filter performance. It is anticipated that these noteworthy findings may emphasize the importance of accurate patient centering at the isocenter of CT gantry, so that CT optimization practice can be achieved.
Introduction
Computer tomography (CT) scan is considered as the most preferred imaging modality for clinical diagnosis due to its ability to produce sectional images and affluence the observer to identify the accurate location of lesions. The advancement in CT technology offers improvement in the delineation of the low contrast structures such as soft tissues inside brain. Consequently, CT has been replacing most of the invasive diagnostic procedures such as fluoroscopy and angiography. CT head procedure able to provide detailed images of the head region including the skull, brain, paranasal sinus, ventricles, and eye sockets. It considered as a gold standard for the detection of intracranial abnormalities and widely used for the neurological monitoring of head trauma [1]. CT head contribute 66% of the radiology department workload and 41.7% from that were requested for CT head trauma examination [2].
Despite its advantages, CT is one of the most hazardous imaging modality as it contributes greater dose exposure when compared to other imaging modalities [3]. Therefore, any factors that may contribute increment in radiation dose must be taken seriously to avoid the patient from receiving unnecessary radiation dose [4]. Among other factor, miscentering during the procedure is an important factor that increases patient surface dose. A study reported that 95% of patients undergoing CT chest-abdomen-pelvis examination were miscentered either superiorly or inferiorly from the isocenter [5]. Another study which focus on various commercial CT scanners, discovers that approximately 85% and 15% of the patient underwent CT abdomen examination were found miscentered above and below the isocenter, respectively [5, 6]. The occurrence of miscentering causing this situation to be more harmful, where it might adding unnecessary radiation dose to the patient. Furthermore, the evaluation of radiation dose on miscentering CT head should be carried out as it irradiates vital organs that sensitive to ionizing radiation including the brain tissues and eyeballs.
A phantom study reported that radiation dose was increased by 38% when the table height is set to – 6 cm vertical miscentering from the isocenter [7]. In correlation with CT head procedure, it is necessary to properly assess and monitor the position of the patient undergoing CT examination since most of them will receive repeated scanning in order to evaluate the progression of abnormalities. The repeated CT examination due to technical error may directly increase the amount of radiation dose received by the patient [8]. Therefore, the aim of the study was to investigate and evaluate the effects of miscentering on radiation doses during CT head examinations.
Materials and methods
The scanner utilized in this study was a 64-slice MDCT scanner (Toshiba Aquilion; Toshiba Medical Systems, Japan). This 3rd generation CT model has an aperture of 72 cm where the distance from middle point to the inner surface of the gantry is 36 cm. The table height was measured, and the middle point of the gantry was set as isocenter. The detectors composed of 896 elements and 1 reference element arranged in a single row. Its maximum helical scan coverage is 1950 mm using a 1 mm imaged slice thickness with pitch factor of 1.5.
Experimental setup
In an attempt to evaluate the influence of miscentering on patient dose, the standardized subjects were positioned on the CT table and radiation dose were measured directly. This standardized cylindrical phantoms were scanned using previously described CT scanning protocols and was placed at different table heights. A CTDI head phantom was used specifically for dose characterization whereas CT water phantom was used for the assessment of image quality. The manipulation of table height was following method described by the previous study by Filev et al. with a simple modification since the size of both phantoms was smaller than the body phantoms [6]. For the reference position (isocenter), the table height was set at 104 cm from the floor (Fig. 1). The positions then were varied to simulate mis-centering by 5 cm from isocenter, where the table heights were set at 109 cm, 114 cm, 119 cm, and 124 cm and 84 cm, 89 cm, 94 cm, and 99 cm for representing miscentering superiorly (MCS) and miscentering inferiorly (MCI) groups, respectively. Helical scanning was performed for each phantom’s position using adult (120 kVp tube voltage, 180 mA tube current) and low dose protocols (100 kVp tube voltage and 142 mA tube current) as recommended by the manufacturer.
The phantom was positioned at the gantry isocenter with 36 cm radius from the inner surface.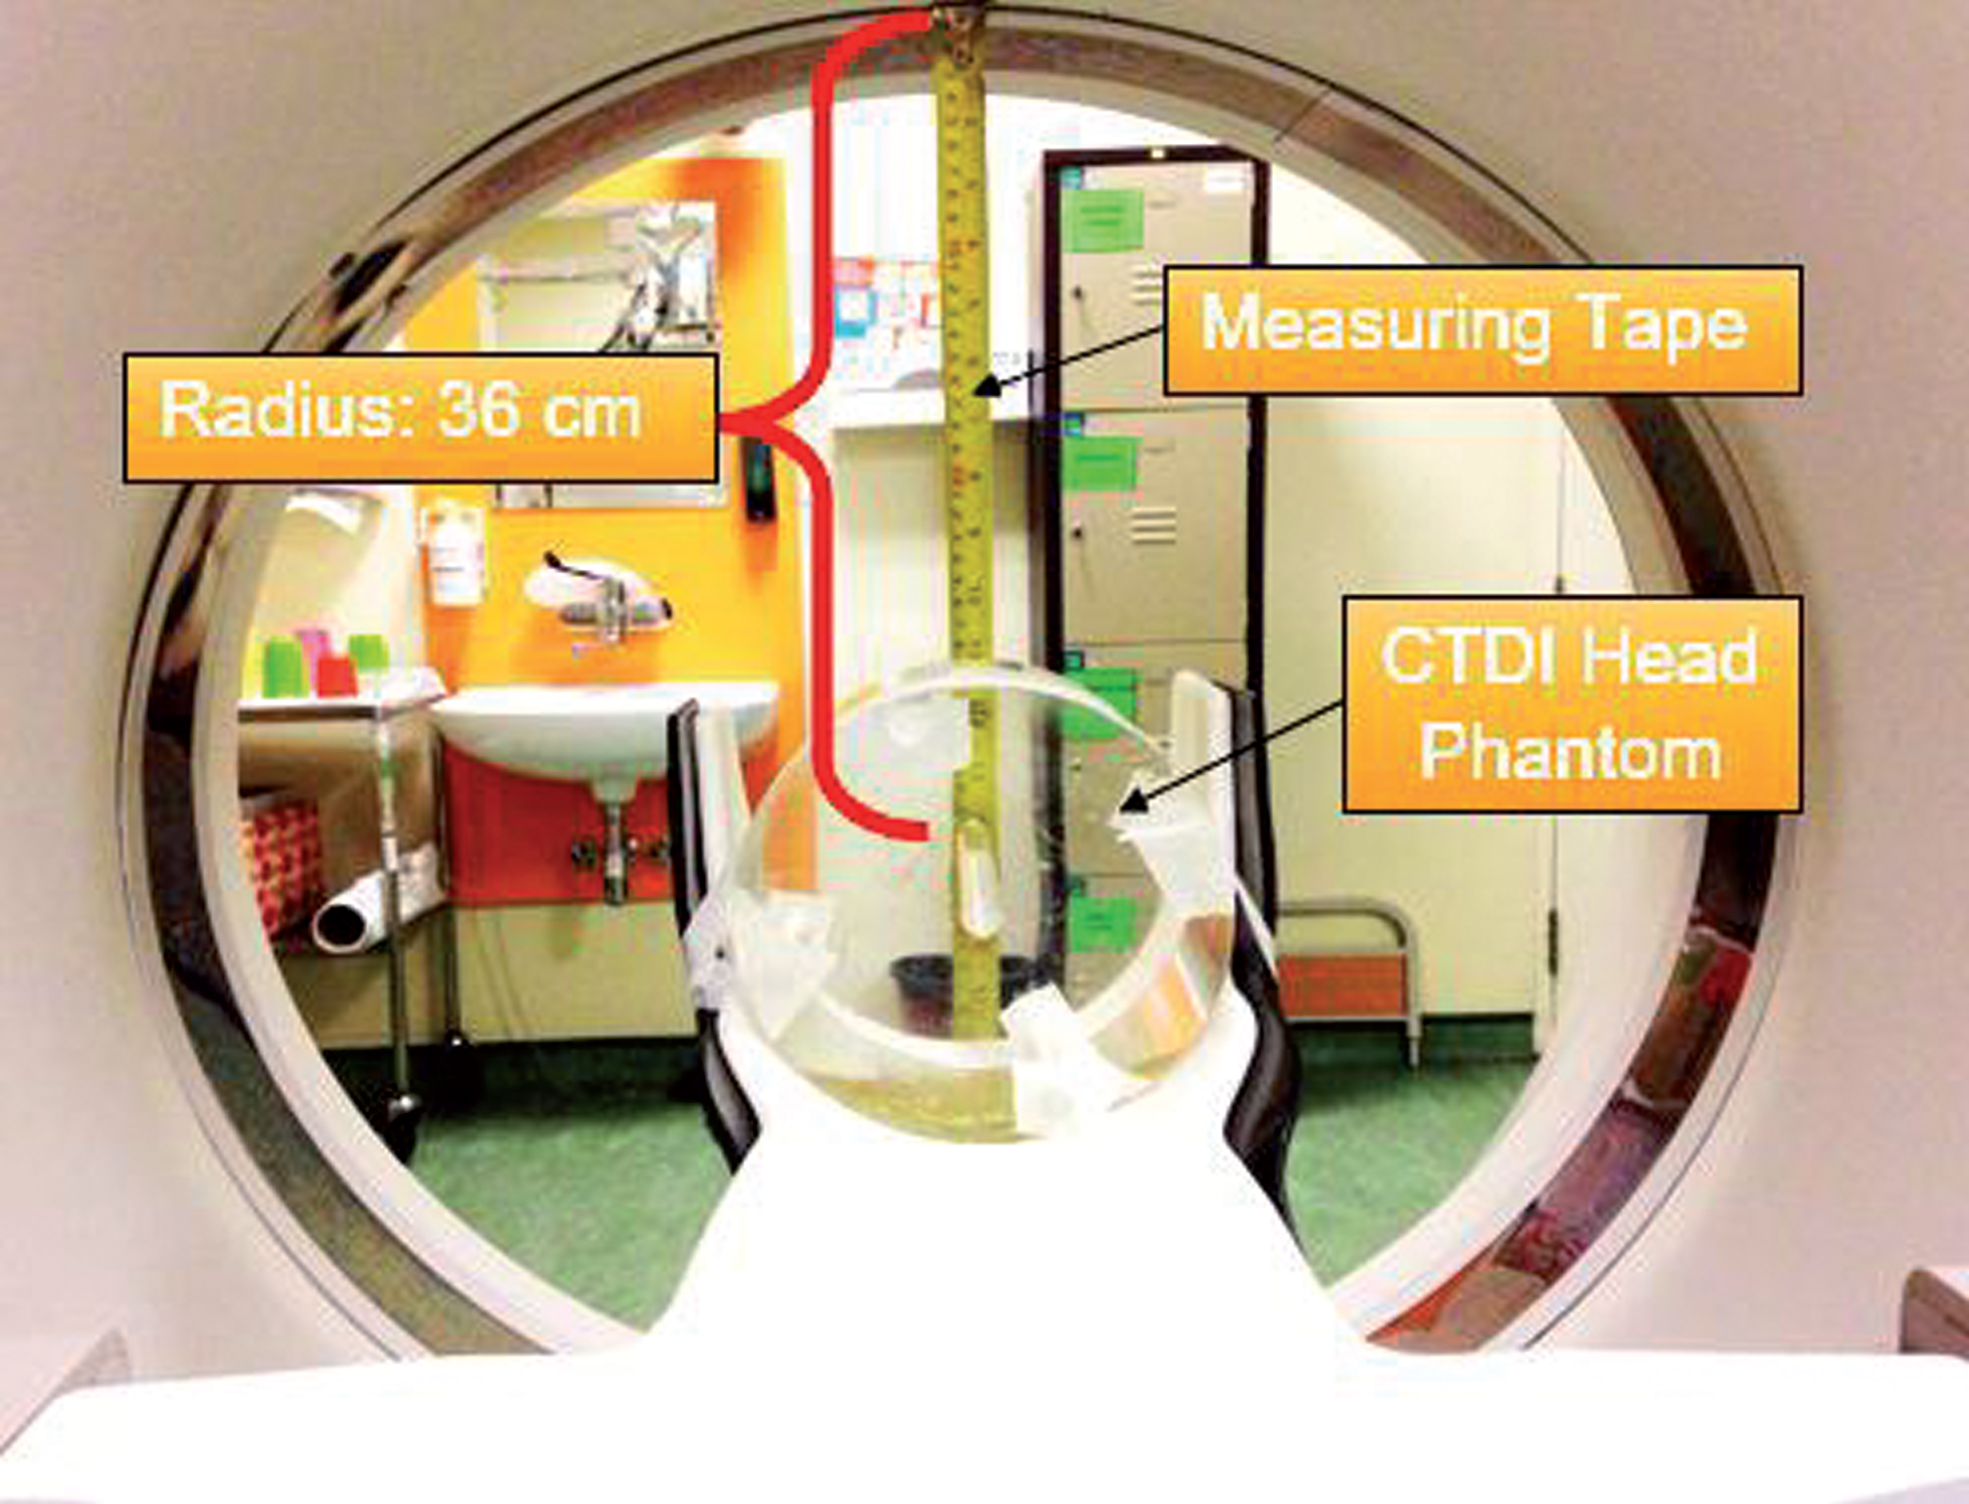
In standard practice, the radiation dose from CT to the patient can only be comparable to the CTDIw rather than CTDIair. CTDIW illustrates a distribution of dose exposure from CT to the represent polymethylmethacrylate (PMMA) cylindrical phantom. The measurement of the CTDIw was performed by using CTDI head phantom and pencil ionization chamber. The CTDIw was a derivation from the absorbed dose measurement at the center (CTDIc) and four peripheral positions (CTDI
p
) of CTDI head phantom. The calculation of CTDIw using the following equation [9]:
Set-up of the pencil ionization chamber into the center hole of the CTDI head phantom.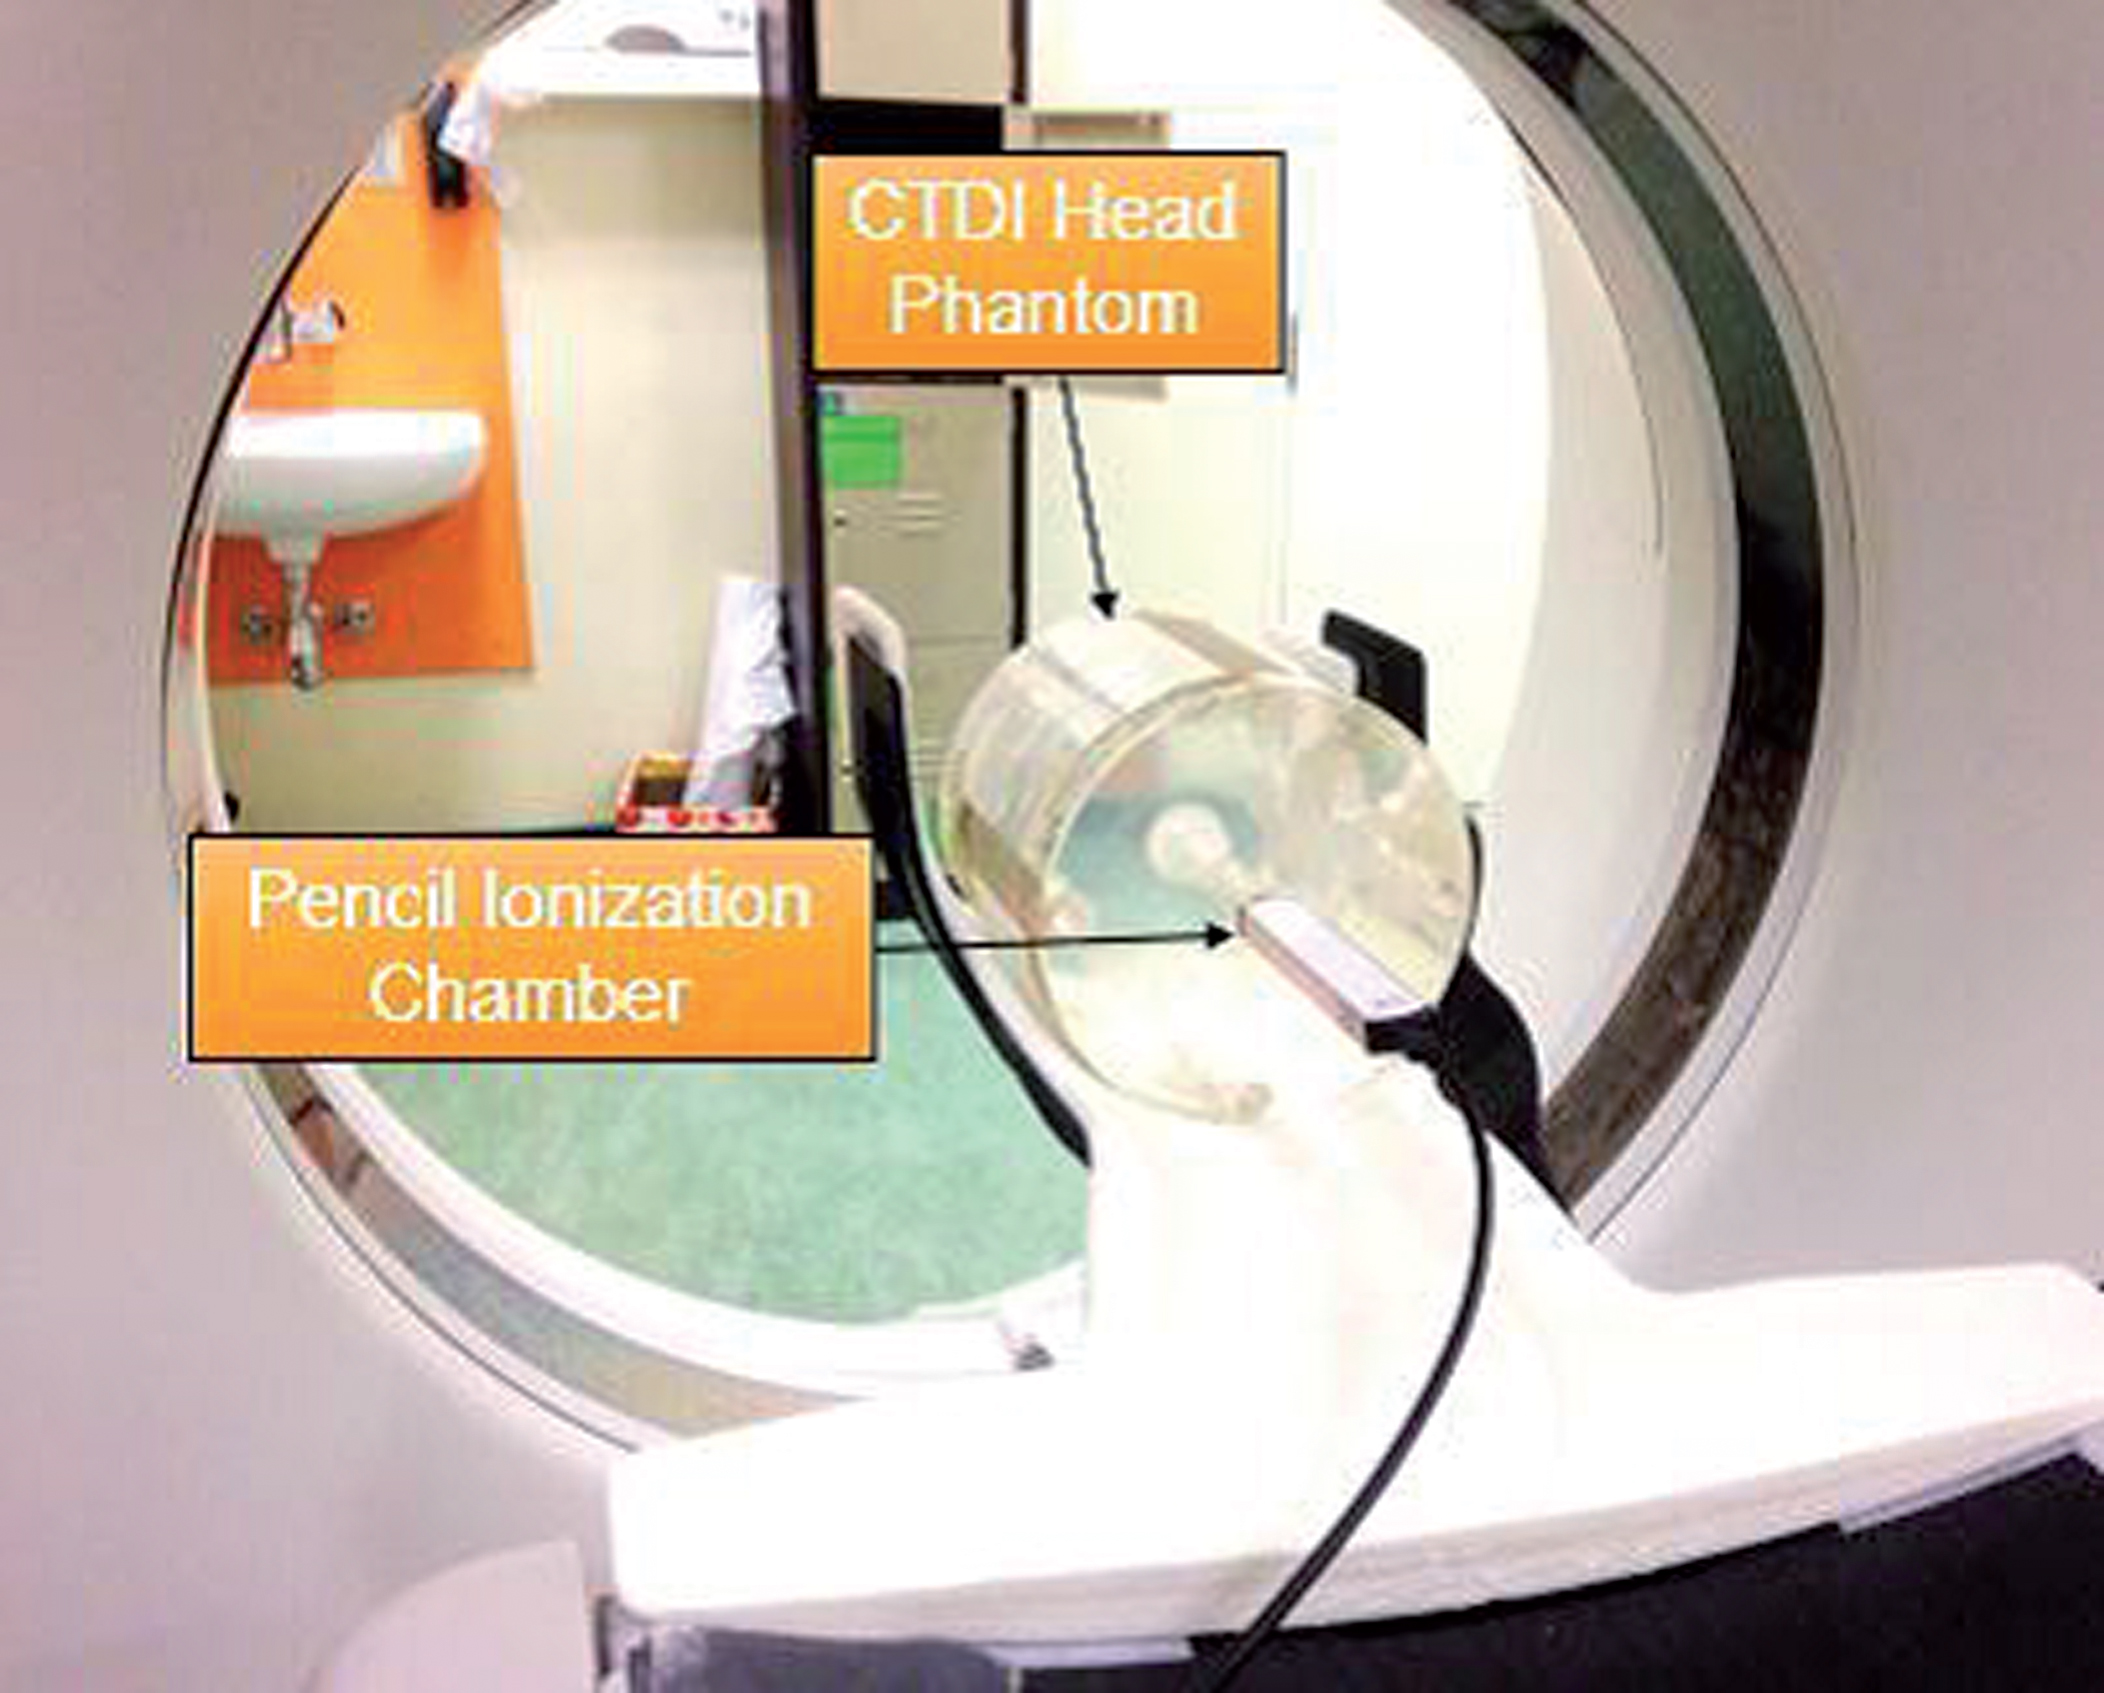
Conversion factor for adults based on specific tube voltage and body regions for CT examinations ICRP Publication 103
Data were analyzed using Statistical Package for Social Sciences (SPSS) version 22.0 (IBM SPSS, Armonk, New York, USA). The Shapiro-Wilk test was used to determine the normality of the estimated effective dose. The quantitative variables were expressed as a mean±standard deviation. Differences between the two groups were determined using the ANOVA (p < 0.05), while the Kruskal-Wallis H Test was used for more than two groups (p < 0.05). The mean comparisons between variables were presented descriptively.
Results
Mean of the CT radiation dose descriptors at different table height positions for adult protocol
Mean of the CT radiation dose descriptors at different table height positions for adult protocol
Note: Data in a column denoted * are statistically significant (p < 0.05).
Mean of the CT radiation dose descriptors at different table height positions for low dose protocol
Note: Data in a column denoted * are statistically significant (p < 0.05).
Table 3 shows the dose value for low dose protocol. As can be seen, the lowest mean value of the CTDIvol, DLP, and E were obtained from isocenter. The mean CTDIvol and DLP value demonstrates approximately a 50% reduction from the adult protocol. The mean CTDIvol value was significantly increase (p < 0.05) for MCS (at +10 cm) and for MCI (at – 10 cm) as compared to isocenter. The range of mean CTDIvol value for MCS and MCI were recorded between from 53.58 mGy to 51.65 mGy and 53.51 mGy to 51.22 mGy, respectively. Interestingly, the mean DLP value significantly varies (p < 0.05) between the isocenter to the MCS and MCI, which differed by 56.5 mGy.cm and 58.5 mGy.cm, respectively. The ratio of maximum to the minimum for mean E value in relative to isocenter is 1.08. At the table +10 cm and – 10 cm, the mean E value showed a significant increase (p < 0.05) compared to the isocenter with recorded value were 1.62 mSv and 1.63 mSv, respectively.
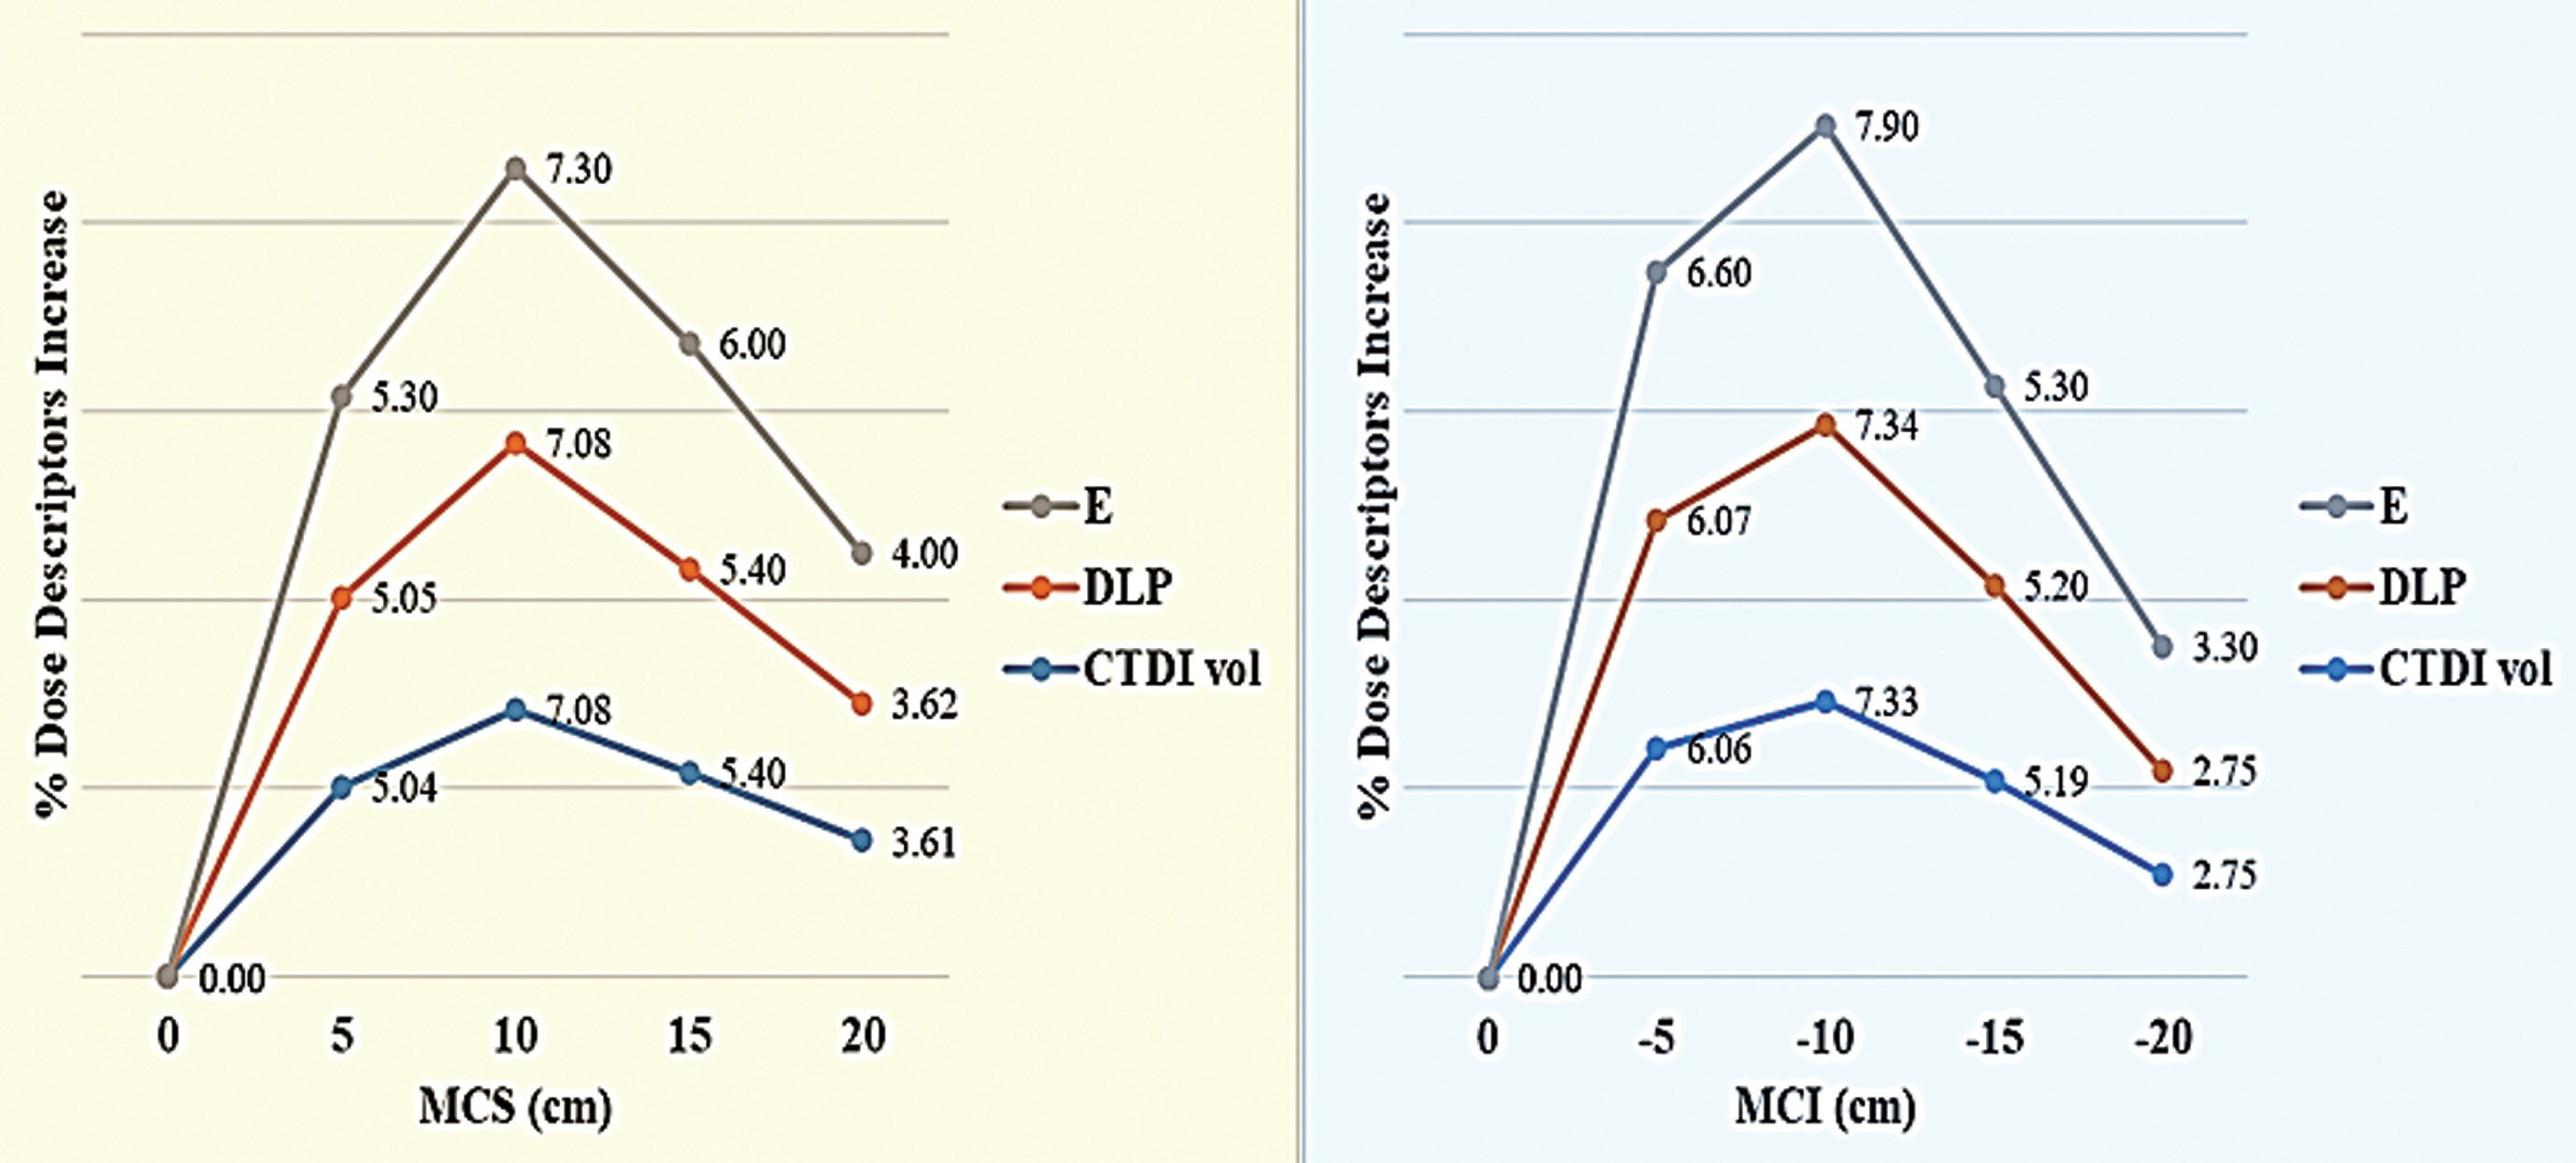
In addition, it was apparent that at the isocenter position, the phantom received the optimum dose, while miscentering condition shown significant increment in the dose value. As predicted, the radiation dose is changing along the location for both miscentering, MCS and MCI. However, the changes of the dose recorded at the beginning were increased and after reach the maximum doses (at +10 cm and – 10 cm) the dose decrease uniformly. These trends were similar for both, adult and low dose protocols. The range of the highest percentage E increase due to miscentering positions were approximately between 5.4 % to 5.9 % and 7.3 % to 7.9 % for adult and low dose protocol, respectively. These data were presented in Figs. 3 and 4.
The percentage of selected dose descriptors for adult protocol: E, DLP, and CTDIvol show a similar trend for both, MCS and MCI ranging from 3.82% to 5.40% and 3.61% to 5.86%, respectively. The table height at +10 cm and – 10 cm from the isocenter (0 cm), demonstrates the selected dose descriptors reach at the peak value before they decreased uniformly when the table height raised and lowered to +15 cm and – 15 cm, respectively. The percentage of selected dose descriptors for low dose protocol: E, DLP, and CTDIvol show a similar trend for both MCS and MCI ranging from 3.61% to 7.30% and 2.75% to 7.90%, respectively.
An increasing number of CT examinations has led to demand in CT optimization practice especially to patient undergo repeated CT examination to assess disease progression. Currently, optimizations in CT were using specific weight-based protocols, reducing the size of scanning field and reducing the tube voltage setting of the CT. Noting that, the main purpose of the optimization is to reduce the patient radiation dose while maintaining the optimum image quality. Previous studies proved that mis-centering CT chest/abdomen examination may gave impacts the resulting image quality and the radiation dose distribution to the patient [5–7]. While this study was done to assess the effects of mis-centering CT head examination on radiation dose, determined by dose descriptors (CTDIvol, DLP and E) by using CTDI head phantom and CTDI head water phantom. The mean value of dose descriptors and image quality for MCS and MCI were compared to the isocenter.
The phantom study revealed a noticeable difference in radiation dose when the CTDI head phantom was scanned at MCS and MCI positions as compared with when they were positioned accurately at the isocenter of the CT gantry for both exposures; adult and low dose protocol. When the table heights were adjusted at +10 cm and – 10 cm from the isocenter, the dose descriptors showed obvious increment where the highest dose descriptors increased by 5.86% and for adult protocol and 7.90% for low dose protocol, respectively. This finding accordance with the previous study conducted by Li et al. where the radiation dose increases 18% when the CTDI body phantom was miscentered 6 cm from isocenter [14]. In correlation with the clinical study on CT chest-abdomen examination, Habibzadeh et at. showed the patient miscentering 3.7 cm above the isocenter result in radiation dose increase by 29.1% [5].
According to Toth et al., the dose increase due to miscentering was caused by the degradation of the bowtie filter performance [15]. Generally, the function of the bowtie filter is to shape the x-ray beam by removing the low energy photon, subsequently producing uniform attenuated x-ray photons. At miscentering position, the bowtie filter and the position of the phantom are not aligned where it caused the thinner part of the phantom (peripheral area) received high energy x-ray photon [10, 16]. These conditions increased the scattered radiation which is directly contributed to the increment of the radiation dose. At the isocenter, the bowtie filter is aligned with the CTDI head phantom and it functioning efficiently by allowing high energy x-ray photons pass through the thicker part of the phantom (central area) and low energy x-ray photon pass through the thinner part of the phantom (peripheral area). Thus, the peripheral area of the CTDI head phantom receives a lesser dose and only the higher energy photons will be pass through the central area of the phantom. It results in uniform radiation dose distribution across the phantom and the amount of radiation receive much lower as compared to miscentering positions [17].
Miscentering position can cause both, increase and decrease of the radiation dose where 35% decrease in CTDIvol was noted when the table height was located – 5 cm from the isocenter. At similar table height, Kataria et al. found that the organ dose and surface dose were reduced by 5% to 21% [18]. In the present study, when the CTDI head phantom was miscentered from +15 cm to +20 cm and – 15 cm to – 20 cm, similar trends were obtained where the value of each radiation dose descriptors decrease uniformly. Thus, it is possible that dose reduction noted is due to the effect of inverse square law, where the x-ray intensity is inversely proportional to the distance from the x-ray source. Once the CTDI head phantom was positioned at table height of±15 cm to±20 cm from the isocenter, the distance between the CT x-ray tube to the pencil ionization chamber is increased and caused x-ray photon energy to spread over a large area. Consequently, the dosimeter receives low energy x-ray photons which quantify less value of the radiation dose.
In clinical situation, it is a common practice for patients with traumatic intracranial haemorrhage to receive multiple times of CT head examinations, regardless of symptoms in order to evaluate progression of the injury. These conditions increase the daily workload and generate stress related to work among the radiographers. Noting that, due to the higher daily workload and the urgency to get the diagnostic information from the examinations, the radiographer cannot afford to spend more time for proper patient positioning which leads to miscentering. Miscentering can cause error on the ATCM system, where miscentered phantom would further away from the isocenter of CT gantry and the phantom’s size is estimated to be smaller than the actual size [19]. As consequences, the ATCM system only allowing a small amount of tube current-time product passes through the phantom and then reach at the detector which explains low dose detection. However, this situation cannot be applied in the present study as the ATCM system was disabled during conducting this experiment.
Conclusion
The proper centering of patients during CT head procedure is an important issue, however, it is often neglected. This study proved the miscentering affect significantly in term of radiation dose in both, adult and low dose protocols for CT head examination. Even though this is an experimental study which may not translate to the clinical situation, the findings, however should not be neglected especially when dealing with the patients that require repeated examinations where radiation dose is the main concern. Furthermore, the degradation of image quality may contribute to increasing the possibility of misdiagnosis which can affect the disease management and treatment of the patient. In conclusion, this study emphasizes the importance of an accurate patient centering at the isocenter of CT gantry so that CT optimization practice can be achieved.
Footnotes
Acknowledgment
The authors wish to acknowledge grant support from Universiti Putra Malaysia with the project number GP/IPM/UPM/9619800.