
Abstract
BACKGROUND:
Breast cancer is a common disease in women. Early detection and early treatment can reduce breast cancer mortality. Studies have shown that breast cancer microcalcifications is one of the important clinical manifestations of early breast cancer, and sometimes even the only manifestation. When the mammography image shows typical malignant microcalcification, it can be diagnosed as breast cancer without any other signs of malignancy. In the aided diagnosis of microcalcifications, it is a crucial step to automatically find and locate regions of interest containing microcalcifications. However, the existing feature extraction method for microcalcifications only extracts features in the time domain or wavelet domain, and does not completely represent all the information of the region of interest. An extraction method based on the combination of Dual-Tree Complex Wavelet Transform (DTCWT) and texture features is proposed in the paper.
METHODS:
First, the processing operations including denoising, enhancement, and edge detection were performed on mammograms. Sub-image segmentation is then performed. DTCWT features and texture features are extracted for each sub-image.DTCWT features are combined with texture features, and then genetic algorithm is used for feature optimization. The features are classified by the Extreme Learning Machine (ELM) to achieve rapid detection and automatic extraction of ROI with microcalcifications. The experimental results verify that the feature model proposed in this paper has the highest detection rate for ROI regions. The ROI region extracted by the proposed feature model was used as subsequent experimental data. Three different methods were used to detect the microcalcifications, including Top-hat, wavelet transform, and methods combining Top-Hat and wavelet transform.
RESULTS:
The method was applied to 100 mammograms from the mammograms database of women in Northeast China. In the automatic extraction of ROI, the accuracy, sensitivity, specificity, positive accuracy and negative accuracy of the proposed model combined with DTCWT were 95.92%, 96.71%, 92.20%, 93.65%, 96.33%, respectively. When the Top-hat algorithm was used for microcalcifications detection, the sensitivity reached 89.6%, and the false positive detection rate was 2.6. When the wavelet transform algorithm was used for microcalcifications detection, the sensitivity was 91.1%, and the false positive detection rate was 3.28. When the combined algorithm was used for microcalcifications detection, the sensitivity was 86.7%, and the false positive detection rate decreased to 1.35.
CONCLUSIONS:
The proposed model combined with DTCWT features achieves better result in the automatic extraction of ROI. Moreover, in the subsequent detection of microcalcifications based on three methods, the three methods achieved better results in sensitivity and false positive detection rate, respectively.
Introduction
According to the Global Cancer Statistics from 2018, breast cancer is a common cancer among women and the leading cause of cancer deaths, with an incidence of 46.3% and a mortality rate of 13.0% [2]. It has reached consensus around the world that early detection, early diagnosis and early treatment can effectively reduce the mortality rate of breast cancer [6]. Because of factors such as the living environment and others, the age of breast cancer patients is becoming younger and younger. Due to the dense characteristics of the breast, glands easily cover masses and lesions and reduce the accuracy of diagnosis by doctors. Microcalcifications is one of the important signals of early breast cancer, sometimes even the only positive basis for the diagnosis of breast cancer [29]. Therefore, the detection of microcalcifications has become an important step for early detection, early diagnosis and early treatment of breast cancer [20]. High-frequency digitized mammography can recognize microcalcifications with more than 95% accuracy, and is the preferred method for early screening of breast cancer [4].
In the process of building a breast census, the microcalcifications are small and varies in shape, which can easily lead to missed diagnosis and misdiagnosis. Therefore,it is necessary to realize automatic positioning and precise segmentation of microcalcifications. Computer Aided Diagnosis (CAD) [39] has become a powerful tool for early detection of breast cancer. Computer Aided Detection (CADe) and Diagnosis (CADx) techniques applied to mammograms can effectively reduce the burden of medical examiners and effectively reduce misdiagnosis [27].
At present, a variety of techniques have been used for the detection of microcalcifications in CAD [21, 22]. It can be known from literature that combining the texture characteristics and the statistical properties of the wavelet coefficients after wavelet transform can effectively improve the accuracy of image detection. Because wavelet transform has the characteristics of multi-resolution analysis, it is a local transform in space or time and frequency domain. It can simultaneously represent local features of signals in time domain and frequency domain, and has high frequency resolution in the low frequency part. And there is lower time resolution, on the other hand, higher frequency resolution and lower frequency resolution in the high frequency part. For mammography images, the microcalcifications are discretely distributed points that are intermingled with low frequency background and very high frequency noise. Therefore, the time-frequency localization characteristics of the wavelet are suitable for the automatic extraction of ROI of the mammography image microcalcifications. At the same time, because the ROI contains microcalcifications, the high-frequency coefficients after wavelet decomposition have large fluctuations. Therefore, statistical features such as mean and variance can further reflect the global characteristics of ROI and achieve the purpose of image classification.
Although the traditional Discrete Wavelet Transform (DWT) has been widely used in many conveniences of image processing, its inherent shortcomings limit the processing effect [17]. Mainly manifested in the following two points: lack of translation invariance and limited directional selectivity, Kingsbury et al. proposed DTCWT to overcome these two shortcomings. On this basis, this paper combines the texture features with the DTCWT features. For the ROI with microcalcifications, the good time-frequency localization characteristics of the wavelet transform preserved by DTCWT can well identify the ROI. At the same time, the high-frequency sub-images of the six directions generated on each layer of the two-dimensional DTCWT have three more directions than the two-dimensional DWT, and the microcalcifications exhibit the characteristics of high-frequency signals on the image. From this we can see that DTCWT can better describe the directional characteristics of microcalcification-containing ROI. Therefore, a method for detecting microcalcifications of mammography images incorporating DTCWT and texture features is proposed in the paper.
Background
Incidence of breast cancer is increasing year by year. Microcalcifications is an important feature of early breast cancer. In order to locate the location of microcalcifications quickly and accurately, experts at home and abroad have invested significant resources to study and improve computer-assisted diagnosis system(CAD) for breast microcalcifications detection, and has achieved a lot of research results.
In image processing, in order to improve the sharpness of the image, Kim et al. [19] proposed an adaptive X-ray image enhancement method based on first derivative (such as Sobel operator and Roberts operator) and local statistical information. Spiesberger et al. [34] achieved microcalcifications segmentation using image grayscale brightness, compactness and statistical metrics as verification conditions, and correlation coefficients. Cheng et al. [7] used fuzzy set theory and geometric statistical methods to optimize the detection result of microcalcifications.
Some researchers have made outstanding contributions in extracting image features and detecting microcalcifications. Davies et al. [9] firstly proposed that the brightness, compactness and statistical measure of image gray level should be used as validation conditions, and the correlation coefficient should be used to realize the segmentation of microcalcifications. Rizzi et al. [26] used two-stage wavelet decomposition to achieve the detection of microcalcifications. Ramirez-Cobo et al. [31] used the multifractal spectrum based on two-dimensional wavelet transform to classify benign and malignant of microcalcifications.
In addition, with the development of pattern recognition and machine learning languages, a series of machine learning methods are increasingly applied to the microcalcifications detection of breast images. Mohamed et al. [28] used KNN, SVM, and ANN methods for benign and malignant classification. Jinhua Wang et al. [18] used a deep learning method to analyze microcalcifications and masses, and improved the detection accuracy of microcalcifications from 87.3% to 89.7%. Tiedeu et al. [36] performed microcalcifications detection by integrating image enhancement and threshold-based segmentation methods. Oliver et al. [30] trained the pixel-based ascending classifier and selected different features, and finally determined the location of the calcifications by examining the surrounding area of each microcalcifications. Zhang E et al. [12] proposed a dual threshold technique to extract potential regions and used SVM classifiers to reduce the number of false positives and use the MIAS database for evaluation. Malar et al. [24] used wavelet texture features and Extreme Learning Machine (ELM) for the detection and classification of microcalcifications. Compared with the artificial neural network classification method based on the least risk, research shows, this method has higher detection accuracy.
However, the existing method for detecting microcalcifications only extracts features in the time domain or wavelet domain. Since only selecting features in the time domain or the wavelet domain does not separate all ROIs, which will result in the loss of a part of the ROI containing microcalcifications. So a new method for detecting microcalcifications in combination with DTCWT features and texture features in breast mammography is proposed in this paper.
Material
A total of 100 mammography images with microcalcifications was used in this paper. These images were collected from 100 patients. The time of collection images was from November 2014 to September 2015. The patients were all the northeastern women, ranging in age from 44 to 77 years old, with an average age of 57.65 years old. In 100 mammography images, 50 images of the axial position (Craniocaudal, CC) and 50 images the Mediolateral Oblique (MLO) are contained. The specific distribution is shown in the following Table 1. Microcalcifications have been marked by a well-experienced doctor. The indicated microcalcifications are as a gold standard.
Image distribution
Image distribution
As we all know, the edge contours of CC and MLO images are different. Therefore, after sliding the window(In the section of 4.1. Image Processing), the number of obtaining sub-images in each image is also different. By large number of experiments, 500 sub-images can be obtained per image on average. In other words, we can obtain about 50,000 sub-images from 100 mammography images. After obtaining sub-images, according to the gold standard, we divided them into two categories: sub-images with microcalcifications and sub-images without microcalcifications. 200 sub-images in with microcalcifications and 200 sub-images in without microcalcifications are selected randomly for the experimental data.
Since only selecting features in the time domain or the wavelet domain does not separate all ROI. The paper presents a new method for detecting microcalcifications in combination with DTCWT features and texture features in breast mammography. First, the image is pre-processed by the median filtering denoising method and the enhancement method combining the spatial and frequency domains. Next, sub-image segmentation is performed, and DTCWT features and texture features are extracted separately in each sub-image and fuse feature. Then, the ELM is used for classification to obtain the ROI. Finally, the ROI region extracted by the proposed feature model was used as subsequent experimental data. Three different methods were used to detect the microcalcifications, including Top-hat, wavelet transform, and combining Top-Hat and wavelet transform methods. The process is shown in Fig. 1.
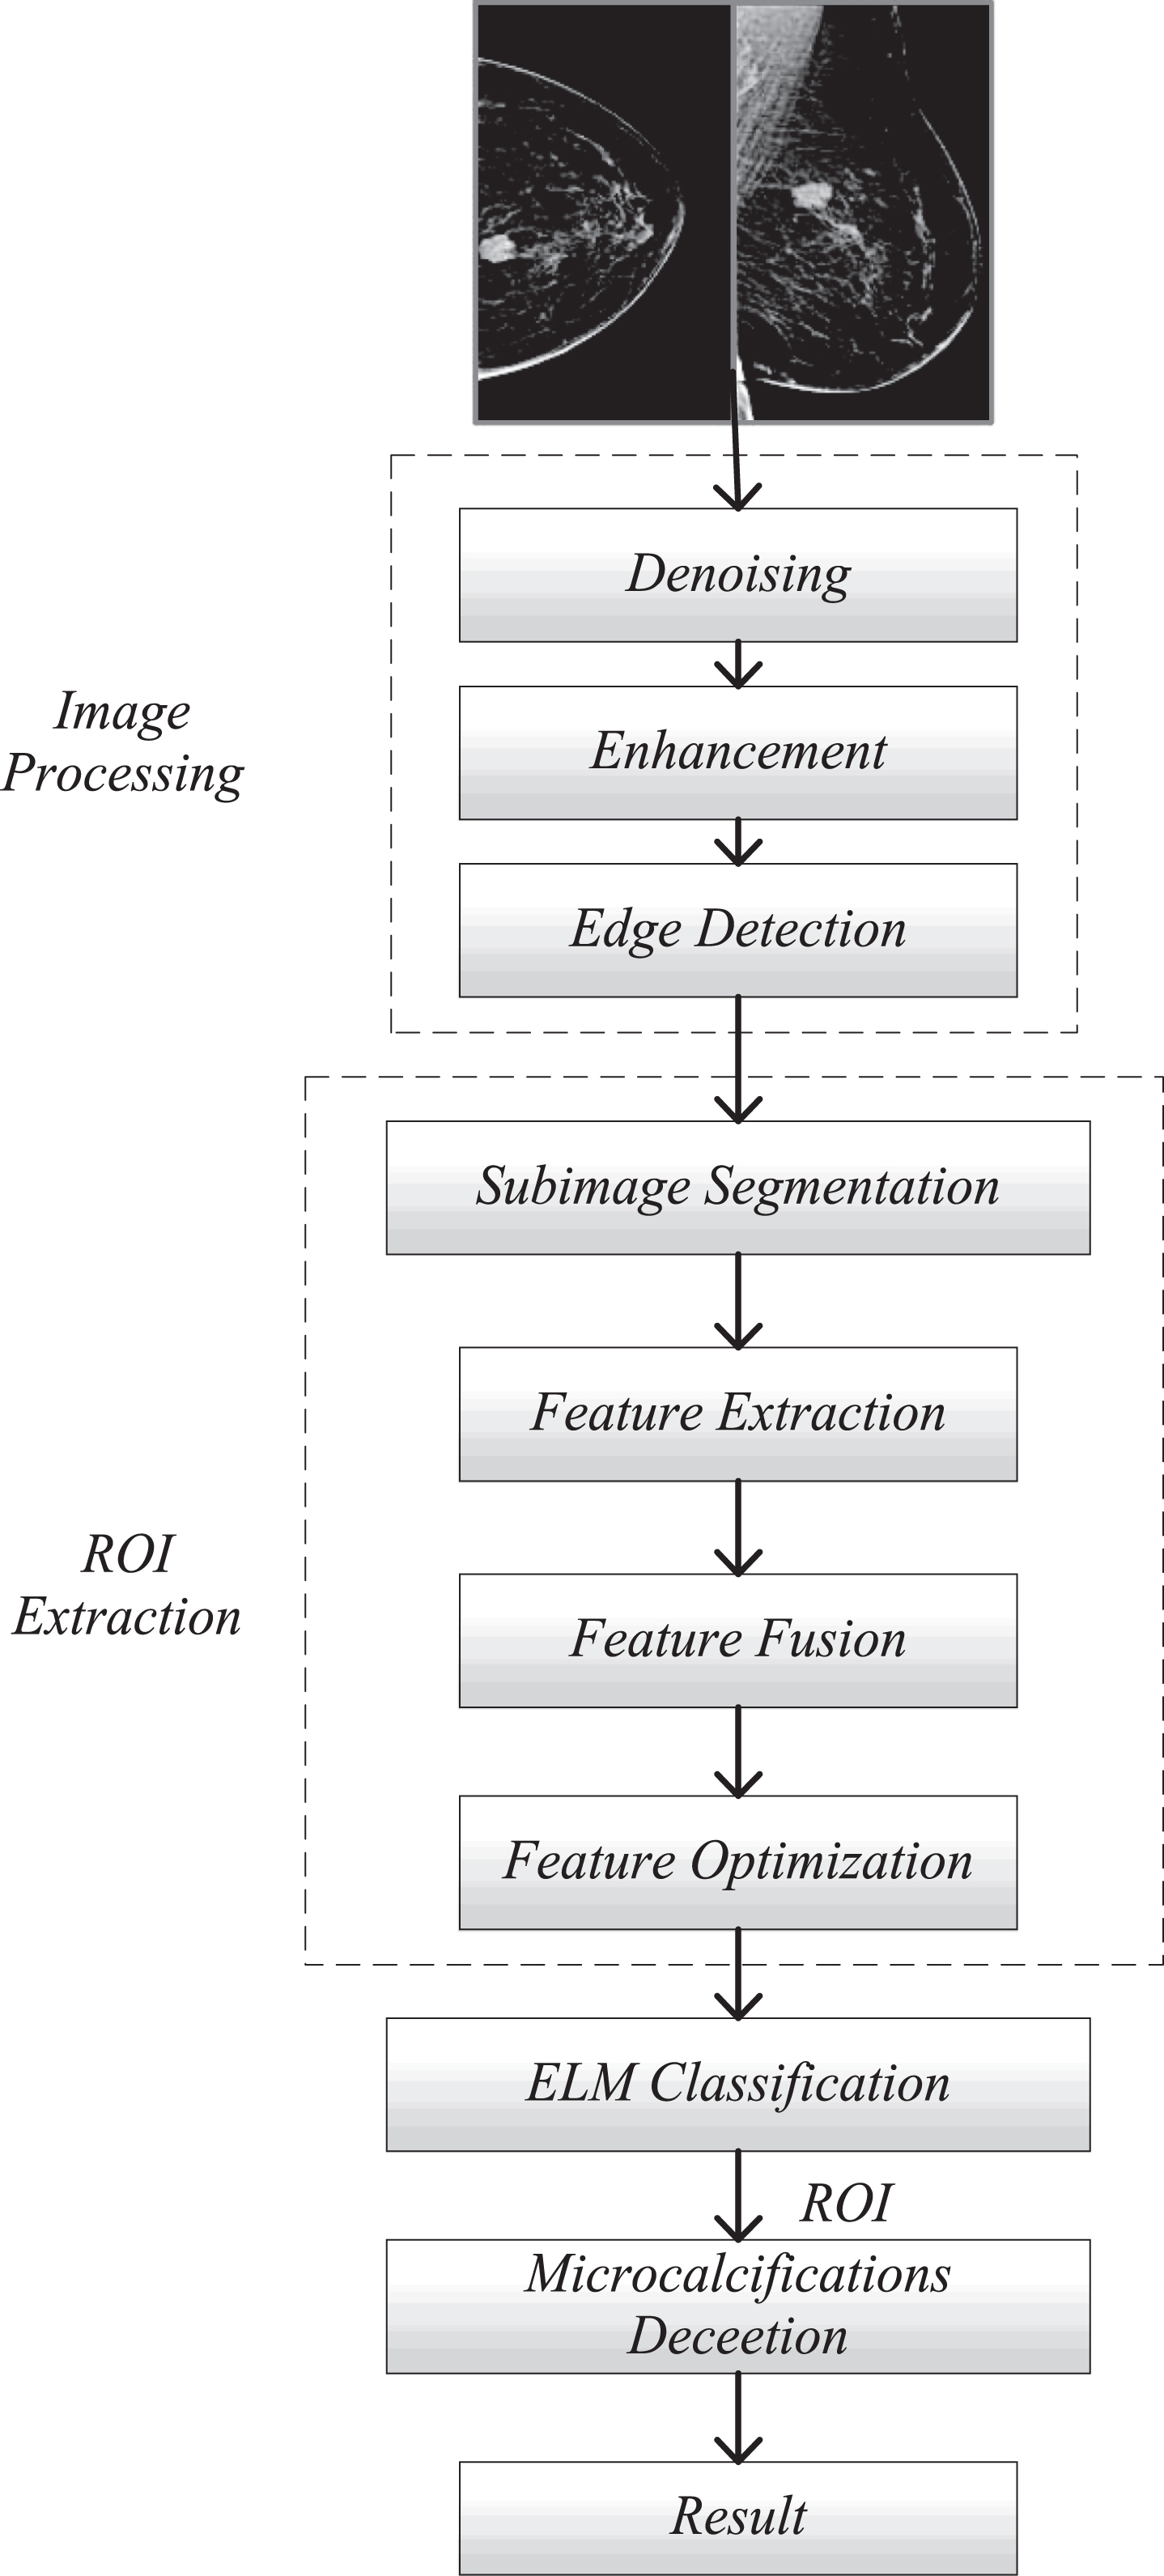
Flow chart of microcalcifications detection.
Looking at the image of the breast. Contrast is not obvious between the microcalcifications and the surrounding normal structural tissues such as breast mass and gland tissue.
In order to highlight the microcalcifications information, marginalize the useless information, and to reduce the burden on the subsequent analysis of the image as much as possible, image processing is necessary. In this section, we mainly discuss image processing, including image pre-processing and sub-image segmentation.
The image pre-processing process includes denoising and enhancing the image. In the paper, the improved adaptive median filtering algorithm [5] is used for the denoising processing. The results are shown in Fig. 2. Among them, Fig. 2(a) is the original image, and Fig. 2(b) is the denoised image. In order to highlight the information of microcalcifications in the image, we combine the piecewise linear transformation algorithm used in the spatial domain with the non-sampling contourlet transform (NSCT) [43] algorithm used in the frequency domain. The piecewise linear transform method is applied after the NSCT method, and compare the method proposed in the paper with the commonly used methods. The results are shown in Fig. 3.
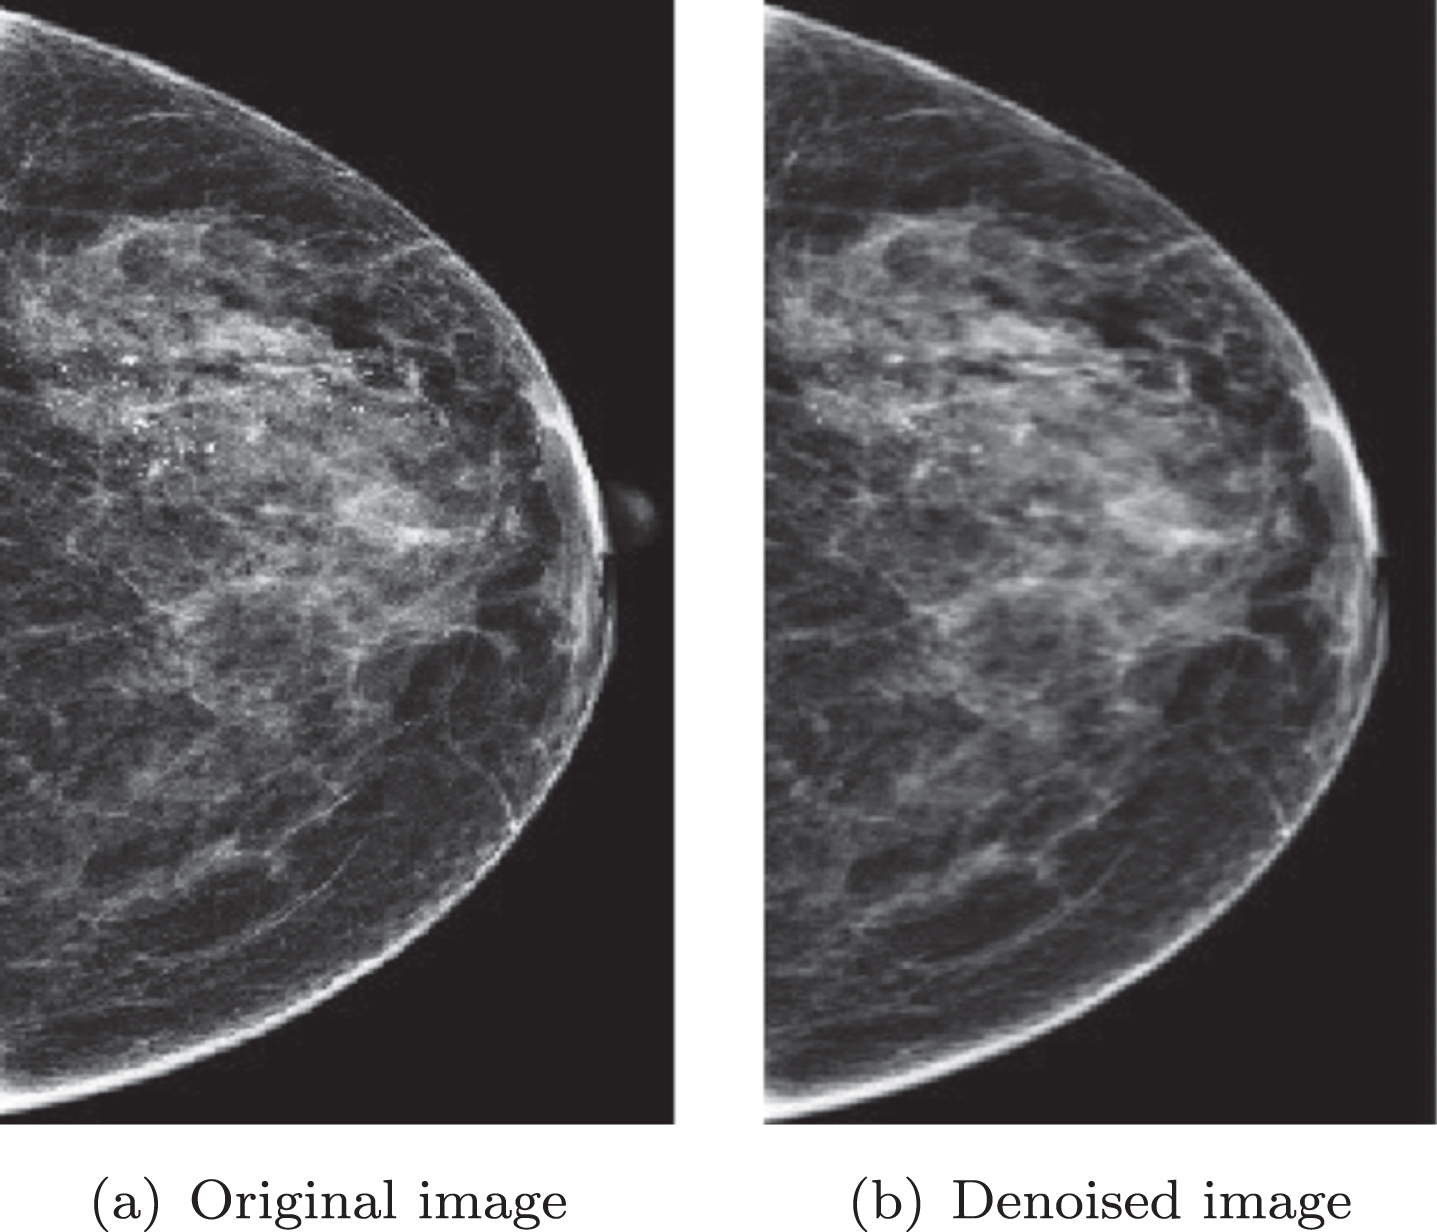
Image denoising.

Image enhancement based on different methods.
The non-sampling contourlet transform (NSCT) can guarantee more choices for the directional characteristics of the image on the basis of multi-resolution analysis. The piecewise linear function can better highlight the image details in the image which is processed at a certain gray level. Therefore, after the non-sampled contourlet transform, the piecewise linear transformation is further applied to the breast image. It can enhance the micro-edge information of the microcalcifications in the image. It can also effectively suppress the background information in the image. As well as improve the contrast of the image microcalcifications and background. Finally, the purpose of enhancing the microcalcifications in the breast image is achieved.
In order to verify the effectiveness of this method, the paper uses the contrast improvement index (CII) for objective evaluation, which reflects the effect of image edge enhancement. The larger the value, the better the image enhancement effects. The definition of CII is shown in Eq. (1) and Eq. (2). The experimental results are shown in Table 2. Subsequently, we compare this method with three traditional methods(Gray-scale transformation [11], Histogram equalization [1], Wavelet transform [35]). The results are shown in Table 2. The data in Table 2 clearly reflects the CII-avg of the method in this paper is significantly higher than the other three methods.
The CII contrast results of image enhancement
Clinically, the microcalcifications is the initial sign of the formation of the mass, which is small in size, complex in shape and distribution. Due to human factors such as visual fatigue, doctors often cause missed diagnosis. Therefore, the microcalcifications detection based on the mammography image can assist the doctor to complete the precise positioning of the microcalcifications to a certain extent, and reduce the occurrence of missed diagnosis, thereby improving the accuracy of the diagnosis to some extent.In the microcalcification assisted detection process, how to quickly find and automatically locate the ROI is a particularly critical step, especially the microcalcifications takes up a small area for the whole image, and the ROI is acquired for the subsequent segmentation.
Sub-image segmentation is to divide the pre-processed breast image into several equal-sized sub-images, which is the premise of ROI acquisition. First, we used the Canny operator to obtain the boundary of the breast outline, and obtained the mammary region in the mammography image, in order to divide the sub-region in this region. The main purpose of sub-image segmentation is to divide the mammary region into several equal-sized sub-images in order to extract the features of each sub-image, thereby automatically dividing the sub-image into a calcified sub-image and a calcified-free sub-image. The sub-image containing the microcalcifications was taken as the ROI, and the subsequent microcalcifications detection was performed on the ROI. The size of ROI is 128 × 128. In this paper, the method of sliding window is used to realize the segmentation of sub-images. As shown in the above Fig. 4, the red line is based on the breast contour detected by the Canny operator, and the image is scanned to generate a sub-image. The specific implementation process is as follows:

Sub-image segmentation based on sliding window.
Step 1: Determine the sliding range of the sliding window. Since the microcalcifications must be located inside the mammary gland, a minimum rectangular area containing the mammary gland is defined as the sliding range in this paper, and the boundary of the mammary gland is the contour boundary of the mammary gland. The rectangular area of the sliding range is S, and the coordinates of the clockwise four vertices of the rectangular area S from the upper left corner are (x1, y1), (x2, y2), (x3, y3), (x4, y4).
Step 2: The window starts to slide from the coordinate of the upper left corner (x1, y1), and the line is preferentially slid in the rectangular area S, and the sliding step size is 128. When all four vertices are outside the S area, the line ends and goes to the next line to continue sliding. Slide it line by line as described above until the sliding window of the last line contains points and the four vertices are not all outside the S area, then the slides all stop. The sliding window is shown in the figure above. The red line represents the boundary of the breast contour, the white scattered point represents the microcalcifications, and the coordinates of the four vertices a,b,c,d of the rectangular area S are (x1, y1), (x2, y2), (x3, y3), (x4, y4). The black square area in the upper left corner represents a 128 × 128 sliding window, starting at point a in steps of 128, as indicated by the arrows in the figure. Through the above sliding process, the area of the window at which each slide stays is an image, and features will be extracted based on these sub-images.The divided sub-image is shown in Fig. 5 below.
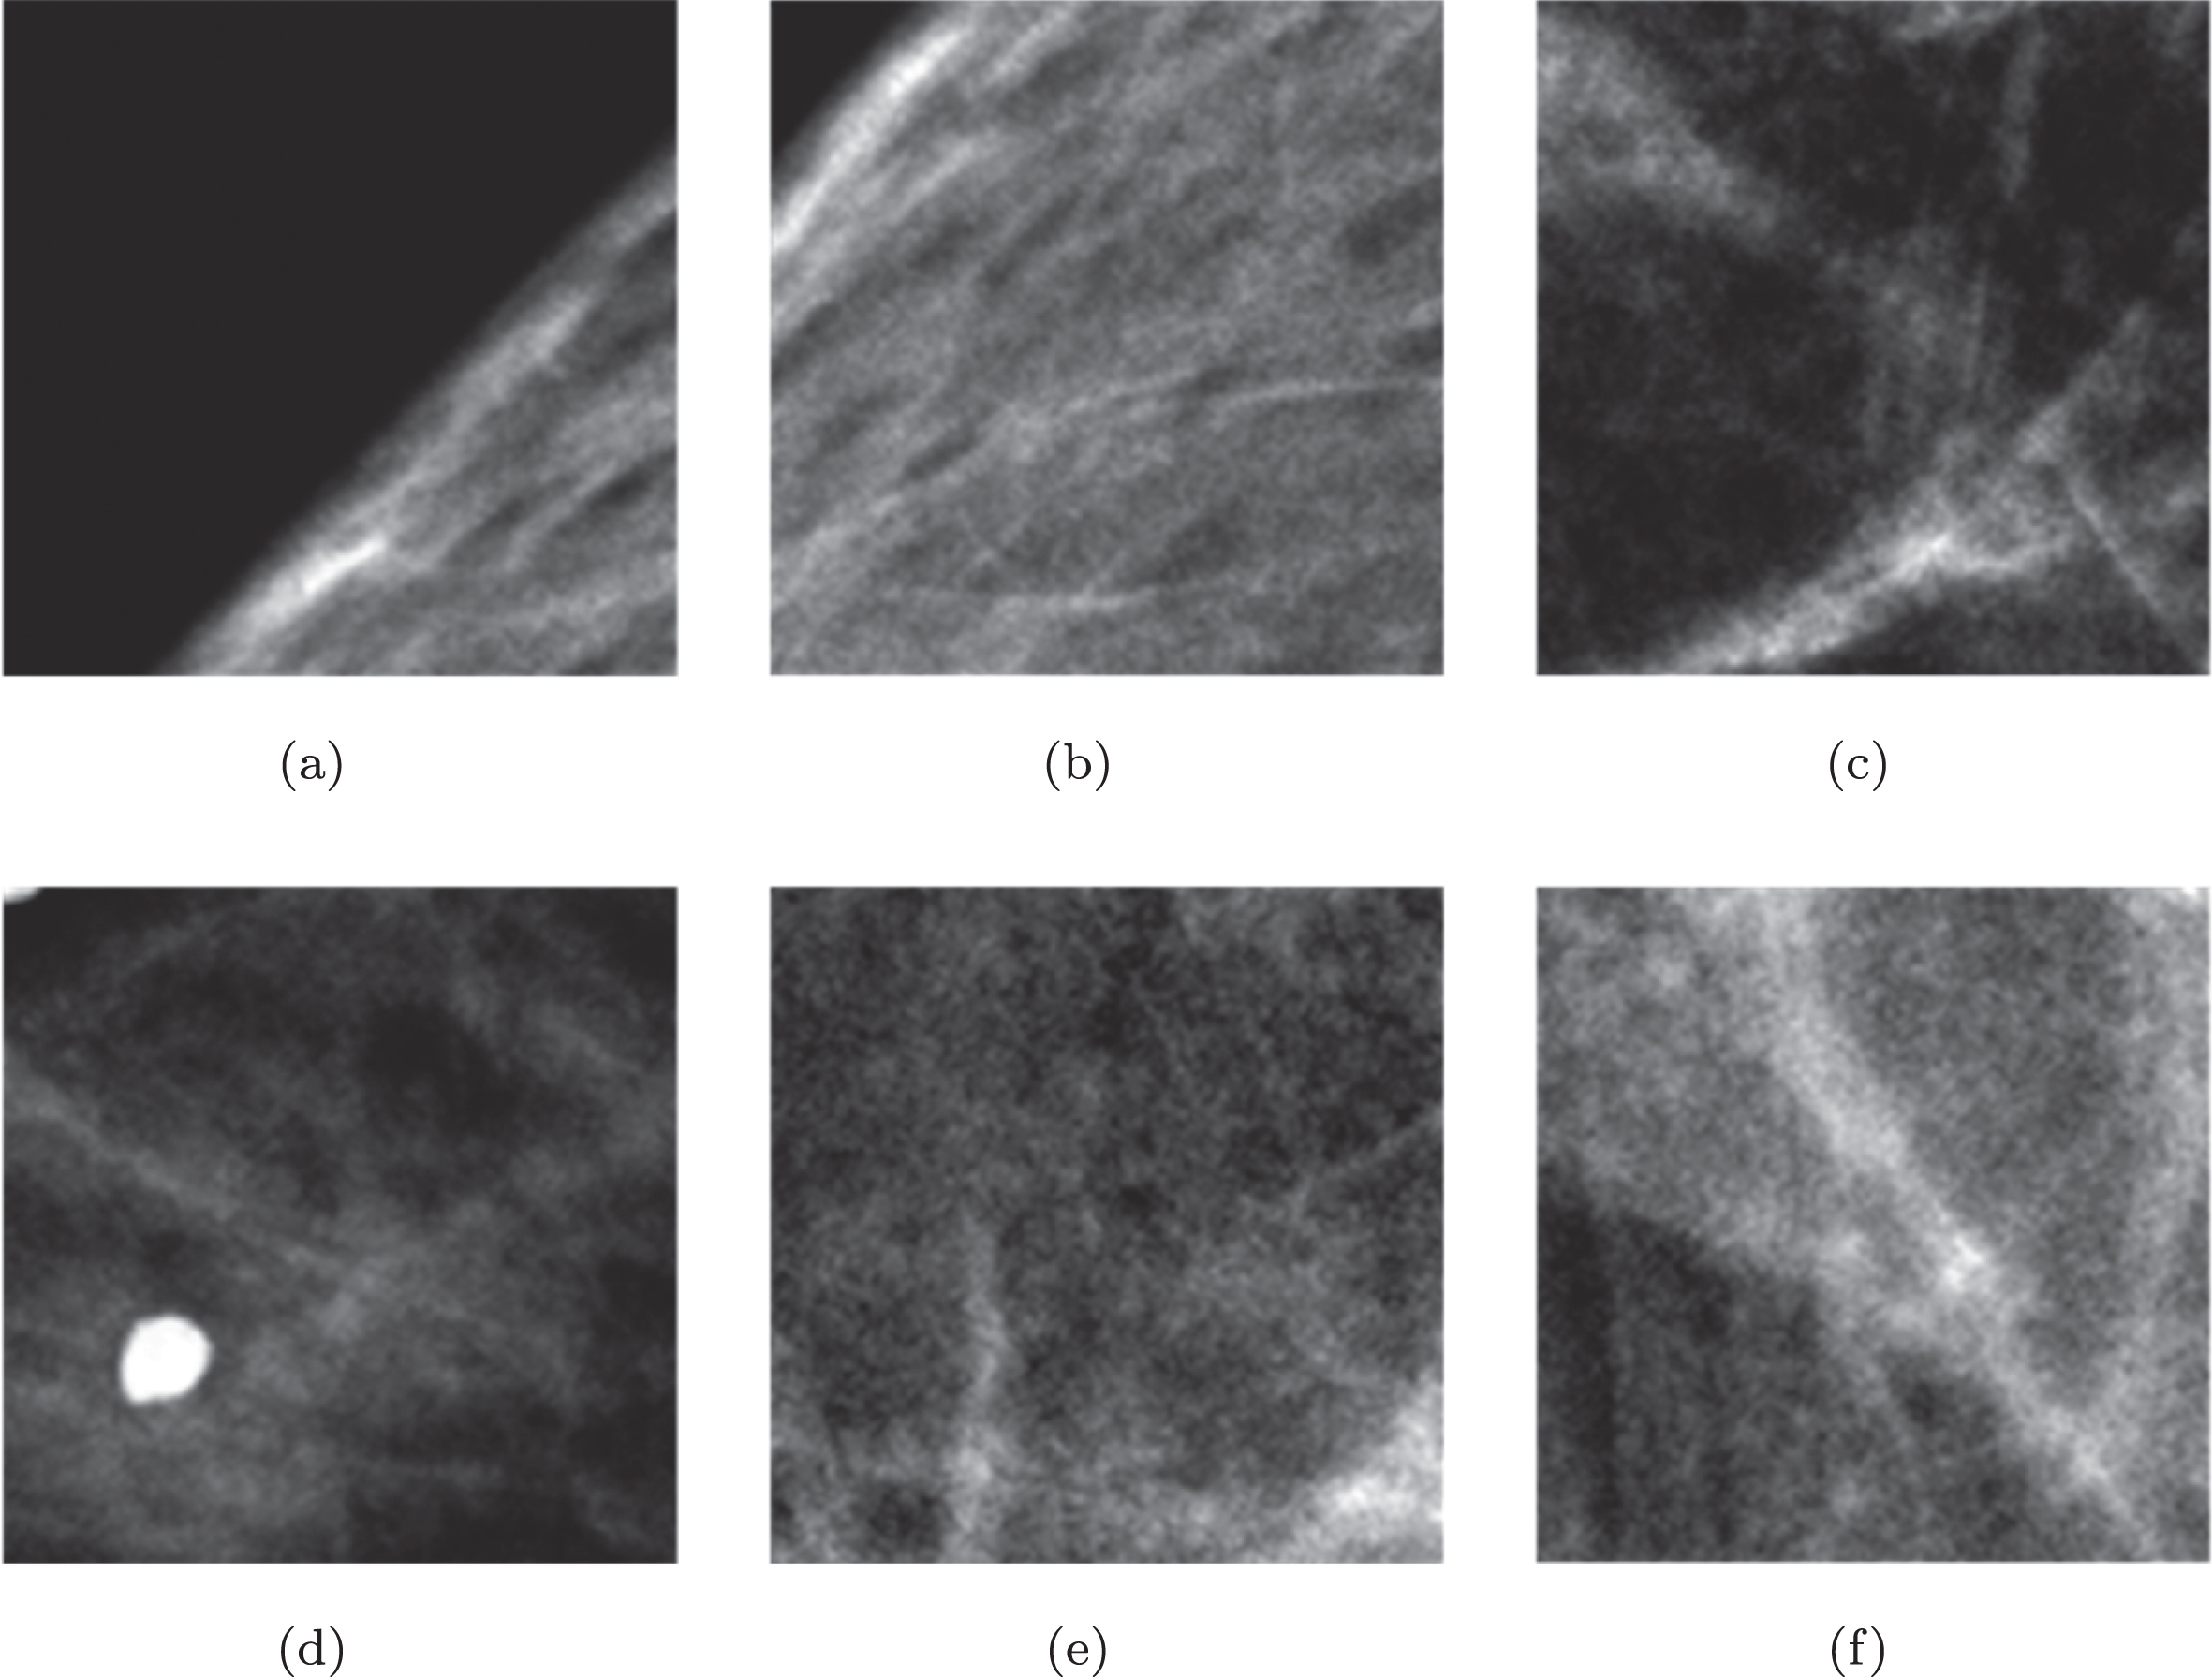
Preliminary Sub-Images (PSIs).
After obtaining PSI, the region of interest (ROI) should be extracted to facilitate the subsequent classification. Automatic extraction of microcalcifications is the key to computer-aided detection and diagnosis of breast cancer [32]. In clinical research, a new method is proposed to extract ROI from mammograms by using skewness and kurtosis of high frequency sub-image after wavelet decomposition [40]. However, only choosing features in the time domain or the wavelet domain cannot represent all the information of region of interest. Based on this, a method of extracting microcalcifications region from mammograms combining DTCWT and texture features is proposed in this paper.
Textural Feature
In this paper, texture features are used as features in the spatial domain. As shown in the model F1(Eq. (3)), which includes five coefficients of Gray Level Co-occurrence Matrix (GLCM) [13] and six components of the texture features proposed by Tamura [23]. The five coefficients of GLCM are texture features including inverse moment, entropy, energy, correlation coefficient and contrast [38]. The six components of the Tamura texture features are roughness, contrast, directivity, linearity, regularity and roughness. The specific formula is shown below.
The GLCM inverse moment difference denotes the local uniformity of the distribution of texture information in the image.
The GLCM Entropy can reflect the degree of image grayness and the complexity of the image.
The GLCM Energy can measure the degree of grayscale variation of texture information in an image.
The GLCM Correlation coefficient can determine the degree of correlation between row elements and column elements in the gray level co-occurrence matrix.
The GLCM Contrast reflects the difference in brightness between two adjacent pixels in the image.
Roughness responses texture granularity statistical properties.
The contrast proposed by Tamura gives a global measure of contrast across the entire image or region.
Directionality reflects the texture characteristics of the image as a whole.
Where n p is the number of peaks in the histogram. p is the peak in the histogram. ω p is the range of quantized values contained in the peak. φ p is the quantized value in the largest histogram value in ω p .
The formula for calculating the linearity is as follows, where P
Dd
is the distance point of the n × n-direction co-occurrence matrix.
The definition of regularity is as follows, where r is the normalization factor and σ
x
is the standard deviation of t
x
.
The roughness is related to roughness and contrast, and the formula is as follows
For mammograms, microcalcifications are discrete points mixed with low-frequency background and very high-frequency noise. Wavelet transform can simultaneously characterize the local characteristics of input data in the time-frequency domain and can be used for multi-resolution analysis of input [10]. Making DTCWT suitable for extracting ROI with microcalcifications. In clinical research, the traditional Discrete Wavelet Transform (DWT) method is widely used. However, the shortcomings of “lack of translation invariance and limited directional selectivity” largely limit its processing effect [16]. Therefore, Kingsbury et al. [33] proposed DTCWT to overcome these two shortcomings, which is described as shown in Fig. 6.
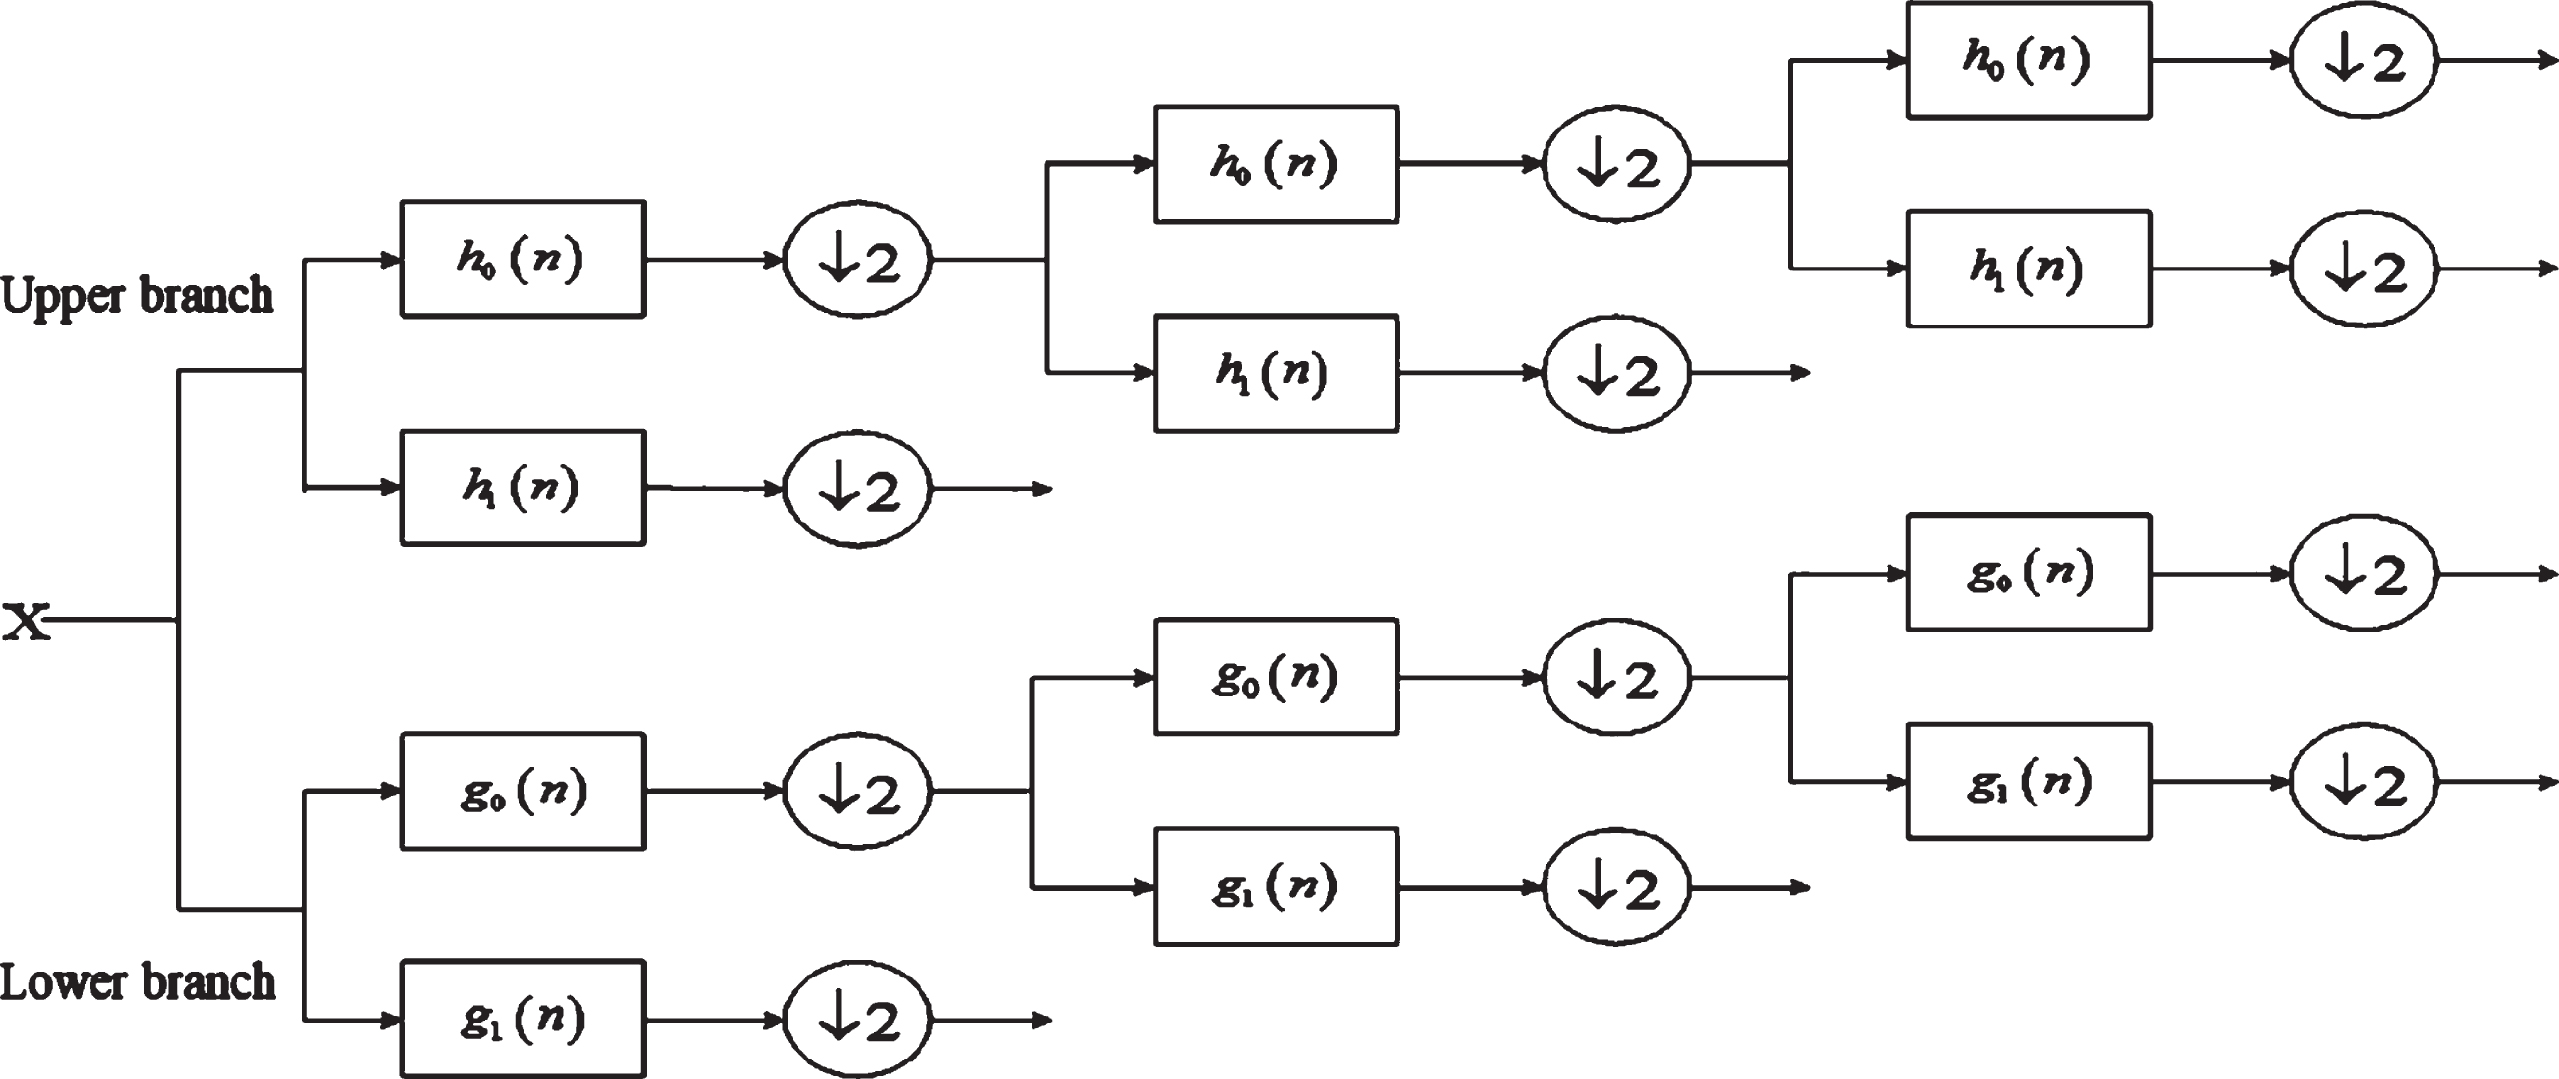
DTCWT decomposition.
It can be seen that DTCWT is realized by two pairs of filter banks which simultaneously perform independent wavelet transform on the input data, and has two branches of upper and lower branches. The superposition filter banks h0 (n) and h1 (n) of the upper branch represent the real part of the complex wavelet transform, they are a group of conjugate orthogonal filters. The superposition filter banks g0 (n) and g1 (n) of the lower branch represent the imaginary part of the complex wavelet transform, they are a group of conjugate integral filters. h0 (n) and h1 (n) are the low-pass filters of the upper branch, g0 (n) and g1 (n) are the high-pass filters of the lower branch. The amplitude-frequency responses of the two filters remain equal in the decomposition process of each layer, and two phase-frequency responses satisfy the Eq. (16). Eq. (15) represents the biorthogonal wavelet transform, and two phase-frequency responses satisfy the Eq. (16).
DWT decomposes only three directions at each scale, which makes it difficult to reflect the changes of images in different directions at different resolutions. After two low-pass filters and two high-pass filters, the two-dimensional DTCWT produces high-frequency sub-images in six directions, pointing to ±15°, ±45° and ±75°, which not only fuse the good time-frequency characteristics of DWT, but also have strong directivity. When using DTCWT algorithm to extract features, the redundancy between information will increase with the processing process. In addition, there more decomposition layers, the greater reconstruction error, the more obvious image distortion. To sum up, after repeated experimental exploration, the final choice is to decompose the sub-image into six-level wavelet.
The DTCWT feature model is shown F2(Eq. (17)) below. Among them, M j represents the mean of the high frequency coefficient features in the six directions on each layer of decomposition, and V j represents the variance of the high frequency coefficient features in the six directions on each layer of decomposition.
Thirty-five positive and negative samples were randomly selected for the experiment. After six-layer DTCWT decomposition, the statistical characteristics of high frequency coefficients in any direction of any layer, the comparison results of mean and variance are listed in Fig. 7.

The mean and variance distribution curve of high frequency coefficients of Sub-image.
In the figure, the abscissa is the number of samples, and the ordinate is the mean or variance corresponding to each sample. These points are connected in turn to form trend lines of mean and variance. Therefore, the statistical characteristics of DTCWT high frequency coefficients, i.e. mean and variance, can be selected as ROI characteristics.
The feature model in this paper considers the texture features and statistical characteristics of high frequency coefficient of DTCWT synthetically. The eigenvector F is shown in Eq.(20).where a F1 are texture features and F2 are statistical features of high frequency cofficients of DTCWT.
Algorithm 4 is applied for all sub-images in the database until each feature component is extracted separately. Next, the extracted features are subjected to feature optimization and ROI extraction.
1:
2: Read sub-images from image set;
3: Obtaining Texture Feature Components of Sub-images;
4: Obtaining statistical characteristics of high frequency coefficient of DTCWT;
5: Obtaining the fusing feature vector.
6:
7:
Genetic algorithm is a random search algorithm [41]. It can mimic the process of natural selection and inheritance to find the most suitable individual for the environment, that is, to find the optimized feature model that can obtain the best classification accuracy. The genetic algorithm has the characteristics of parallel processing data, wide application range and easy implementation. Therefore, the algorithm is used to select existing features and complete optimization. The process of feature selection optimization using GAS is shown in Algorithm2.
2:
4: Characteristics are inherited from the father to the next generation;
Parents with higher individual fitness produce offspring;
6: Obtaining the optimized feature model and its classification accuracy.
8:
10:
For the detection of microcalcifications, the most important step is to obtain an ROI containing microcalcifications. In this paper, the machine learning model is used to classify the sub-images with a binary classification of ROI containing microcalcifications and non-ROIs without microcalcifications. The next microcalcifications detection is performed for the ROI, and the subsequent processing is not performed for the non-ROI.
Extreme Learning Machine (ELM) is developed from a Single-hidden Layer Feedforward Neural Networks (SLFNs), and gradually developed into a generalized SLFNs [15], where the hidden layer does not need to be the same as the neural network. Compared with traditional machine learning, ELM has the advantages of great generalization performance and extremely fast learning speed. In addition, ELM is insensitive to the parameters set manually, which means that its setting speed is faster and more convenient [14].
ELM includes two processes: training and classification. In the training process, Algorithm3 is executed to get the parameters of the classifier <ω, b, β>. Then, the optimized capacities and features are inserted into the classifier, and then Algorithm4 is run. Finally, the final classification result D is obtained according to the trained parameters. D is a sub-image containing calcification points for subsequent segmentation detection.
A total of 400 sub-images as experimental data are used in this paper, including 200 sub-images with microcalcifications, 200 sub-images without microcalcifications. Among them, the training set and the test set are allocated by 9:1, 360 sub-images are used for training, and 40 sub-images are used for testing. This paper uses a 10-fold cross-validation method to evaluate the classification effect of ELM. For specific steps, see 5.2.1. Experiment A
Gold Standard Classification Results of Training Subimages T
Eigenvectors of Training Sub-Images F
Output: Parameters of ELM : ω, b, β
for i = 1 to L do
Randomly Generated Node Parameter(ω i , b i ).
3: end for
Calculating output matrix H of hidden layer nodes based on F;
Calculating β = H†T.
6: return <ω, b, β>.
Computing Hidden Layer Output Matrix H by F, ω, b;
Getting the result of the classification : D = H * β.
return D.
Microcalcifications detection
After classifying the ROI, we obtain sub-images containing microcalcifications. In this section, the detection of the microcalcifications clusters is accomplished by segmenting the classification results. In the microcalcifications detection part, three methods are used: Top-hat algorithm, wavelet transform, and combination of Top-hat operator and wavelet transform.
Top - Hat operator extracts the approximate shape in the image by using a certain form of structural elements to accomplish the purpose of image analysis [42]. The processing of the ROI is mainly to choose the open hat operator.The image after the operation is subtracted from the original image so that the structure that is eliminated in the open operation and is brighter than the background and smaller than the structural element appears.After the ROI processed by the top-hat operator, most of the background information in the image can be subtracted, thereby retaining the calcification information.The microcalcifications appear as discrete scattered points on the mammogram, similar to a circle.Based on the actual size of the calcifications,the ROI is treated by a planar disc-shaped structural element with a radius of 6 in this paper.
The wavelet transform method is another microcalcifications detection. The wavelet of the ROI of the breast region is decomposed by the db4 wavelet [8], and the wavelet coefficients of different layers are obtained. In the experiment, four-layer wavelet decomposition of ROI was carried out, and the results showed that the coefficient of the microcalcifications was mainly distributed on the third layer of high-frequency coefficient of wavelet decomposition, so we chose the third layer of high-frequency of wavelet for reconstructing for the best result.
The specific steps of the method combining Top-hat operator and wavelet transform are as follows:
First, performing an AND operation on the seed points obtained by the top-hat operator processing and the wavelet processing, respectively. Get the final seed point area. After the rough segmentation, the seed points obtained by the two methods are calculated and the final seed points are obtained. Finally, the region growing method [25] is used to segment the microcalcifications and complete the final detection. In order to improve the detection efficiency and to ensure the full growth of seed points in all directions, 8-neighborhood growth rule is utilized to end the growth when the growth stop condition is satisfied. The Fig. 8 shows the seed points obtained when using Top-Hat, wavelet transform and the combining Top-hat operator and wavelet transform method, respectively.
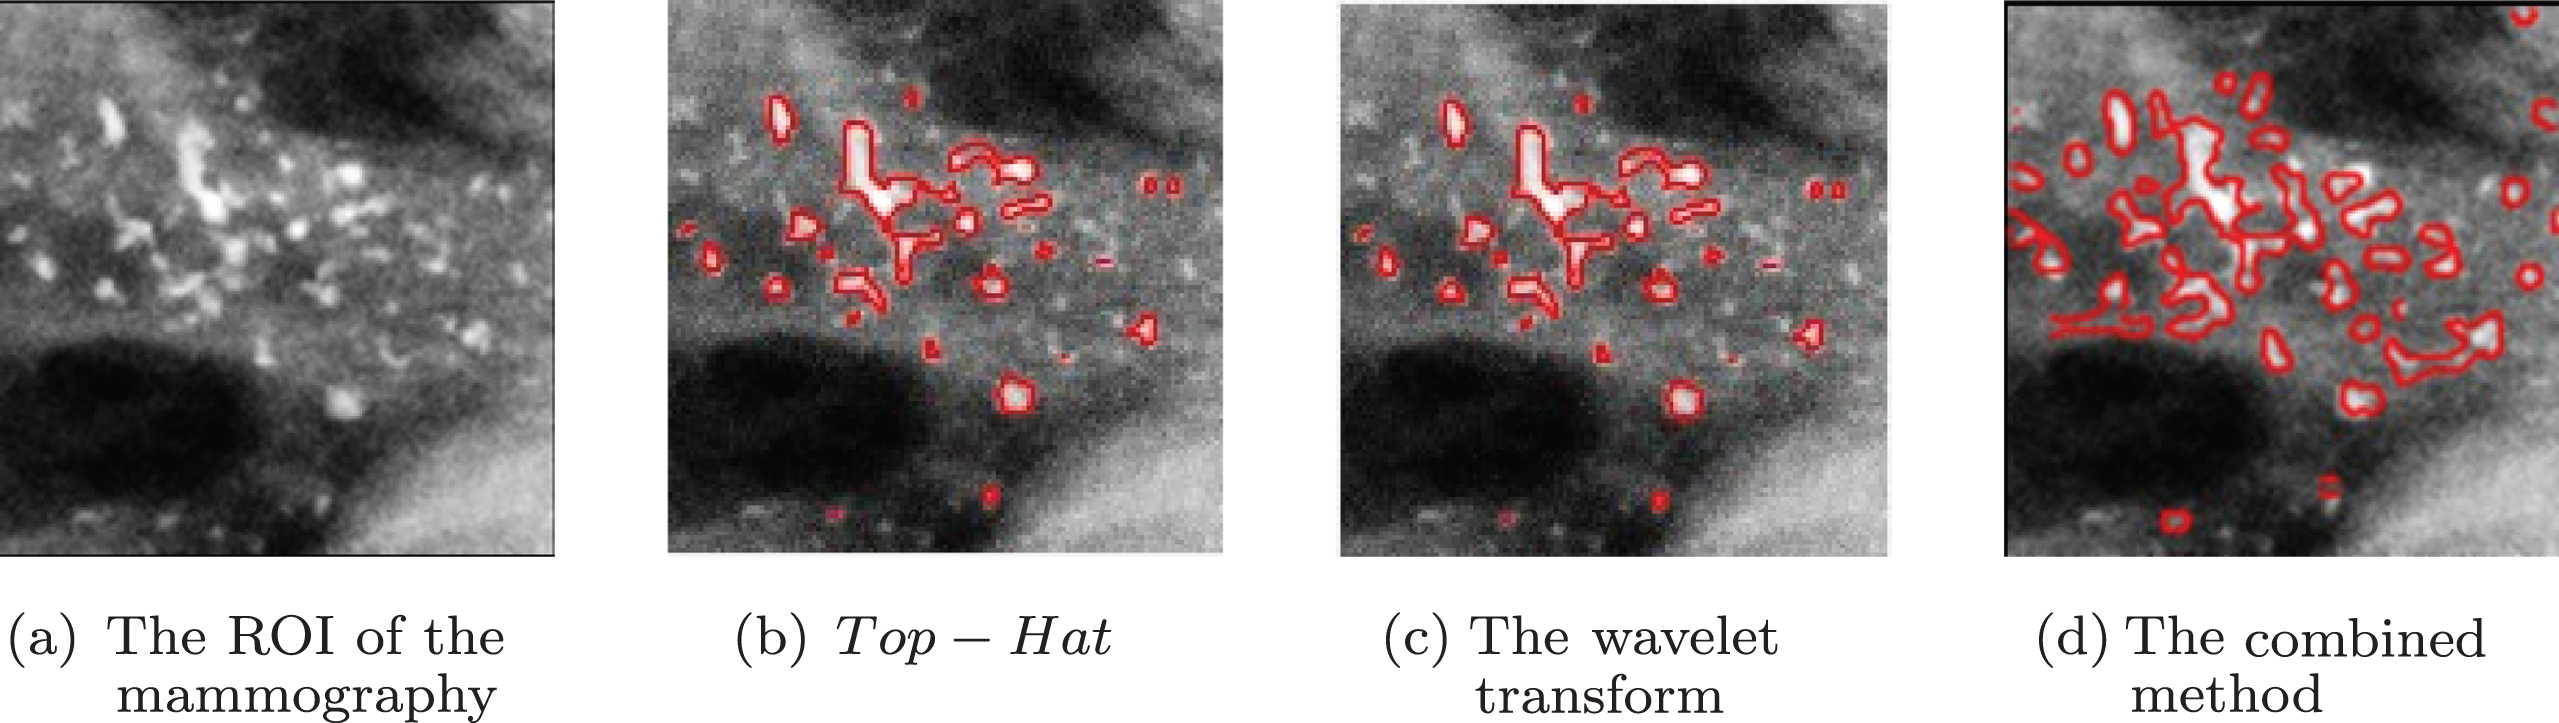
The result of obtaining seed points.
According to the different work content of the microcalcifications detection stage, two parts of experiment A and B were designed. Experiment A is the detection of ROI. Experiment B is the Precise segmentation of microcalcifications.
Evaluation standard
In Experiment A, it is mainly to complete the binary classification of ROI. The four feature models mentioned above are taken as input respectively, and ELM and SVM are used as classifiers respectively, and the output position contains a binary classification of the ROI of the microcalcifications and the non-ROI of the microcalcifications. Since Experiment A achieves the binary classification problem, the evaluation index of Experiment A is set to accuracy,sensitivity, specificity, TP Ratio and TN Ratio and ROC curve [3]. The calculation formula is shown in the Table 3 below.
Evaluation indices of ROI extraction
Evaluation indices of ROI extraction
TP (True Positive) is the number of positive samples (ROI) with microcalcifications that can be accurately detected. TN (True Negative) is the number of negative samples without microcalcifications that can be accurately detected. FN(False Negative) is the number of positive samples (ROI) with microcalcifications that cannot be accurately detected. FP (False Positive) is the number of negative samples without microcalcifications that cannot be detected accurately.
In Experiment B, the microcalcifications were segmented on the ROI to complete the precise positioning of the microcalcifications. Experiment B mainly uses FROC curve, the detection rate and the average number of false detections to evaluate the microcalcifications detection method used in this paper. The detection rate is sensitivity (percentage of the detected TP regions) and the average number of false detection is false-positive detection rate (how many FPs per image or per case).
Experiment A
In the ROI extraction part, we compare four feature models including texture features (T), DTCWT features (S), texture features and DTCWT feature combinations (TS), and texture features and DTCWT feature optimized by genetic algorithm (TS(GAS)). In the ROI extraction part, we selected two classifiers including ELM and SVM [37]. The specific experimental scheme and corresponding simplified labels are shown in Table 4.
Experimental scheme of ROI extraction
Experimental scheme of ROI extraction
The evaluation of the classification performance of the classifier is measured by the data of the evaluation indicators obtained after the 10-fold cross-validation. 400 sub-images were equally divided into 10 groups. The accuracy calculation process for each classifier is as follows: First, the sub-image of the first group is selected as the test set, and the rest of the group is used as the training set, thereby obtaining the accuracy of the sub-image classification of the first group.Then, the sub-images of the second group to the tenth group are respectively selected as the test set, and the corresponding other groups are used as the training set, thereby obtaining the accuracy of the sub-image classification of the second group to the tenth group. Finally, the accuracy of the classifier is obtained by calculating the average of the accuracy obtained by the ten sets of experiments. Similarly, other evaluation metrics used to evaluate the classification performance of the classifier are also obtained by a 10-fold cross-validation.
When verifying the superiority of the four models(T, S, TS, TS(GAS)), the parameters of the genetic selection algorithm used in the process of feature selection optimization process are the number of initial features N, genetic algebra G and individual fitness threshold S. In the experiment, according to the fusion eigenvector model proposed in this paper, N is 83, G is 100 and S is 80%.
In the ROI classification experiment based on SVM, the parameters involved are kernel function R, penalty coefficient C and kernel function parameter g. RBF is chosen as kernel function R. Through many parameter adjustment experiments, C is 0.5 and G is 0.0206.
In the ROI classification experiment based on ELM, the parameters involved are the excitation function S and the number of hidden layer nodes L. In the experiment, the excitation function R is chosen as sigmoid. Through repeated experiments, the number of hidden layer nodes L is set to 1000.
When verifying the superiority of the two classifiers ELM, and SVM. On one hand, different number of sub-images are selected as training sets to experiment on ELM and SVM classifiers respectively to verify the effectiveness of the classifier in time. On the other hand, based on ELM and SVM classifiers, experiments are carried out under four different eigenvector models, namely T, S, TS, TS (GAS), and to compare their performance.
From the results of experiment A, the TS (GAS) feature model proposed in this paper has achieved good results in terms of accuracy, specificity and sensitivity in ROI extraction. So in Experiment B, select the ROI extracted from the TS (GAS) feature model to segment the microcalcifications to complete the microcalcifications detection. Three different methods were used for the detection of microcalcifications, including the Top-hat, the Wavelet transform and the combined method. The FROC curve, detection rate and average number of false detection were mainly used to evaluate the microcalcifications detection method used in this paper.
Result analysis
The results of experiment A are shown in the following figures and tables. Table 5 shows the performance of four different models in ROI extraction based on five evaluation criteria in different classifiers. Among them, E represents the five different evaluation indicators, C represents the two different classifiers, and F represents the four different eigenvector models for the classification experiments.
Evaluation results of each experimental scheme
Evaluation results of each experimental scheme
In order to reflect the data more intuitively, we drew the columns of Fig. 9 and Fig. 10 based on SVM and ELM respectively. The time performance comparison between ELM and SVM is shown in Fig. 11.

Evaluation indexes based on SVM.
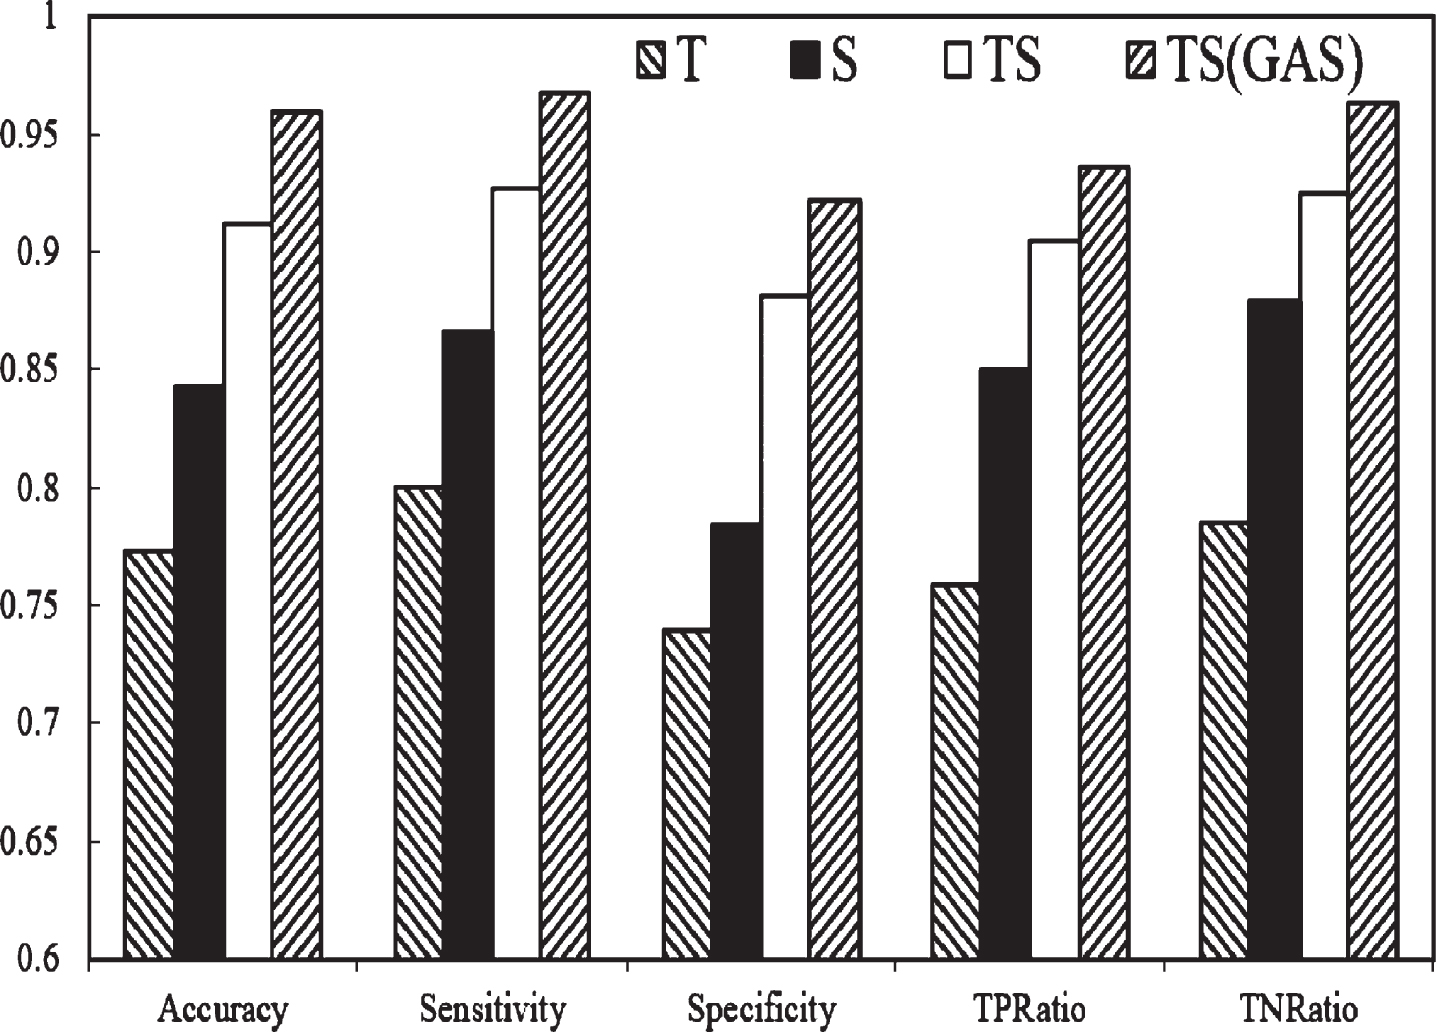
Evaluation indexes based on ELM.
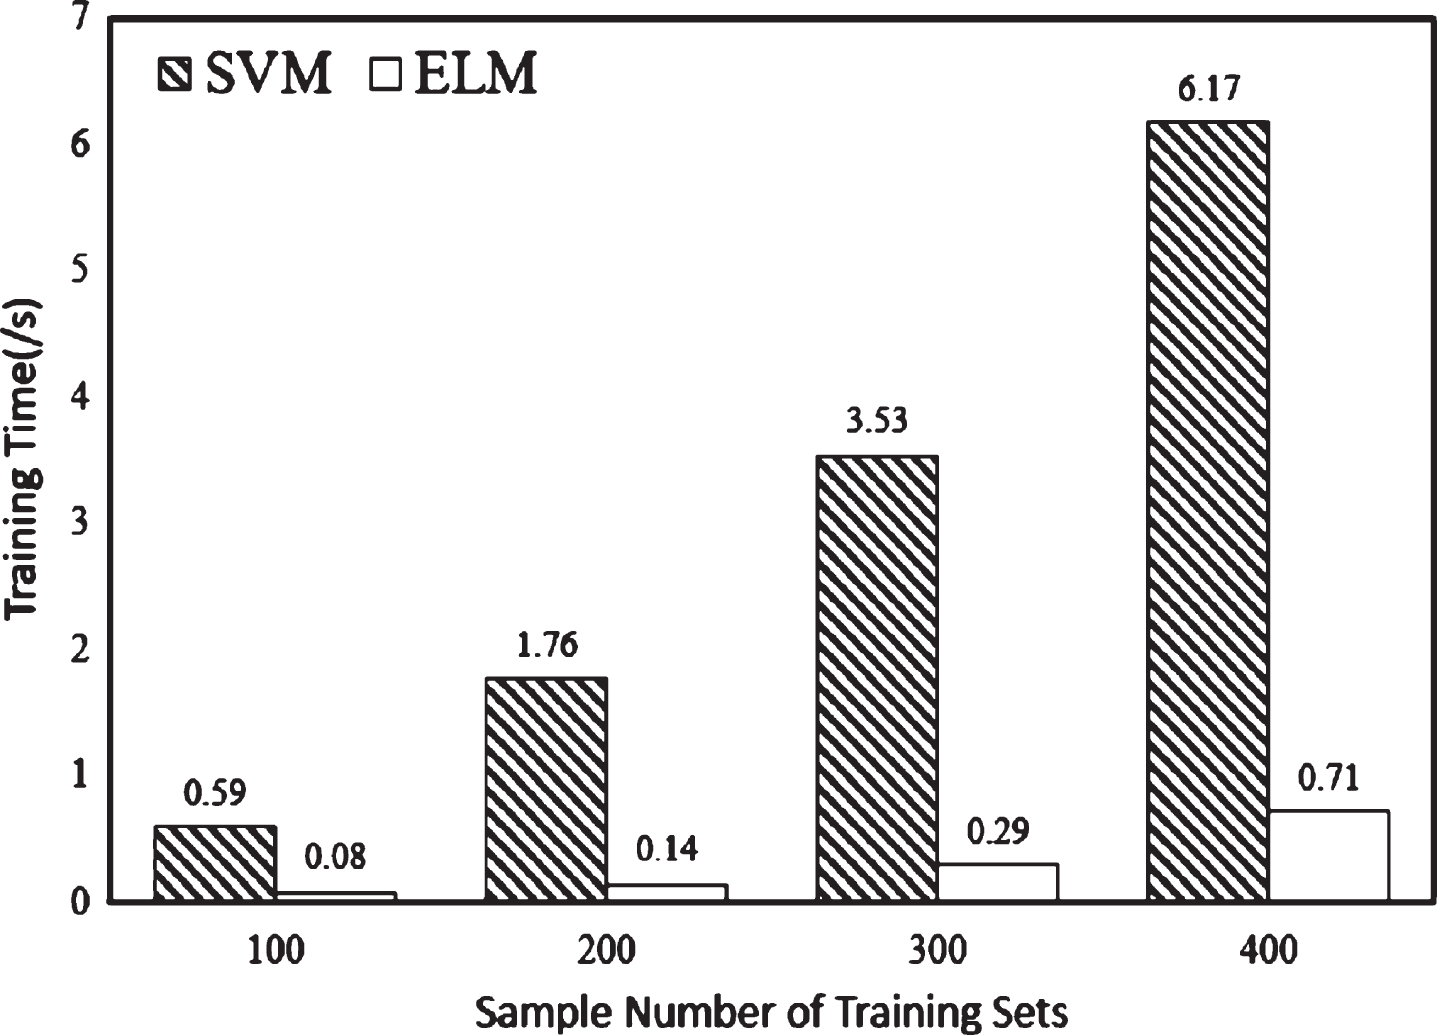
Relationship between training data size and training time.
The ROC curves of ELM and SVM ROI classification results are shown in Fig. 12 under the four different eigenvector models of T, S, TS and TS (GAS).

ROC Curve Of different feature model.
The results of experiment B are shown in the following table. Figure 13 below shows the FROC curves of the three methods. The data of experiment B is the ROI extracted by the proposed TS(GAS) model in this paper. Table 6 shows the performance of three different methods in microcalcifications detection. When the Top-hat method was used for microcalcifications detection, the sensitivity was 89.6%, and the false positive detection rate was 2.6. When the wavelet transform method was used for microcalcifications detection, the sensitivity was 91.1%, and the false positive detection rate was 3.28. When the combined method was used for microcalcifications detection, the sensitivity was 86.7%. Although the sensitivity was slightly lower, the false positive detection rate was reduced to 1.35.

FROC curve cf different segmentation method.
The results of microcalcifications detection
Depending on the needs, appropriate methods are selected for microcalcifications detection. If higher sensitivity is needed, you can use the combination of proposed TS (GAS) feature model and wavelet transform. If you need a low false positive detection rate, you can use the combination of the proposed TS (GAS) feature model and the third detection method.
In the detection of breast microcalcifications in this paper, the image denoising and image enhancement of the mammography image are first performed. The four methods of gray-scale transformation, histogram equalization, wavelet transform, the NSCT, and the proposed method are used to enhance the image. It is found that the combined method is the best.
In the ROI extraction part, four models of T model, S model, TS model, and TS (GAS) model were constructed for ROI extraction. The results show that the TS (GAS) model proposed in this paper has the highest accuracy. The accuracy, sensitivity, specificity, positive accuracy and negative accuracy of the TS(GAS) model were 95.92%, 96.71%, 92.20%, 93.65%, 96.33%, respectively.
In the detection of microcalcifications, the ROI extracted based on the TS (GAS) model is used as data, and three methods are used to detect the microcalcifications. When the Top-hat method was used for microcalcifications detection, the sensitivity was 89.6%, and the false positive detection rate was 2.6. When the wavelet transform method was used for microcalcifications detection, the sensitivity was 91.1%, and the false positive detection rate was 3.28. When the combined method was used for microcalcifications detection, the sensitivity was 86.7%. Although the sensitivity was slightly lower, the false positive detection rate was reduced to 1.35.
Disclosure statement
The work described has not been published previously in any form. All authors declare that they have no competing interests. There are no financial or personal relationships with other people or organisations that could inappropriately influence our work.
Funding
This work was supported in part by the National Natural Science Foundation of China (Nos. 61472069, 61402089 and U1401256), China Postdoctoral Science Foundation (Nos. 2019T120216 and 2018M641705), the Fundamental Research Funds for the Central Universities (Nos. N161602003, N180408019 and N180101028), the CETC Joint Fund, the Open Program of Neusoft Institute of Intelligent Healthcare Technology, Co. Ltd. (No. NIMRIOP1802), and the fund of Acoustics Science and Technology Laboratory.