
Abstract
BACKGROUND:
Breast cancer is one of the most important malignant tumors among women causing a serious impact on women’s lives and mammography is one the most important methods for breast examination. When diagnosing the breast disease, radiologists sometimes may consult some previous diagnosis cases as a reference. But there are many previous cases and it is important to find which cases are the similar cases, which is a big project costing lots of time. Medical image retrieval can provide objective reference information for doctors to diagnose disease. The method of fusing deep features can improve the retrieval accuracy, which solves the “semantic gap” problem caused by only using content features and location features.
METHODS:
A similarity measure method combining deep feature for mammogram retrieval is proposed in this paper. First, the images are pre-processed to extract the low-level features, including content features and location features. Before extracting location features, registration with the standard image is performed. Then, the Convolutional Neural Network, the Stacked Auto-encoder Network, and the Deep Belief Network are built to extract the deep features, which are regarded as high-level features. Next, content similarity and deep similarity are calculated separately using the Euclidean distance between the query image and the dataset images. The location similarity is obtained by calculating the ratio of intersection to union of the mass regions. Finally, content similarity, location similarity, and deep similarity are fused to form the image fusion similarity. According to the similarity, the specified number of the most similar images can be returned.
RESULTS:
In the experiment, 740 MLO mammograms are used, which are from women in Northeast China. The content similarity, location similarity, and deep similarity are fused by different weight coefficients. When only considering low-level features, the results are better with fusing 60% content feature similarity and 40% lesion location feature similarity. On this basis, CNN deep similarity, DBN deep similarity, and SAE deep similarity are fused separately. The experiments show that when fusing 60% DBN deep feature similarity and 40% low-level feature similarity, the results have obvious advantages. At this time, the precision is 0.745, recall is 0.850, comprehensive evaluation index is 0.794.
CONCLUSIONS:
We propose a similarity measure method fusing deep feature, content feature, and location feature. The retrieval results show that the precision and recall of this method have obvious advantage, compared with the content-based image retrieval and location-based image retrieval.
Introduction
Breast cancer, one of the most common malignancies among women today, cannot be ignored in any country [1]. In 2018, the survey from GLOBOCAN showed that breast cancer ranks first in female incidence, accounting for 24.2% (global) and 16.5% (China) of female cancer population, which has been called “the NO.1 killer of women" [2]. In clinical diagnosis, early detection and early treatment is an important step in the treatment of breast cancer. In many kinds of examination methods, compared with ultrasound and MRI, mammography has been widely recognized as the most effective and important method for breast cancer detection and diagnosis [3, 4].
When diagnosing the breast disease, radiologists sometimes may consult some previous diagnosis cases as a reference, especially for those green hands. But there are many previous cases and it is important to find which are the similar cases, which is a big project costing lots of time. According to the survey, medical image retrieval can effectively find relevant medical images which have been diagnosed from a large number of medical images. These similar images can provide reference information for the radiologists to diagnose. As a image retrieval method, Content-based Medical Image Retrieval (CBMIR) is proposed. This method mainly extracts the content-based image features, such as morphological and texture features, to describe images. Moreover, because the breast mass may merge or infiltrate with the lymphatic system or the surrounding breast tissue, the incidence location of the breast lesion in the mammary has potential regularity. A method combining content features and lesion location features is proposed [5], which proves that the lesion location information is a supplement of content features and the method of combining content features and lesion location features can improve the retrieval precision and recall.
However, due to the complexity of images, the information contained in the medical image understood by the user may be inconsistent with the visual feature information of the image itself, which can cause semantic gap. Both content features and lesion location features can be regarded as the low-level features. Because low-level features have limitations in mammograms and it is difficult to express radiologists’ understanding of query semantics, a similarity measure method fusing deep feature for mammogram retrieval is proposed.
Related work
When diagnosing the breast disease, radiologists sometimes may consult some previous diagnosis cases as a reference. But there are many previous cases and it is important to find which cases are the similar cases, which is a big project costing lots of time. Medical image retrieval can provide objective reference information for doctors and Content-based Medical Image Retrieval is a very important method in the field of image retrieval. The development of CBMIR can be traced back to Content-based Image Retrieval (CBIR) which was proposed in the 1990s for commerce or research. Query By Image Content (QBIC) researched by IBM corporation mainly extracts the color, texture, and shape features of the image. It meets the user’s query needs by dimension reduction and high-dimensional indexing technology [6]. Massachusetts Institute of Technology develops photobook [7], which includes shape-based image retrieval, texture-based image retrieval and facial feature-based image retrieval. Columbia University develops the system named Visual SEEK [8], which extracts the features of the color set and wavelet transform, and it contributes to the query based on spatial relationships. The university of Illinois at Urbana-Champaign proposes the Multimedia Analysis and Retireval System (MARS) using feedback technology [9]. Purdue University proposes a system called ASSERT [10], which is used for lung CT images retrieval.
In the field of CBIR, some researchers have contributions in image feature extraction, similarity measure, and feature fusion. Pradeep et al [11] propose to store the medical images and the related information together, and extract texture features using gray level co-occurrence matrix to realize medical image retrieval. Patel et al [12] propose a new image retrieval method based on the combination of color, shape and texture features. Wankhede et al [13] extract the low-level features and high-level features of video images, and use annotation based image retrieval technology (ABIR) to give the input in the form of image query and text query.
The research of image retrieval in this paper mainly focuses on mammograms. Oliveira et al [14] propose a image retrieval method based on breast density and they use two-dimensional principal component analysis method to reduce the feature dimension. Wei et al [15] use the lesion shape and edge features of breast images, and use weighted similarity measure method to design an image retrieval system. Chandy et al [16] also propose a retrieval method using four statistical texture features based on the horizontal gray statistical matrix. Liu et al [17] propose a scalable breast image retrieval system, using the CBMIR system of the unsupervised hash algorithm to compress the image into binary and calculate by Hamming distance.
Also, many researchers study on image retrieval, but there are still some problems to be solved, such as how to build a high-level semantic understanding between images and human-beings, which is called “semantic gap" problem. In recent years, the development of deep learning can solve this problem effectively by combining low-level features to form abstract high-level categories or feature sets to discover the data distribution feature.Lin et al [18] propose a CBIR system based on large quantity of data, using features extracted by deep learning method to replace low-level image features.
Methods
Because radiologists sometimes may consult some previous diagnosis cases as a reference and medical image retrieval can search for the relevant image cases for radiologists quickly, a method that fuses the location features, the content features, and the deep features is applied to mammogram retrieval in this paper. This method can search for some images which are similar to the query image in the dataset, which can save radiologists’ time. First, one image is chosen randomly from the dataset, which is defined as the query image. The other images are called dataset images. Then, we turn over these images to the same view and image pre-processing is performed on all these images, including denoising, enhancement, and chest muscle removal. Next, the content features can be extracted from the images after pre-processing. In order to obtain the location features, lesion segmentation and image registration are performed to get the normalized lesion location information. The Convolutional Neural Network (CNN), the Stacked Auto-encoder Network (SAE), and the Deep Belief Network (DBN) are built to extract the deep features, which are regarded as high-level features. After that, three kinds of similarities are calculated respectively. The content similarity and deep similarity are calculated by the Euclidean distance between the query image and the dataset images. The location similarity is obtained by calculating the ratio of intersection to union of the mass regions. Finally, the deep feature similarity, the content feature similarity, and the location feature similarity are fused to obtain the image fusion similarity. The similarities of different images are sorted from high to low and the specified number of the most similar mammograms can be returned according to the image fusion similarity. At the same time, we can get the diagnosis reports of these returned mammograms from the dataset.
In order to get the most similar images, we turn over the mammograms to the same direction (either right or left) at first. Taking one left MLO mammogram as an example, the process is shown in Fig. 1.
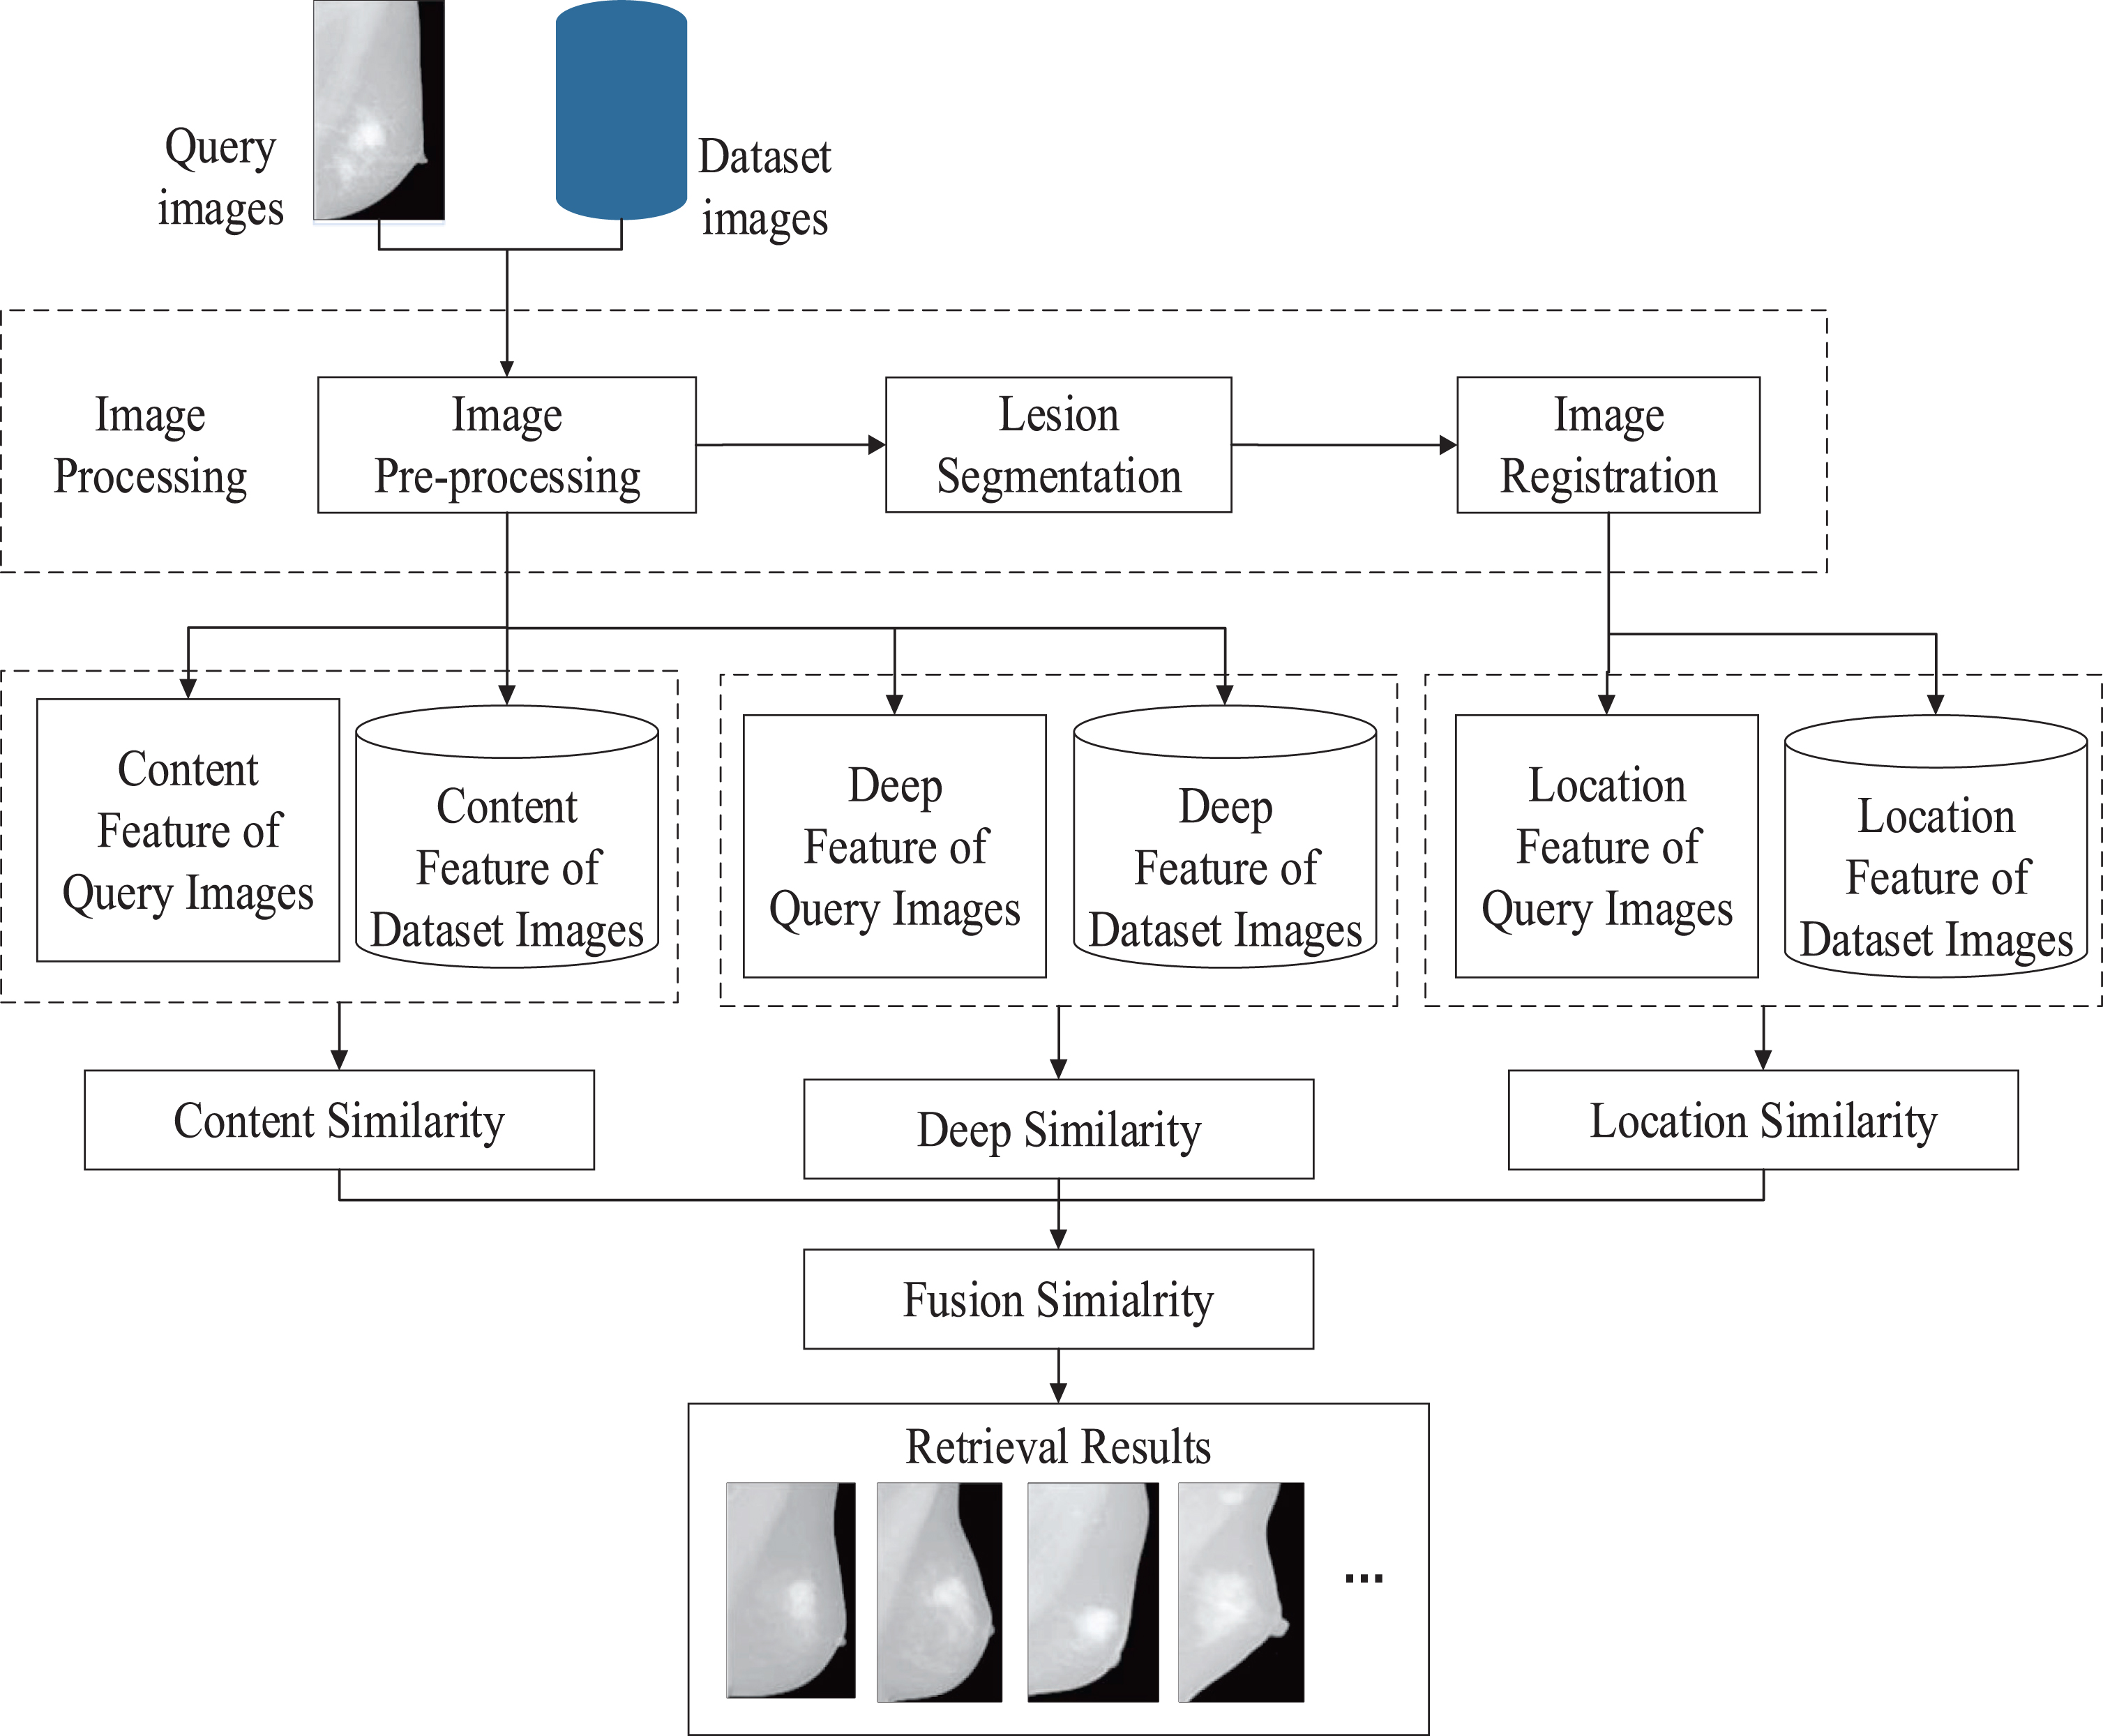
Process of mammogram retrieval.
In the process of mammogram retrieval, image processing is important, which can reduce the influence of noise and irrelevant tissue on the breast image. Image processing mainly includes image pre-processing, lesion segmentation, and image registration. After image pre-processing, content feature and deep feature can be extracted. And lesion segmentation and image registration are the basis for extracting the lesion location features of the image.
In order to retrieve and obtain the most similar cases, we turn over all the mammograms to the same direction (either right or left) at first. Then, image pre-processing is performed, including image denoising, image enhancement, and chest muscle removal. We use a typical median filter [19] to denoise the image and the contrast enhancement method [20] is used for image enhancement. The Hough transform is used to detect the line [21], which is the chest wall line, and the external muscle of chest wall line is removed [5].
A multi-threshold segmentation method (Multi-Otsu) [22] is used for lesion segmentation. We select the largest of the nine thresholds for segmentation [5]. We find that the 9th threshold (the largest) in the experiment has the best segmentation effect.
About image registration, one image is selected and defined as the standard image and we register the query image and the dataset images to this standard image in order to get normalized location information. First, Canny edge detection operator is used for detecting the breast contour. Next, Coherent Point Drift (CPD) [23] is used to register the breast contour for image registration and a transformation matrix T is obtained. Later, the transformation matrix T is also used to normalize the lesion location information of different images to the standard image in order to reduce the error [5].
Moreover, the method we proposed is suitable for both CC mammogram and MLO mammogram, but the experiment of using CC mammograms is slightly easier due to the fact that chest muscle removal is an unnecessary process on the CC image. After retrieving the similar MLO images, we can get the corresponding CC images by patients’ information directly because every patient usually saves a set of mammograms at the same time including left CC, left MLO, right CC, and right MLO. Therefore, MLO mammograms are used in our experiment. The dataset we used includes the mammograms and the relevant diagnosis reports offered by radiologists.
Low-level feature extraction
Low-level features extracted in this paper mainly include the content features and the lesion location features. According to image retrieval methods, the content feature is widely used expressing the image content information, such as shape, color, and texture information. In this paper, Grey-Level Co-occurrence Matrix (GLCM) [24], Tamura [25, 26], Hu Moment Invariants [27], and Gray Level Histogram [28] are used to extract the content features. Equation (1) is the model of content features, where C1 is GLCM feature, C2 is Tamura feature, C3 is Hu Moment Invariant feature, and C4 is Gray Level Histogram feature.
The location feature express the lesion location information, which can help to retrieve the similar mammograms that have the lesion in the same position on the images. In the stage of lesion segmentation and image registration, we obtain the lesion region, breast contour, and the transformation matrix T. Regarding the lesion as a circle approximately, the center and radius of the circle express the lesion location information. In order to get normalized lesion location feature, the center and radius of the circle of the mammograms are registered to the standard image using CPD method and the transformation matrix T obtained. Equation (2) shows the model of location feature. R is radius and P is standard center [5]. Fig.2 shows the result of image registration. Fig.2 (a) is the standard image and the blue line is the breast contour. Fig.2 (b) shows the approximate lesion circle on the mammograms. Fig.2 (c) shows the process of breast contour registration. The blue line is the breast contour of the standard image. The yellow line is the mammogram breast contour. The red line is the registered contour. Fig.2 (d) shows the process of approximate lesion circle registration and the red circle is the registered lesion region.
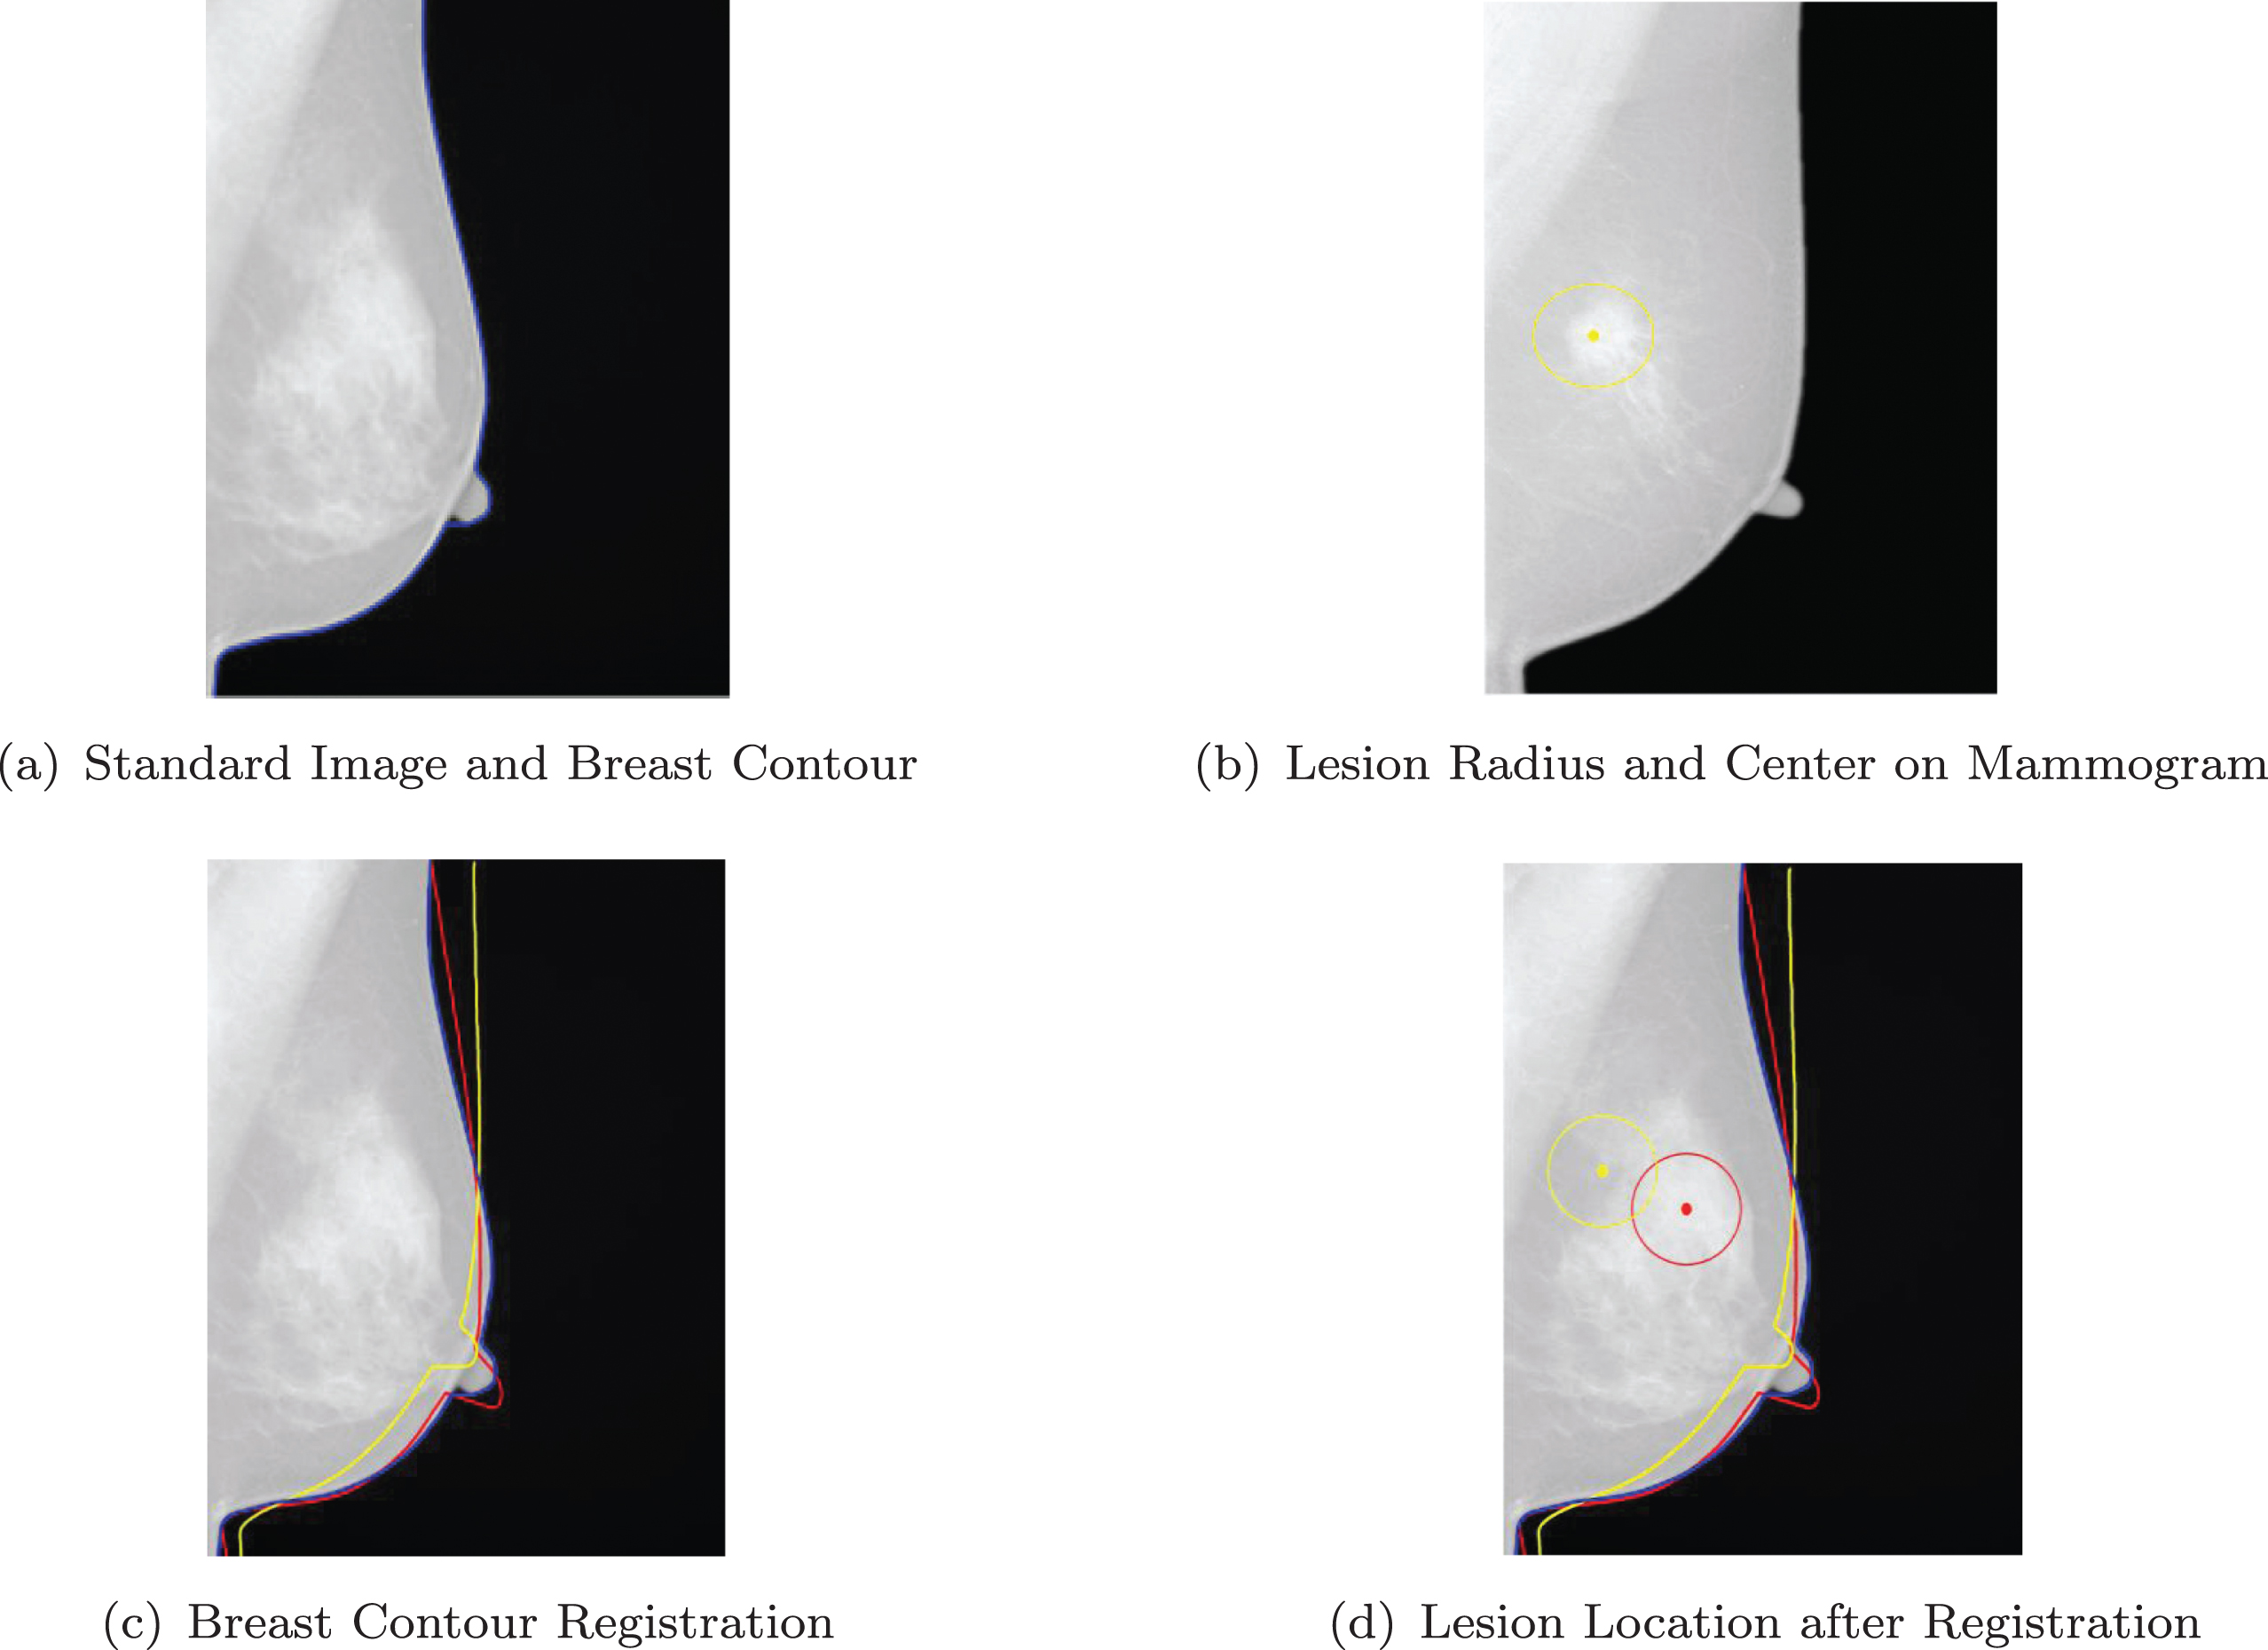
Image registration and location feature extraction.
Although content-based and lesion location-based medical image retrieval can search for the similar images, low-level features may lead to “Semantic Gap" problem. Thus, a high-level feature is necessary which is the deep feature extracted based on deep learning method. In this paper, three kinds of deep features are extracted, including CNN, DBN, and SAE to achieve mammogram retrieval.
Modeling of deep feature based on CNN
CNN consists of multiple layers and each layer consists of independent neurons. CNN has the ability of learning features hierarchically [29]. Features extracted based on CNN are better than the content features in discrimination and generalization ability [30]. When using CNN to extract features, the process of convolution and sampling is shown in Fig. 3.
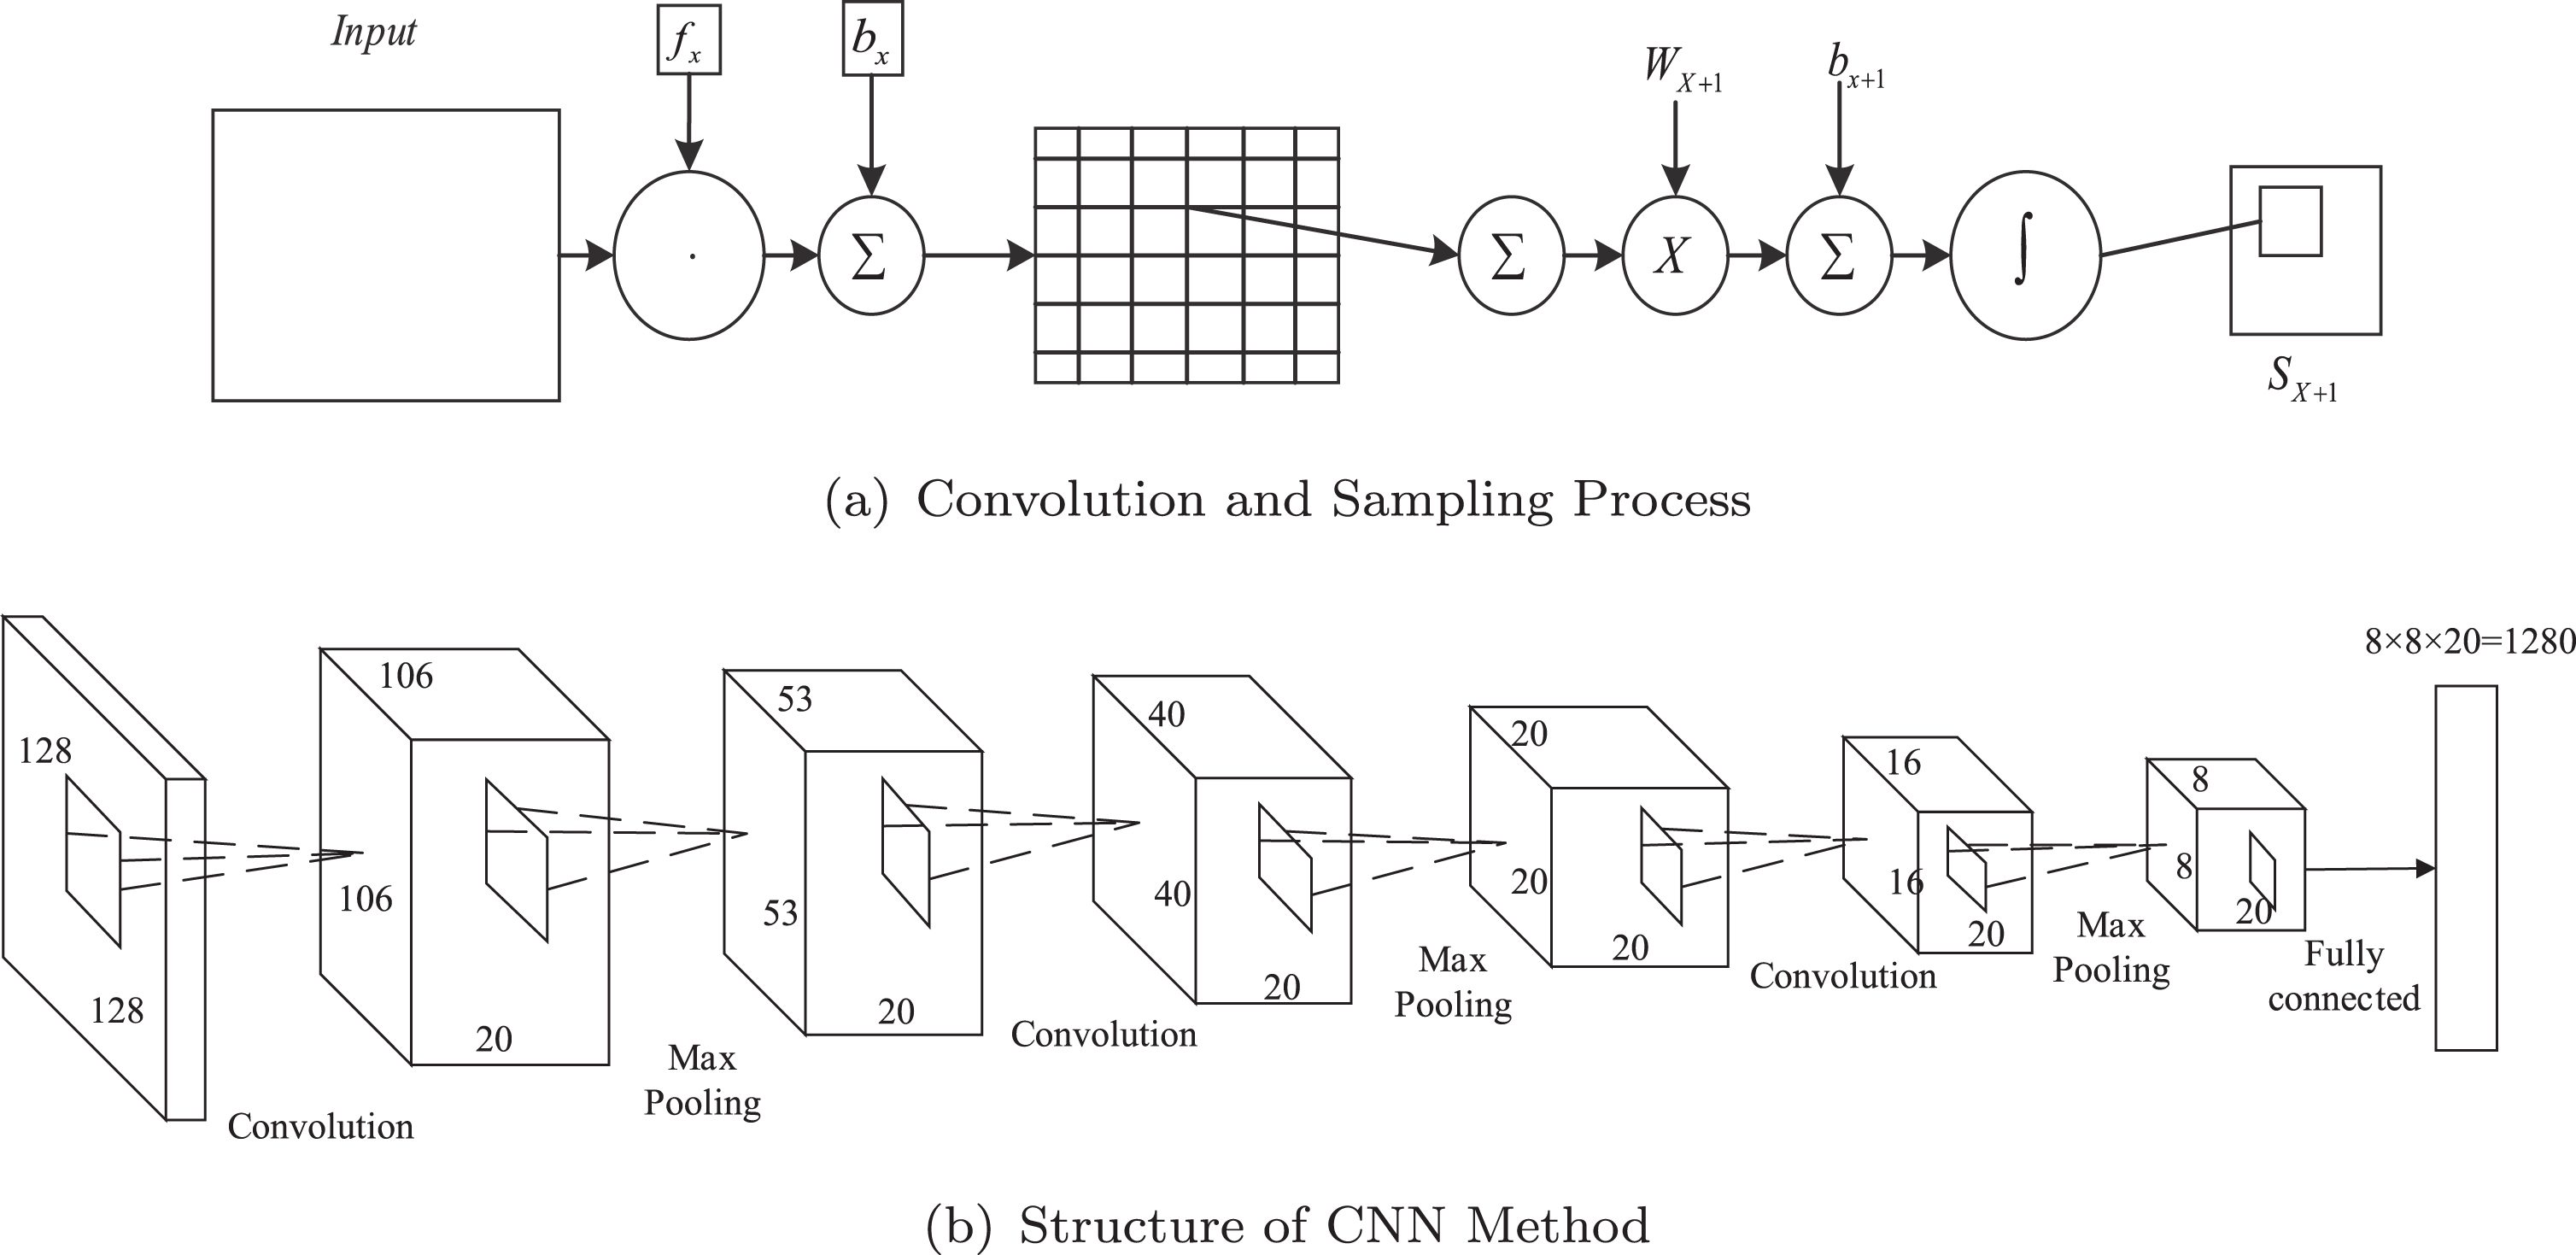
Feature structure graph based on CNN.
During the convolution process, the filter f x is used to perform convolution operation and b x is the bias. The convolution function is represented by Equation (3). The four pixels in every neighborhood window are summed and one pixel obtained by summation is weighted by Wx+1. Bias bx+1 is added and a function sigmoid is used for activation. Then, a special map Sx+1 is obtained.
In this paper, the lesion image with size 128 × 128 is chosen as the input and three layers are designed. Every layer include one convolution layer and one sampling layer. The first layer consists of C1 convolution layer and S1 down-sampling layer. C1 convolution layer consists of 23 × 23 × 20 filter with a step size of 1, so the output size is 106 (128-23 + 1 =106) and deep is 20. Then, we use a 2 × 2 size down-sampling layer S1 and the output is 53 × 53 × 20. Similarly, the second layer consists of C2 convolution layer and S2 down-sampling layer. C2 convolution layer consists of 12 × 12 × 20 filter and 20 feature maps with size 40 × 40 are obtained. After down-sampling layerS2, 20 feature maps with size 20 × 20 are obtained. After the third layer, C3 convolution layer and S3 down-sampling layer, 20 feature maps with size 8 × 8 are obtained. Finally, a 1280-dimensional vector (20 × 8 ×8 = 1280) is obtained by the fully connected layer. The process is shown in Fig.3(b).
The auto-encoder is an unsupervised learning method which can learn features from unlabeled input data. Sparse auto-encoder is a neural network containing the input layer, the hidden layer, and the output layer. The input layer and the hidden layer make up a encoder. The hidden layer and the output layer make up a decoder. The encoder output is the decoder input. In order to ensure that the auto-encoder output can express the original data accurately, the key feature is existent in this network and it is the hidden layer. However, the features learning from shallow neural network is limited, so we need to stack multiple auto-encoders to generate a deep neural network. After layer stacking, the output of the previous layer is used as the input to the next layer. In this way, the stack auto-encoder is obtained [31] and it is used to extract SAE deep feature.
The stack auto-encoder used in this paper is made up of three sparse auto-encoders. The input mammogram has the size of 128 × 128. The first sparse auto-encoder has 16,384 input layer nodes, 7,000 hidden layer nodes, and 16,384 output layer nodes. The second sparse auto-encoder has 7,000 input layer nodes, 3,000 hidden layer nodes, and 7,000 output layer nodes. The third sparse auto-encoder has 3,000 input layer nodes, 1,000 hidden layer nodes, and 3,000 output layer nodes. The mammogram is the input of the first sparse auto-encoder. The hidden layer of the first sparse auto-encoder is the input of the second sparse auto-encoder and the hidden layer of the second sparse auto-encoder is the input of the third sparse auto-encoder. And the hidden layer of the third sparse auto-encoder is the SAE deep feature of the mammogram. The SAE is reconstructed by back propagation algorithm as shown in Fig.4 and Feature III is the deep feature extracted by SAE.
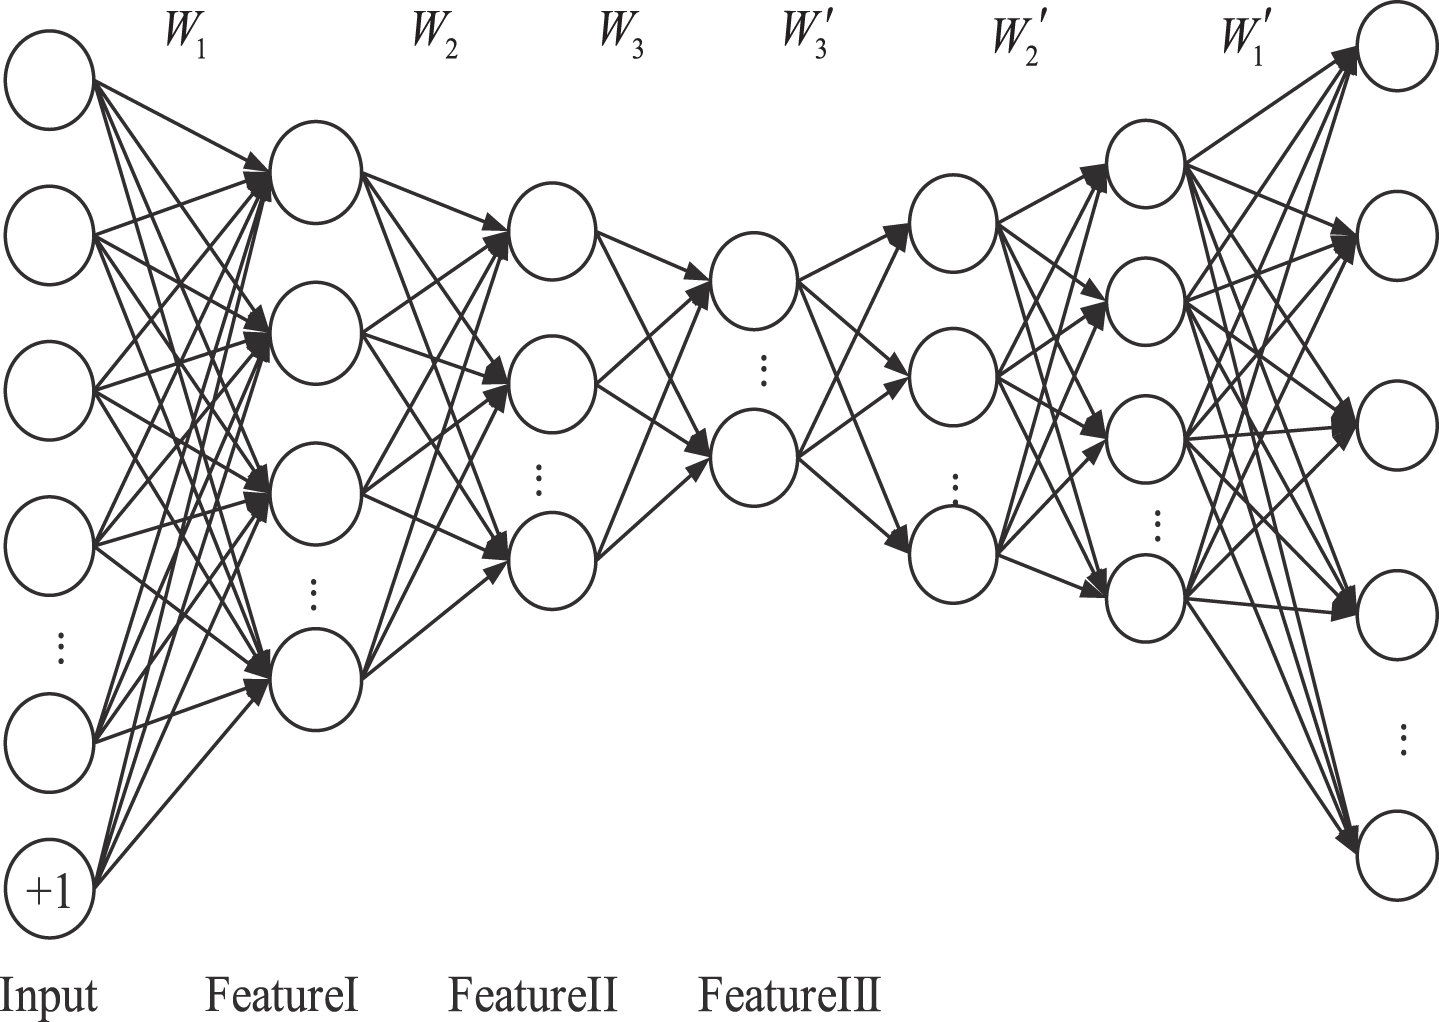
Feature structure graph based on tuned SAE.
DBN consists of the visible units and the hidden unit, which are used to input the data and extract features respectively.The component unit of the deep belief network is the restricted boltzamnn machine (RBM), which is a typical random neural network [32] and a fast learning algorithm is proposed [33] using the contrastive divergence to train RBM.
The typical DBN is composed of multiple RBM. From the bottom to the top, each adjacent two layers are composed of one RBM. The first visible unit of RBM has 16,384 neurons and the hidden unit has 7,000 neurons. The second visible unit of RBM has 7,000 neurons and the hidden unit has 3,000 neurons. The third visible unit of RBM has 3,000 neurons and the hidden unit has 1,000 neurons. DBN is constructed by pre-training and tuning as shown in Fig.5. The mammogram is the input of this network and h3 is the deep feature.

Feature structure graph based on tuned DBN.
In order to improve the performance of image retrieval, the low-level features and deep features are both extracted. The fusion feature vector is established as Equation (4), combining the content feature, location feature, and deep feature.
The processing of establishing fusion feature model is shown as algorithm 1. First, the mammogram is read as the input (line 2). Then, the image is pre-processed (line 3). Next, the content feature, location feature, and deep feature are extracted respectively (line 4-6). After that, the content feature, location feature, and deep feature are fused to obtain the image fusion feature (line 7). Finally, loop this process to obtain the features of all mammagrams and return the result F cd .
1:
2: Reading the mammogram.
3: Image Preprocessing.
4: Extracting the content feature.
5: Extracting the location feature.
6: Extracting the deep feature.
7: Obtaining the image fusion feature.
8:
9:
Image retrieval depends on the similarity measure and the similarity measure is the calculation of the image feature vector. The closer the distance between feature vectors, the more similar the two images are.
The content feature similarity LC is calculated by Equation (5) using the Euclidean distance algorithm. A and B are two mammograms to be similarly measured. a i is the feature of A and b i is the feature of B. n is the dimension of the feature vector. Thus, the content feature similarity result (LC1, LC2, . . . , LC N ) can be obtained. LC N is the Euclidean distance result between the query image and the N th dataset image. Then, rank the similarity measure results increasingly and give the image label (Cord1, Cord2, . . . , Cord N ). The smaller the similarity measure results, the more similar the images are.
In the same way, the deep feature similarity LD is also calculated by Equation (5). The deep feature similarity result (LD1, LD2, . . . , LD
N
) can be obtained. Rank the similarity measure results increasingly and give the image label (Dord1, Dord2, . . . , Dord
N
).
The location feature similarity LP is calculated by Equation (6). C
in
is the intersection of the approximate lesion circles of the query image and the dataset image. C
un
is the union. C
in
and C
un
can be calculated by the radius R and center P of the circle. The location feature similarity is the ratio of intersection to union of the lesion regions. Thus, the location feature similarity result (LP1, LP2, . . . , LP
N
) can be obtained. Rank the similarity measure results increasingly and give the image label (Pord1, Pord2, . . . , Pord
N
).
In the process of calculating the fusion similarity, a score is added. After ranking the similarity measure results increasingly, a group of similar images can be returned which are put in order based on the similarity. According to the position of this group of images, these images are given a score separately called encouragement value (EV). Then, an integrated encouragement value (IEV) can be obtained by weighting. Ranking IEV increasingly, a query image sequence can be obtained. This sequence includes both the returned similar images and their order numbers. The IEV is calculated by Equation (7), Equation (8) and Equation (9). W
i
is the weight of EV. d
i
(x, y) is the similarity measure result of the query image x and dataset image y based on the i
th
feature. score
i
(x, y) is the EV of similarity measure of the query image x and dataset image y based on the i
th
feature. score (x, y) is the IEV.
According to the content, the location, and the deep feature of mammogram retrieval, the experiment data is introduced, The experiments was conducted and the result is shown and discussed below. Four kinds of experiments were conducted on different values of weight. Then the results from different experiments are compared and discussed with the evaluation standard.
Experiment data
In this paper, 740 mammogram cases are used as the dateset, including 740 MLO mammograms and the relevant diagnosis reports of these mammograms. In the experiment, one breast image is chosen as the query image and the rest are the dataset images. Every image has an expected ranking sequence which includes some mammogram cases which are similar to this query image. These similar cases in the expected ranking sequence are selected and ranked by the experienced radiologists.
About the expected ranking sequence for every query image, five radiologists select and rank the mammogram cases independently in advance. First, every doctor confirms 15 most similar images and ranks these 15 cases based on the diagnosis result and image similarity. The most similar image ranks top 1 and it has 1 score. The last image is the 15th and it has 15 scores (Other mammograms not in the rank has the 16 scores.) Thus, 75 cases are obtained, but some cases may be repeated and some different cases may have the same score. For these 5 ranks of five radiologists, add the score of the same image to get a total score. The image with minimum total score is admitted as the most similar mammogram. The image with the 2nd less score is admitted as the 2nd similar mammogram. If the total score is same, 5 radiologists will determine together. In this way, a similar image sequence of one query mammogram is obtained and we name this sequence as the expected ranking sequence. The images in this sequence form an expected image set and it is defined as T.
All the mammograms used are from Northeast Chinese patients, taken by Senographe 2000D full digital mammography camera. The patient samples are taken from August in 2005 to March in 2007 and the patients are women aged between 31 and 73. Every patient has a set of mammograms, including CC and MLO mammograms of bilateral breasts (left CC, left MLO, right CC, and right MLO), but we use 740 MLO mammograms (both right and left) in our experiment to search for the similar images (when finding one’s MLO image, we can obtain her CC image by the patient information directly). Among these images, 384 mammograms have masses and 356 mammograms are normal. For the images with masses, there are 204 malignant images and 180 benign images. All the mammograms have pathological diagnosis report from the doctors.
Evaluation standard
In image retrieval research, precision and recall are commonly used to evaluate the query results [34]. Precision P and recall R can be calculated by Equation (10) and Equation (11) based on the number of mammograms in image set S and T. T is the expected image set which is from the expected ranking sequence offered by the experienced radiologists, containing those similar images confirmed by the doctors. S is the retrieved image set obtained by our experiment.
In the experiment, it is found that there is a reciprocal inertia between the precision and recall. If increasing the precision, the recall will reduce. Combining precision and recall can get better retrieval performance [35], so a comprehensive evaluation index F is proposed as shown in Equation (12).
However, we notice that the similarity retrieval result is sensitive to image return order. Thus, we use the regularized precision P′ and the regularized recall R′ [36] as shown in Equation (13) and Equation (14).
Thus, regularized precision P′, regularized recall R′, and comprehensive evaluation index F are used as the evaluation standard. The average of these indexes are the experiment results.
In the experiment, one mammogram is chosen as the query image and the other mammograms are the dataset images. The top 15 most similar images will be obtained by the similarity retrieval algorithm and the results are the average of 20 repeated experiments.
We conduct five experiments to compare retrieval results. In experiment A, the content features, location features, and three kinds of deep features are used separately for image retrieval. In experiment B, the content features and location features are fused by weight. The best result of experiment B is named result-better (RB). In experiment C, D, and E, three kinds of deep features are fused with RB respectively by weight.
To compare the fusion results clearly, similarity fusion is conducted between two kinds of features in turn and the weight ranges from 0% to 100%. Thus, when setting the weight of one feature similarity as A%, the other one is (100-A)%.
Experiment results
The result of experiment A is shown in Table 1, which is the comparison retrieval results using content features, location features, and three kinds of deep features separately.
Experiment B is the retrieval results fusing content features and location features, as shown in Table 2. We set the weight of content feature similarity LC as A% and the weight of the location feature similarity LP is (100-A)%. In Table 2, A% is set to 0, 0.2, 0.4, 0.6, 0.8, and 1. We find that when the weight of content feature similarity is 0.6 (A%=0.6), the result performs better in recall, precision, and index F. This result is the result-better (RB).
In experiment C, D, and E, three kinds of deep feature similarities are fused with RB respectively. The weight of content and location feature similarity is set to A% and the weight of the deep feature similarity is (100-A)%. A% is set to 0, 0.2, 0.4, 0.6, 0.8, and 1. Table 3 shows the result fusing content features, location features, and CNN deep features. Table 4 shows the result fusing content features, location features, and DBN deep features. Table 5 shows the result fusing content features, location features, and SAE deep features.
Similarity retrieval results based on content, location and deep features
Similarity retrieval results based on content, location and deep features
Similarity retrieval results of breast images fusing content and location features
Similarity retrieval results of breast images fusing CNN
Similarity retrieval results of breast images fusing DBN
Similarity retrieval results of breast images fusing SAE
Fig. 6 shows some retrieved mammogram examples of experiment C, D, and E. The query image is Fig. 2 (b). Fig. 6 (a) is five examples of retrieval return results, which are the top 5 most similar images fusing the content features, location features, and CNN deep features. Fig. 6 (b) is the example of fusing DBN deep features and Fig. 6 (c) is the example of fusing SAE deep features.
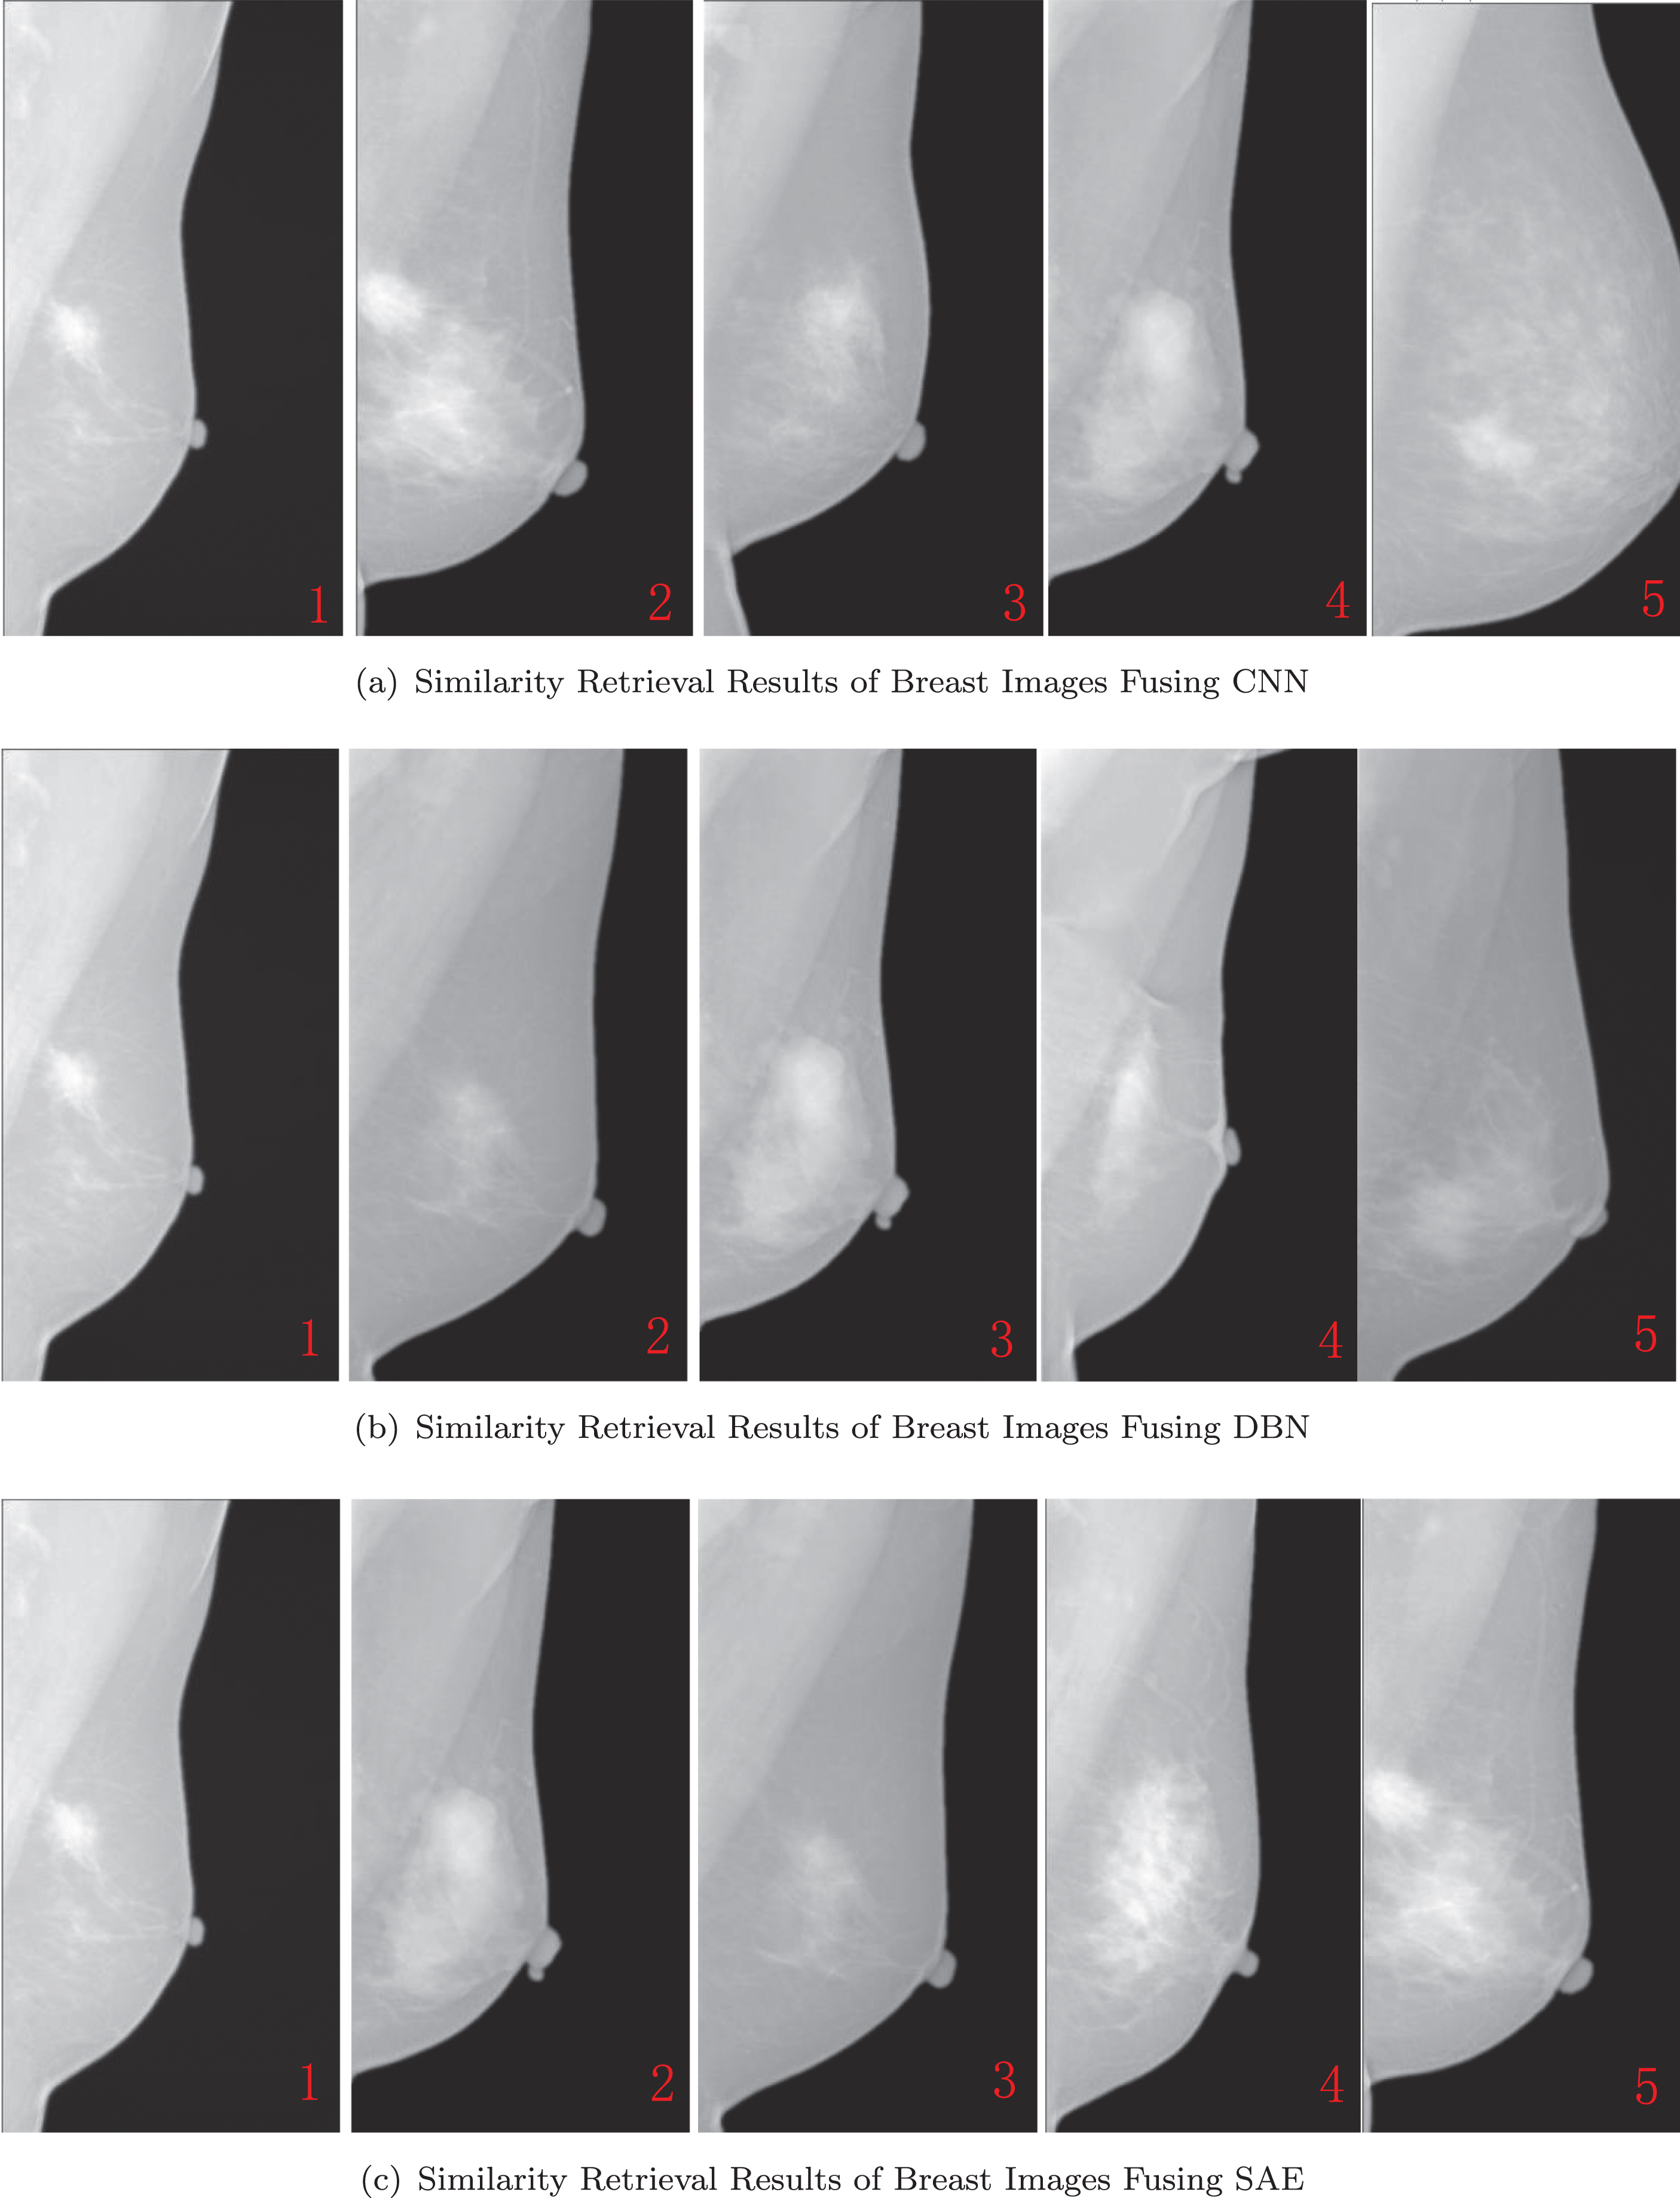
Examples of similarity retrieval results fusing deep features.
Table 1 shows the evaluation indexes of image similarity retrieval based on the content features, location features, CNN deep features, SAE deep features, and DBN deep features respectively. When only using content feature similarity, the average precision is 0.653, recall is 0.810, and index F is 0.723. When only using DBN deep feature similarity, the average precision is 0.673, recall is 0.824, and index F is 0.741. These two cases (only content feature or only DBN deep feature) are better than the other three cases in average recall, average precision, and index F.
Also, when only using location feature similarity, the average precision is 0.616, recall is 0.741, and index F is 0.673. When only using SAE deep feature, the average precision is 0.596, recall is 0.743, and index F is 0.661. There is little difference between the location-based similarity retrieval and the SAE-based similarity retrieval in evaluation indexes.
Table 2 shows the evaluation indexes of image similarity retrieval fusing content features and location features. When the weight of content feature similarity is 0.6 (A % =0.6), the average precision is 0.684, recall is 0.807, and index F is is 0.741. This result is better than the other five weight cases and it is used as RB (A % =0.6).
Tables 3, 4, and Table 5 shows the evaluation indexes of image similarity retrieval fusing CNN deep feature, DBN deep feature, and SAE deep feature, based on RB. Table 3 shows that when RB = 0.8, the average precision is 0.687, recall is 0.809, and index F is 0.743, which is better than the other weight cases. Table 4 shows that when RB = 0.4, the average precision is 0.745, recall is 0.850, and index F is 0.794, which is better than the other weight cases. Table 5 shows that when RB = 0.6, the average precision is 0.695, recall is 0.812, and index F is 0.749, which is better than the other weight cases.
Comparing all these five tables, we find that when fusing the content features, location features, and DBN deep features (weight of content and location feature similarity is 0.6; weight of DBN deep feature similarity is 0.6), image retrieval has the best performance in evaluation indexes. The average precision is 0.745, recall is 0.850, and index F is 0.794.
Conclusion
Mammography is one of the most important method for breast cancer examination. In clinic, radiologists sometimes may consult some previous diagnosis cases as a diagnosis reference, but searching for similar mammograms from many previous cases is a big project. Mammogram retrieval can help radiologists to search for those similar mammogram cases quickly.
A similarity measure method fusing deep feature for mammogram retrieval is proposed in this paper. After image processing, low-level features are extracted based on GLCM, Tamura, Hu Moment Invariants, and Gray Level Histogram. Also, three kinds of deep features are extracted including CNN, DBN, and SAE. Then, the content feature similarity, location feature similarity, and deep feature similarity are calculated separately. Finally, the mammogram similarity retrieval is obtained. Comparing with different weight parameter A, a series of experiments are performed and we find the best result.
The main contributions of this paper can be summarized as follows. A fusion feature model based on low-level features and deep features is constructed. The low-level features are extracted based on GLCM, Tamura, Hu Moment Invariants, and Gray Level Histogram. The deep features include CNN, SAE, and DBN feature. A similarity measure method based on fusing deep features is proposed. First, the deep features are extracted based on CNN, SAE and DBN. Then, Euclidean distance is used to calculate deep feature similarity. Next, the deep feature similarity, location feature similarity, and content feature similarity are fused to obtain the image fusion similarity. Experiments are carried out based on real data of 740 mammograms of women from Northeast China and the method proposed in this paper is verified validity. Compared with content-based image retrieval and location-based image retrieval, the method proposed in this paper have obvious advantages in precision and recall. When fusing 60% DBN deep feature similarity and 40% low-level feature similarity, the results are best. At this time, the average precision is 0.745, recall is 0.850, comprehensive evaluation index is 0.794.
Disclosure statement
The work described has not been published previously in any form. All authors declare that they have no competing interests. There are no financial or personal relationships with other people or organisations that could inappropriately influence our work.
Funding
This work was supported in part by the National Natural Science Foundation of China (Nos. 61472069, 61402089 and U1401256), China Postdoctoral Science Foundation (Nos. 2019T120216 and 2018M641705), the Fundamental Research Funds for the Central Universities (Nos. N161602003, N180408019 and N180101028), the CETC Joint Fund, the Open Program of Neusoft Institute of Intelligent Healthcare Technology, Co. Ltd. (No. NIMRIOP1802), and the fund of Acoustics Science and Technology Laboratory.