
Abstract
OBJECTIVE:
To evaluate the changes of maxillary expansion and upper airway structure after microimplant assisted rapid palatal expansion (MARPE) using cone-beam computed tomography (CBCT).
METHODS:
This retrospective study included 19 subjects (15 females and 4 males) aged 15–29 years old (mean, 19.95±4.39 years) with maxillary transverse deficiency treated with MARPE. CBCT was performed at the initial diagnosis and 3 months after MARPE treatment. Measurements were taken to evaluate the amount of total expansion, skeletal expansion, and dental expansion at the maxillary first premolar (P1), second premolar (P2), first molar (M1), second molar (M2) regions and upper airway changes.
RESULTS:
After MARPE treatment, the maxillary skeletal base expansion, skeletal expansion, alveolar expansion and dental expansion were achieved at the P1, P2, M1, M2 region. The nasopharyngeal volume significantly increased 8.48% after MARPE treatment compared with that before the treatment (P < 0.05). The change of nasal lateral width (NLW) was also significantly different before and after MARPE (P < 0.05). However, there were no statistically significant change in the oropharyngeal, palatopharyngeal, glossopharyngeal and airway total volume (all P > 0.05).
CONCLUSIONS:
MARPE can produce more transverse bone expansion, relieve maxillary transverse deficiency and improve upper airway ventilation.
Keywords
Introduction
Maxillary transverse deficiency is a common malocclusion, with the incidence rate of 21% in children and 10% in adults [1]. It is often accompanied by unilateral or bilateral posterior crossbite, dental crowding, high arch of palatal pand narrow nasal cavity, which can lead to masticatory pronunciation disorders and jaw dysfunction, affecting the health of oral and maxillary face and facial aesthetics. Maxillary transverse deficiency can cause airway stenosis and other complications due to posterior lingual displacement, and studies have reported that it is one of the pathological of Obstructive Sleep Apnea Syndrome (OSAS) [2].
Rapid maxillary expansion (RME) is the conventional method for the treatment of maxillary transverse deficiency, it can effectively widen the maxilla of children by applying a fast transverse force to the maxillary teeth to open the midpalatal suture, thus relieving the transverse deformity of the maxilla. For no growth potential youth or adult patients, due to the midpalatal suture gradually transforms from fibrous union to osseous fusion enlarging expansion resistance, the traditional RME is difficult to expansion of the middle palatal suture, also can produce some side effects such as posterior teeth elongation, buccal inclination, root resorption, fenestration of the buccal cortex and gingival recession [3]. Therefore, some scholars suggested that the traditional RME is thought to be less effective for adult patients (>15 years), who are recommended with surgically-assisted rapid palatal expansion (SARPE) [4]. However, many adult patients were discouraged from choosing this treatment due to the invasive nature, risks, complications and cost of the surgical procedure [5, 6].
The introduction of the Microimplant Assisted Rapid Palatal Expansion (MARPE) appliances provided a new alternative treatment modality for clinicians and adolescent patients with maxillary transverse deficiency, it had greater orthopedic effects in correct transverse maxillary deficiency and less dental side effects than traditional RME [7, 8]. However, there was a lack of literature about the changes of maxillary palatal suture and alveolar bone, and upper airway structure. The objective of this study was to evaluate the changes of maxillary palatal suture and alveolar bone, and upper airway structure that occurred immediately after maxillary skeletal expansion, a MARPE appliance, using cone-beam computed tomography (CBCT).
Materials and methods
Subjects
This study was approved by the Institutional Review Board of Xiangya Stomatological Hospital, Central South University (No.20140003) and informed consent was obtained from subjects or their parents. A total of 35 patients underwent MARPE at the Department of Orthodontics, Xiangya Stomatological Hospital, Central South University between February 2014 and February 2018 were studied. Among them, 2 patients had history of orthodontics, 1 patient had systemic diseases, 6 patients failed to MARPE expansion, 7 patients had no imaging data after treatment. Thus, 19 subjects (15 females and 4 males) aged 15–29 years old (mean, 19.95±4.39 years) were included in the study of the bone changes. Then, 6 patients with narrow visual field CBCT were excluded, due to three-dimensional (3D) upper-airway changes could only be performed with the large-field Cone beam computed tomography (CBCT) image data. Finally, 13 patients (3 males and 10 females), aged 15–29 years old (mean, 19.61±5.25 years) were included in the study of the upper airway changes.
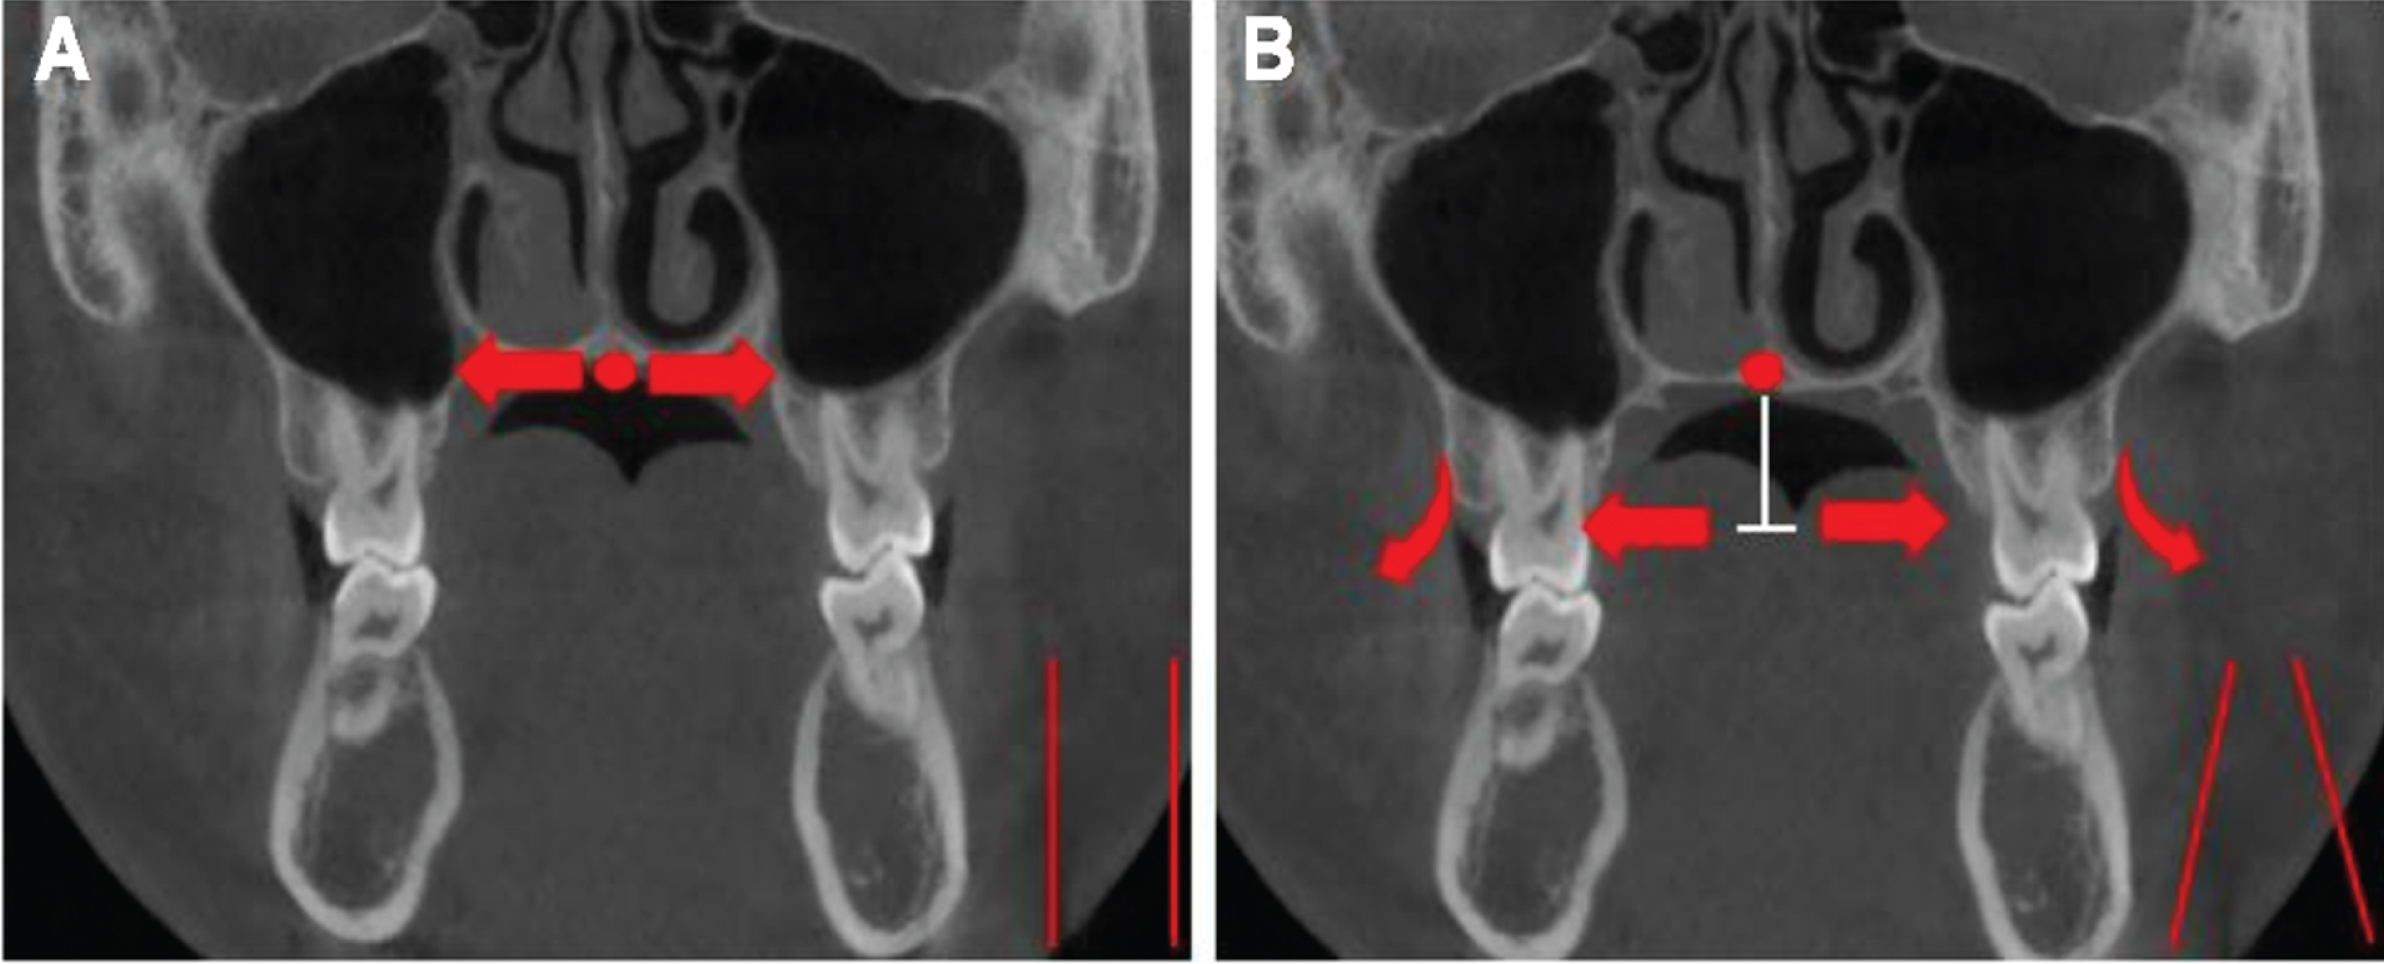
The inclusion criteria were: (1) Patients who with the maxillary skeletal base width less than skeletal base width, need to perform osseous expansion and bowing; (2) patients had good oral hygiene and periodontal condition; (3) during maxillary expansion, or before and after maxillary expansion, patients had no history of orthodontics, maxillofacial trauma or respiratory tract therapy; (4) patients had no systemic diseases, pathological damage of maxillary bones, cleft lip and palate, and other maxillofacial deformity; (5) did not take long-term drugs that affect bone metabolism, such as glucocorticoid drugs, antiepileptic drugs, antituberculosis drugs, thyroid hormone heparin; (6) hand and wrist X-ray shown bone growth to maturity in adolescents or adults; (7) patients with successful maxillary expansion, that the criteria was a diastema were observed betwen the incisor after the initiation of maxillary expansion or CBCT examination after expansion for three months showed that the midpalatal suture was wider than that before expansion (Fig. 1); (8) patients had follow-up imaging data.
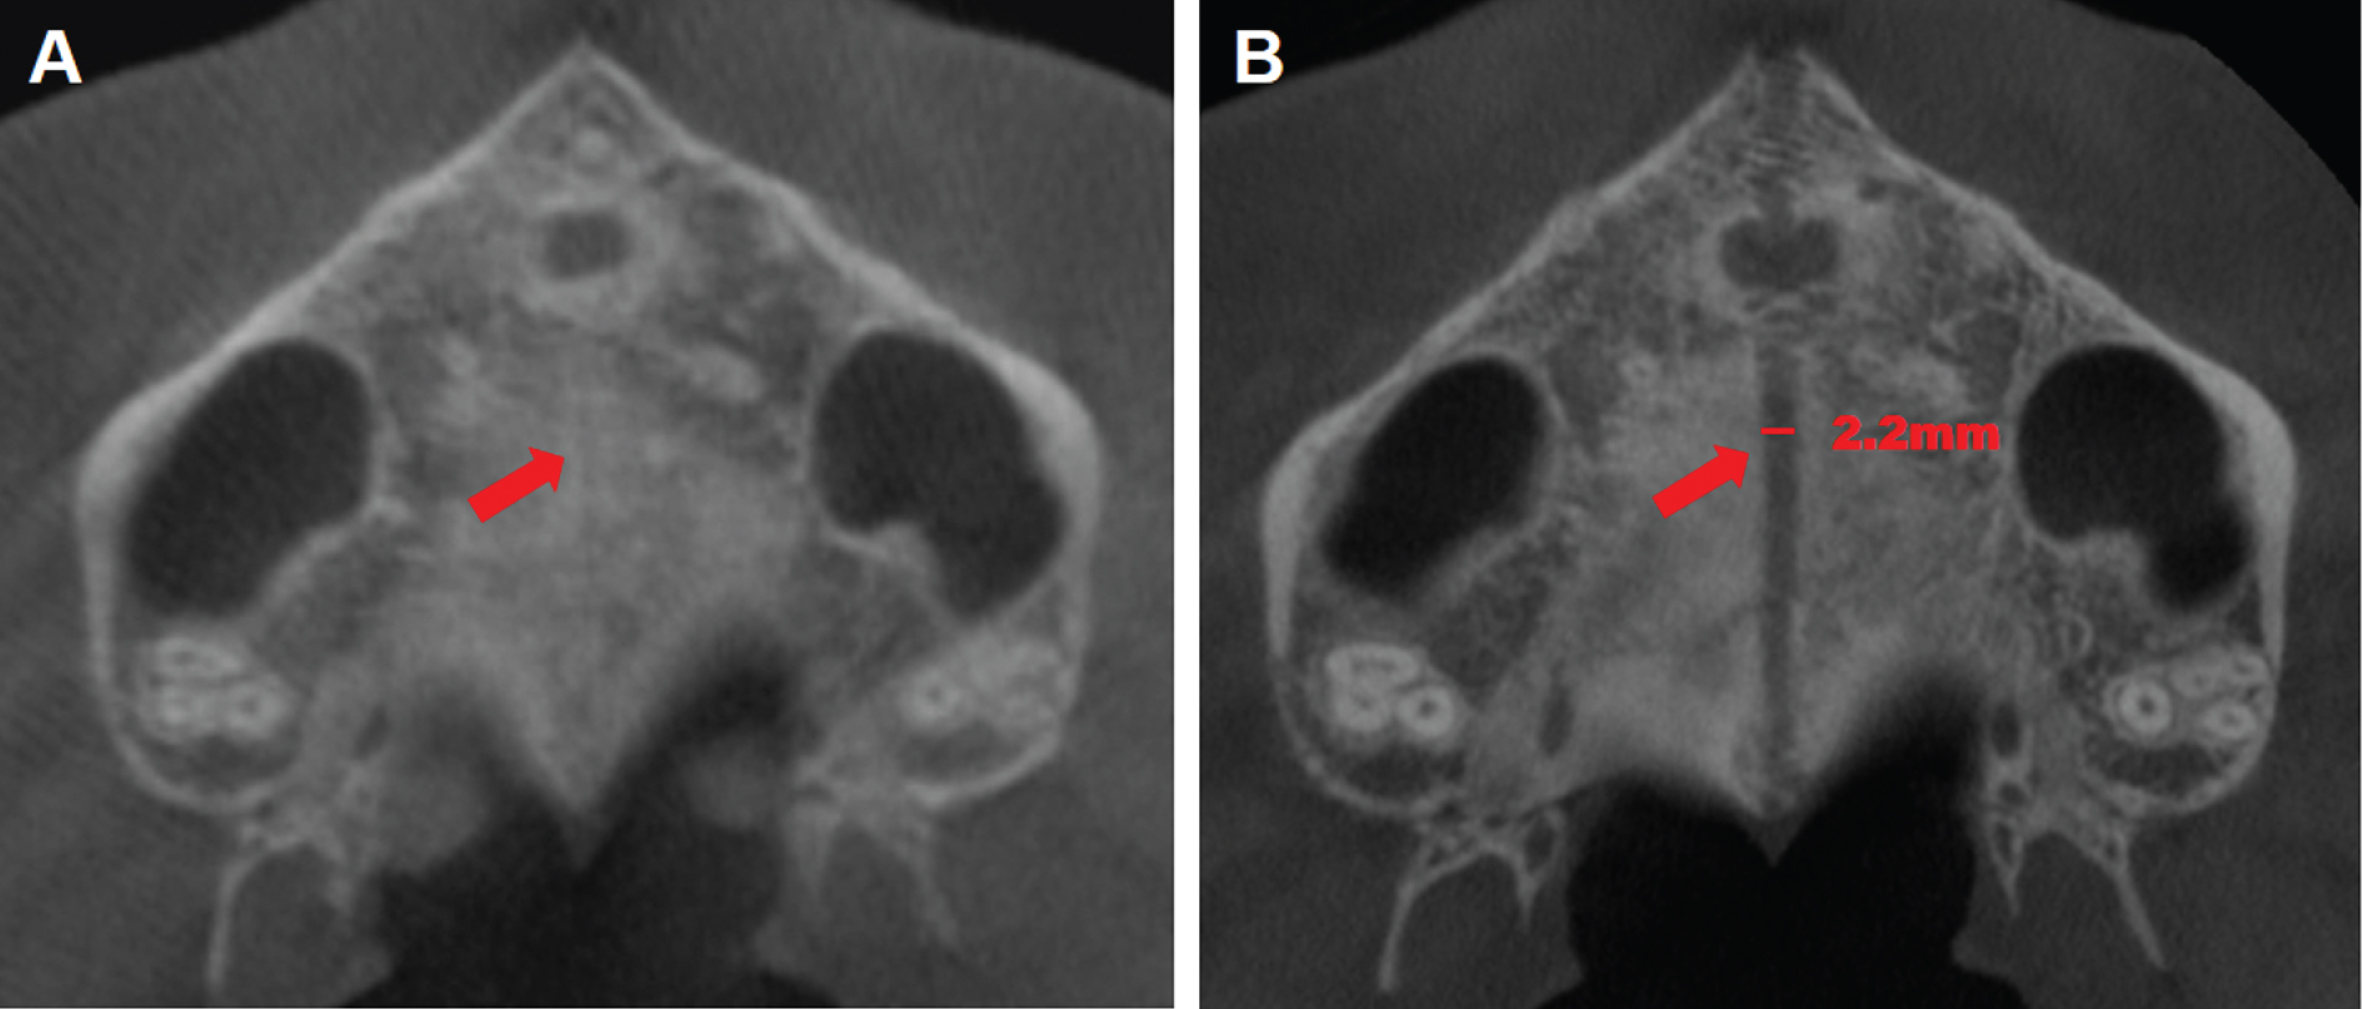
CBCT examination of midpalatal suture (A) Before MARPE, CBCT showed no obvious bone suture in the midpalatal suture. (B) Three months after expansion, CBCT examination showed the midpalatal suture was wider than before expansion. MARPE, microimplant assisted rapid palatal expansion; CBCT, cone-beam computed tomography.
The miniscrews were implanted at the junction of the palatal margin between the maxillary cusp and the first premolars, the palatal margin between the second premolars and the first molars to 1/3 of the middle palate suture. The placement of 4 miniscrews (Ormco VectorTAS) with a 1.4 mm (1.6 mm) collar diameter and 8 mm (12 mm) length should be relatively placed parallel and symmetrical to the mid-palatal suture. The palatal bracket implant anchorage arch expander was made after operation without swelling in the operation area (Fig. 2). Maxillary expansion was initiated the day after placement of the MARME appliance, which was activated twice a day (0.25 mm/turn) for 14 days until the required expansion was achieved 7 mm. Patients were instructed how to activate the expansion at the same time every day, interval 12 hours.
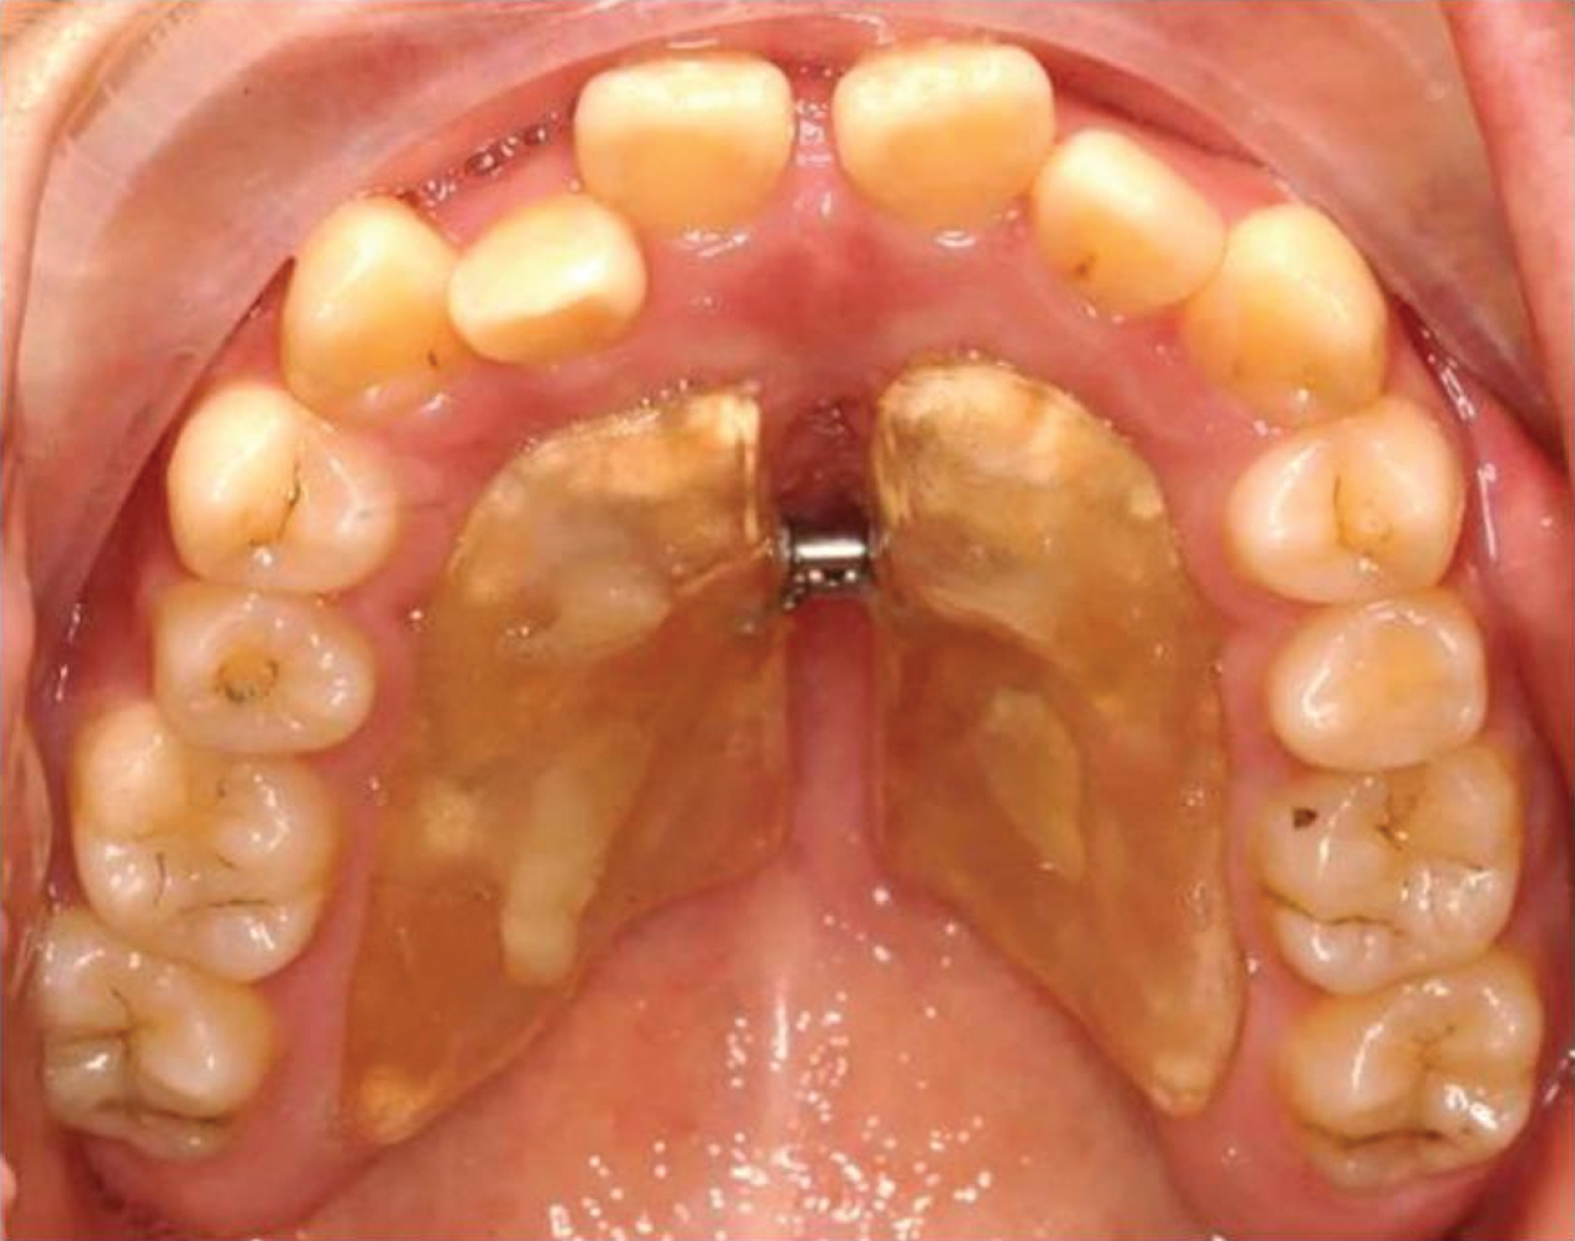
The palatal bracket implant anchorage arch expander was made after operation without swelling in the operation area.
CBCT was performed at the initial diagnosis and 3 months after the completion of expansion. The CBCT device (ProMax 3D, MaxPLANMECA Oy, Helsinki, Finland) was set at 10 mA and 96 kV, and images were captured for 12 s with 360° acquisition. The scans were taken with the patients in upright position. Patients were instructed to sit up keeping the Frankfort plane paralleled to the ground and clenching on intercuspal position during scanning. All subjects were asked to occlude in the centric occlusion, breathe smoothly and not to swallow. The Dicom files were extracted from the CBCT disks. All documents were then introduced to the Dolphin 11.9 software (Solutions, USA). The three dimensional model was then adjusted based on these reference planes according to the study of Glupker et al. [9] (Fig. 3).
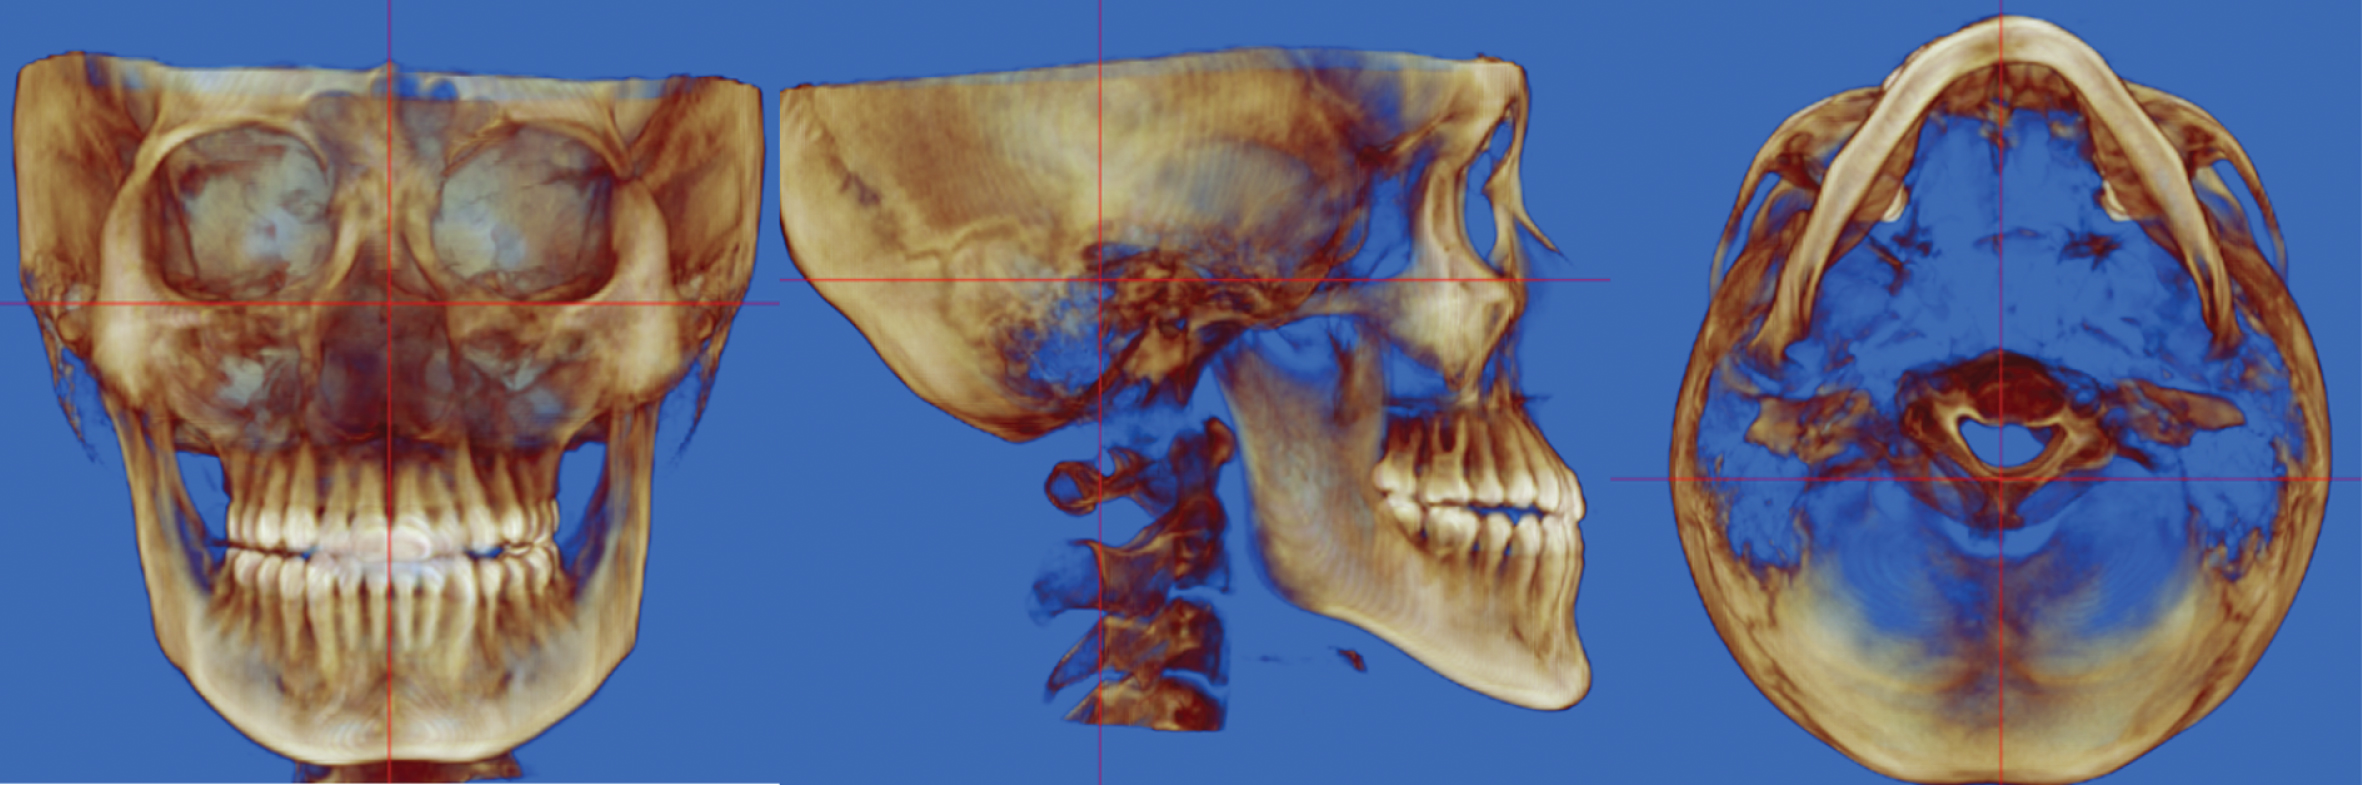
Expansion measurements were performed by CBCT: correction of head position: mid-sagittal plane, frankfort plane; coronal plane. CBCT, cone-beam computed tomography.
The lateral maxillary expansions of the first premolars (P1), the second premolars (P2) and the first molars (M1), the second molars (M2) were measured by Dolphin 11.9 software. Transverse skeletal expansion was evaluated at the suture and with linear measurements at three different levels: nasal floor (NF), hard palate (HP), and hard palate below 5 mm (HP5), as Fig. 4 showed as following: NF indicates maxillary width tangent to the nasal floor at its most inferior level; HP, maxillary width tangent to the hard palate at the most inferior level; HP5, maxillary width parallel to the line NF and 5 mm below the line HP; MW, midpalatal width; and BC, distance between buccal cusps. The effects of arch expansion include skeletal effect, alveolar effect and dental effect. According to the following formula, the skeletal, alveolar and dental expansion after MARPE were calculated: the Δ represents the difference of each index before and after expansion, total expansion =ΔBC, skeletal expansion =ΔMW, alveolar expansion =ΔHP5-ΔMW, dental expansion =ΔBC-ΔHP5 [10].

CBCT measurement of maxillary expansion of (A) the first premolars (P1), (B) the second premolars (P2), (C) the first molars (M1), (D) the second molars (M2). NF indicates maxillary width tangent to the nasal floor at its most inferior level; HP, maxillary width tangent to the hard palate at the most inferior level; HP5, maxillary width parallel to the line NF and 5 mm below the line HP; MW, midpalatal width; and BC, distance between buccal cusps. CBCT, cone-beam computed tomography.
Measurement of upper airway volume
The upper airway consists of three parts: nasopharynx, oropharynx and laryngopharynx; oropharynx is divided into palatopharynx and glossopharynx. The airway volume was measured using Dolphin 11.9 software according to the study of Guijarromart et al [11], the boundaries of airway were shown in Fig. 5. The boundary of airway was drawn on the midsagittal imaging, and the corresponding airway volume will be automatically calculated by Dolphin 11.9 software. The anterior limits of nasopharyngeal was the line which attached the point sella (S) and posterior nasal spine (PNS), the lower limits was the plane parallel to FH plane (Frankfort Horizontal plane) which attached the posterior nasal spines (PNS) to the cervical vertebra parallel to the FH plane, called PNS palate (Fig. 5A). The palatopharynx was located between PNS plane at the top and horizontal line, which passed through the most inferior-posterior point of the soft palate, called soft palate (SP) (Fig. 5B). The lower segment (glossopharynx) was located between the SP plane at the top and C3pi plane at the bottom, which through the plane of the last lower point of the third cervical vertebra parallel to the FH plane (Fig. 5C). The oropharynx was defined as the volume of the airway between the PNS plane and C3pi plane (Fig. 5D). These points were selected due to they are stable bone markers, as well as their clear CBCT image in the sagittal plane. The total airway volume was the sum of the airway volumes (Fig. 5E). The volume of the airway as well as the cross sectional area for the PNS, SP and C3pi planes were determined using Dolphin 11.9 software.

Measurement of upper airway volume using Dolphin 11.9 software. (A) nasopharyngeal volume (NPV), (B) palatopharyngeal volume (PPV), (C) glossopharyngeum volume (GPV), (D) oropharyngeal volume (OPV), (E) total airway volume (TV). PNS plane: The plane parallel to Frankfort Horizontal (FH) plane through the PNS point; SP plane: through the bottom of the soft palate parallel to the FH plane; C3pi plane: through the plane of the last lower point of the third cervical vertebra parallel to the FH plane. S: sella point; PNS: posterior nasal spines point.
The area was measured by Dolphin 11.9 software. After measuring the volume of an upper airway, the system would calculate the minimum cross-sectional area of the airway by moving two red lines through the function of “Enable Minimu Axial Area”. In the cranial axial view, the cross-section of each axis of the upper airway could be displayed and adjusted to the interface of each segment of the upper airway, therefore the cross-section area of each interface could be obtained as shown in Fig. 6. Measurement indicators include minimum oropharyngeal cross-section area (MOPA), minimum palatopharyngeal cross-section area (MPPA), minimum glossopharyngeum cross-section area (MGPA), PNS plane cross-section area (PNSA), SP plane cross-section area (SPA), and C3pi plane cross-section area (C3piPA).
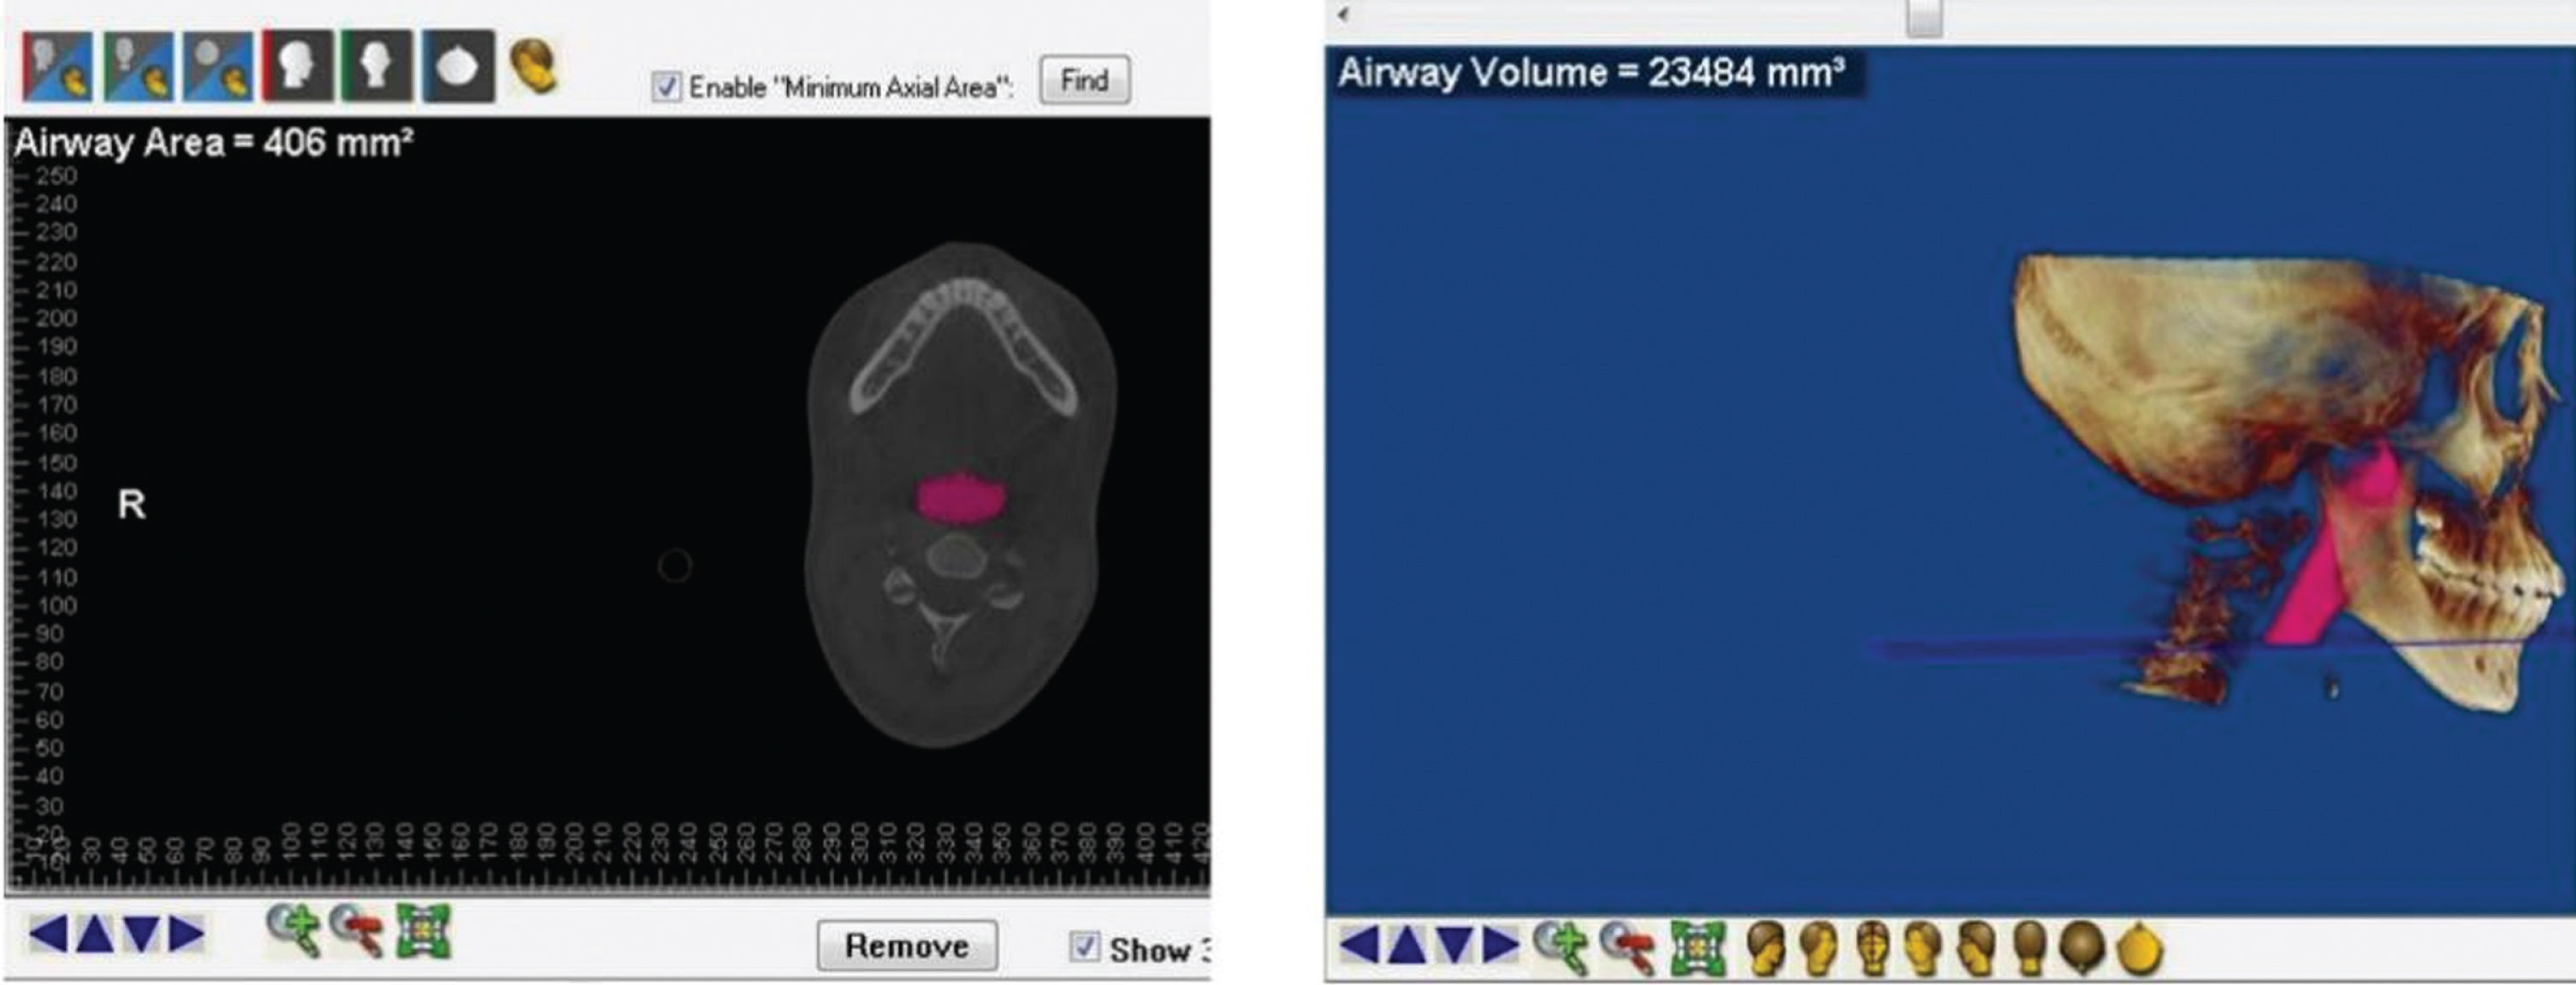
In the cranial axial view, the cross-section of each axis of the upper airway could be displayed, pink area represent the measured upper airway.
The indexes include nasal lateral width (NLW), coronary-level lateral NLW at P1 region (P1NLW), coronary-level lateral NLW at P2 (P2NLW) region, coronary-level lateral NLW at M1 region (M1NLW), coronary-level lateral NLW at M2 region (M2NLW) were measured.
Statistical analysis
All parameters were measured by an experienced orthodontist in a certain period of time. Then all images were remeasured two weeks later. Intraclass correlation coefficient (ICC) was used to test the intrareliability. If the ICC was equal to or greater than 0.75, the mean values of the two measurements were calculated and presented as the final results. Or the process would have been repeated two weeks later. The obtained data were statistically analyzed by SPSS 22.0 software (SPSS Inc., Chicago, IL, USA), and the measurement data results were expressed by mean standard deviation (SD). The normality and homogeneity of variance of the samples were tested. Quantitative data conforming to normal distribution were tested by paired t-test and non-parametric test for data of non-normal distribution. Paired t-test was used to analyze the effectiveness of the treatment. A P-value of 0.05 indicated a statistically significant difference.
Result
Maxillary skeletal base expansion
As Table 1 shown, after MARPE treatment, MW, NF, HP, HP5 increased at the region of P1, P2, M1 and M2 compared with that before treatment, and the differences were statistically significant (all P < 0.05), which indicated maxillary skeletal base expansion; the BC width increased by 3.14 mm, 3.61 mm, 3.92 mm and 3.62 mm respectively at the region of P1, P2, M1 and M2, and the differences were statistically significant (all P < 0.05).
The transverse width varies of maxillary skeletal base after MARPE treatment (n = 19)
The transverse width varies of maxillary skeletal base after MARPE treatment (n = 19)
*P < 0.05, **P < 0.01. Δ represents the difference of each index before and after expansion. P1, maxillary first premolar; P2, maxillary second premolar; M1, maxillary first molar; M2, maxillary second molar. MW midpalatal width; NF, nasal floor; HP, hard palate; HP5, hard palate below 5 mm; BC, buccal cusp.
After MARPE treatment, the increasing of MW and HP5 at the region of P1, P2, M1 and M2 compared with that of before treatment was decreased in turn (all P < 0.05), which indicated bone expansion was larger in front than in the back (Table 2). At the P1, P2, M1 and M2 regions, there was no statistically significant difference in terms of ΔNF, ΔHP and ΔHP5 (P > 0.05), that indicated the coronal plane expansion similar to the parallel expansion (Table 3).
The transverse width varies of maxillary skeletal base in P1, P2, M1, M2 area after MARPE treatment (n = 19)
*P < 0.05. Δ represents the difference of each index before and after expansion. MARPE, microimplant assisted rapid palatal expansion; P1, maxillary first premolar; P2, maxillary second premolar; M1, maxillary first molar; M2, maxillary second molar. The Δ represents the difference of each index before and after arch expansion. MW midpalatal width; HP5, hard palate below 5 mm.
The comparison of basal bone expansion after MARPE treatment (n = 19)
Δ represents the difference of each index before and after expansion. MARPE, microimplant assisted rapid palatal expansion; P1, maxillary first premolar; P2, maxillary second premolar; M1, maxillary first molar; M2, maxillary second molar. The Δ represents the difference of each index before and after arch expansion. NF, nasal floor; HP, hard palate; HP5, hard palate below 5 mm.
The bone expansion from P1, P2, M1 and M2 gradually reduced and were 2.19 mm, 1.45 mm, 1.25 mm, 0.93 mm, respectively, with significant difference (P < 0.05). Meanwhile, there were significant difference in term of dental expansion (Table 4). The above indicated that the amount of palatal suture bone expansion successively decreases from front to back, and the amount of dental expansion was not identical in different dental positions.
The total expansion, bone expansion, alveolar expansion and dental expansion after MARPE treatment (n = 19)
*P < 0.05. MARPE, microimplant assisted rapid palatal expansion; P1, maxillary first premolar; P2, maxillary second premolar; M1, maxillary first molar; M2, maxillary second molar.
Bone expansion, alveolar expansion, dental expansion accounted for 73.00%, 26.00% and 1.00 of the total expansion respectively at P1 region. The bone expansion, alveolar expansion, dental expansion accounted for 40.17%, 21.61% and 38.22 of the total expansion at P2 region. Bone expansion, alveolar expansion, dental expansion accounted for 31.89%, 13.01% and 55.10% of the total expansion at M1 region. The bone expansion, alveolar expansion, dental expansion accounted for 25.76%, 21.05% and 53.19% of the total expansion respectively at M2 region.
The nasopharyngeal volume increased by 502 mm3 (8.48% ) after the MARPE treatment compared with that before treatment, and the difference was statistically significant (P < 0.05). While, there was no statistically significant change in the oropharyngeal, palatopharyngeal, glossopharyngeal and airway total volume (all P > 0.05). There was no significant difference in the minimum cross-sectional area of oropharynx, palatopharynx and glossopharynx, and change in the cross-sectional area of the PNS plane SP plane and the C3pi plane after the MARPE treatment compared with that before the treatment (all P > 0.05). After MARPE treatment, compared with that before treatment, NLW increased by 1.63 mm (6.61% ), P1NLW increased by 3.00 mm (8.76% ), P2NLW increased by 1.48 mm (3.72% ), M1NLW increased by 1.54 mm (3.33% ), and M2NLW increased by 1.35 mm (3.11% ), all with statistically significant differences (all P < 0.01) (Table 5).
Changes in the airway volume, cross-sectional area of the upper airway and nasal width after MARPE treatment (n = 13)
Changes in the airway volume, cross-sectional area of the upper airway and nasal width after MARPE treatment (n = 13)
*P < 0.05, **P < 0.01. Δ represents the difference of each index before and after expansion. MARPE, microimplant assisted rapid palatal expansion; NPV, nasopharyngeal volume; OPV, oropharyngeal volume; PPV, palatopharyngeal volume; GPV, glossopharyngeum volume; TV total airway volume; MOPA, minimum oropharyngeal cross-section area; MPPA, minimum palatopharyngeal cross-section area; MGPA, minimum glossopharyngeum cross-section area; PNSA PNS plane cross-section area; SPA, SP plane cross-section area; C3piPA, C3pi plane cross-section area; The coronary-level lateral NLW at the maxillary first premolar (P1), maxillary second premolar (P2), maxillary first molar (M1), maxillary second molar (M2) region were measured and recorded as NLW, P1NLW, P2NLW, M1NLW, M2NLW.
Recent development of three-dimensional (3D) volumetric imaging, CBCT and 3D reconstruction software programs [12, 13] allow clinicians and researchers to clearly visualize the internal osseous structures and accurately measure changes throughout the basal bone of the maxilla and the adjacent facial structures [14]. Thus, this study was conducted to evaluate MARPE treatment effects on structural changes of palatal suture, upper airway and maxillary alveolar bone.
The expansion is an important index for evaluating the effect of dental arch expansion. In this study, we believed that the greater the amount of bone expansion, the better the bone effect of arch expansion. After MARPE treatment, the total expansions respectively were 3 mm, 3.61 mm, 3.92 mm, and 3.61 mm, the bone expansions were 2.19 mm, 1.45 mm, 1.25 mm and 0.93 mm at the P1, P2, M1 and M2 regions, respectively. The bone expansions accounted for 73.00%, 40.17%, 31.89% and 25.76% of the total expansions. Lim et al. [15] reported that after MARPE the bone effect accounted for 39.1%, and Park et al. [16] reported it accounted for 37.0%, which were similar to our results. Weissheimer et al. [17] and Kartalian et al [18] found that expansion effect of posterior teeth after the traditional RME were 39.2% and 40%, respectively, which were similar to our results and indicated the expansion effect after MARPE treatment similar to that after traditional RME. Lin et al. found 57.5% expansion after traditional RME, which higher than this study, while the age of expansion was 18.1±4.4 years, that was smaller than this study (19.85±1.05 years).
In this study, after MARPE treatment, the transverse expansion of the maxillary palatal suture from anterior to posterior was decreased showing a paralleled pattern (Fig. 7A), the amount of expansion of the maxillary alveolar bone HP5 was also gradually decreased. All the above might due to the greatest resistance to the midpalatal suture is located at bone suture between the posterior maxillary palate and the medial pterygoid plate, or it is related to posterior resistance of midpalatal suture when fusion of the palate suture in adolescent or young adult patients with no growth potential. The above expansion model of midpalatal suture was similar to previous studies about traditional RME [19, 20]. In addition, this results were similar to the study of Brunetto et al [21], while the midpalatal suture expansion tends to be more horizontal, which may be due to the fact that the implantation sites of miniscrews in this study were slightly ahead. In the traditional RME, the strength forced on the teeth with the impedance center located under the maxillary bone will cause the alveolar buccal to show a reverse “V” pattern expansion (Fig. 7B). In this study, we thought the closer the coronal plane extends from top to bottom, the less side effect of buccal inclination of alveolar bone caused by dental arch expansion. From top to bottom of coronal plane, there was little difference in alveolar expansion, which was close to horizontal expansion. It was due to the mini-screw directly forced on the impedance center of the maxillary bone, which greatly reduces the inclination force of the posterior tooth and makes the suture expansion more parallel, showing MARPE is superior to RME.
(A) Paralleled pattern: the MARPE treatment directly forces on the impedance center of the maxilla through the miniscrews, making the expansion of the bone seam more parallel (B) Reverse “V” pattern: the traditional RME forces on teeth, and the impedance center is located under the maxilla, thus the force causes buccal dentoalveolar inclination and an inverted V-shaped expansion. MARPE, microimplant assisted rapid palatal expansion; RME, Rapid maxillary expansion.
Maxillary stricture can cause complications such as posterior teeth occlusion and pharyngeal airway stricture. Studies have shown that traditional RME can increase the width and volume of nasal cavity [22–24]. However, there were few studies reported the changes of NLW after MARPE treatment. In this study, it was found that the NLW increased after MARPE treatment with statistically significant difference. Clement et al. [25] found that NLW increased by 2.6 mm after MARPE treatment, which was similar to our result. Scholars have different opinions on the findings of nasopharyngeal, oropharyngeal, palatopharyngeal and glossopharyngeal changes in traditional RME. For example, Zeng et al. [22] and Chang et al. [26] reported the nasopharyngeal volume did not increase after 4 months after RME, while some studies reported it increased after RME [27, 28]. The study showed that the nasopharyngeal volume (5922.61±1938.28 mm3) after MARPE treatment increased by 502 mm3 compared with that before treatment (6424.61±1798.58 mm3), indicating that the influence of MARPE on nasopharyngeal volume was consistent with most traditional RME. For oropharyngeal or palatopharyngeal volume, some studies found that it was increased without statistical significance after RME [22, 23], while some studies showed that it significantly increased after RME [26, 29]. In this study, there was no statistically significant change in oropharyngeal and palatopharyngeal volume after MARPE compared with that before treatment, which was the same as most traditional RME results.
looseness-1The velopharyngeal volume, oropharyngeal volume and total airway volume of 13 cases was decreased without statistically significant difference, which may be related to the elongation of posterior teeth and mandibular posterior rotation after expansion, also may due to the insufficient sample size. In addition, there was no significant difference in the minimum cross-sectional area of oropharynx, palatopharynx, glossopharynx, PNS, SP and C3pi after MARPE compared with that before treatment, which indicated it was possible not to improve the airway ventilation after expansion for patients with upper airway stenosis without nasal or nasopharyngeal stenosis. Airway stenosis may play a role in the pathology and physiology of OSAS, which could be relieved after MARPE in adult patients [30]. In this study, although no breathing test was conducted and no control group was set up due to ethical limitations, the results showed that the NLW and nasopharyngeal volume at coronal plane of P1, P2, M1 and M2 regions were wider after MARPE than before treatment, which is beneficial for patients with upper airway ventilation. In the future study, we will increase the sample size to confirm the results.
For adolescent or adult patients with the trend of midpalatal suture closure, the MARPE has the following advantages: (1) ambulatory surgery, implantation and removal of implants are simple and less invasive; (2) The expansion force directly acts on the impedance center of the maxilla rather than on the teeth through the miniscrews, which make the force more evenly distributed, so that the bone tissue on both sides of the upper palate is parallel expanded and the inclination of the alveolar bone is minimized; (3) Oral hygiene is easy to maintain, which reduces the stimulation of soft tissue by traditional occlusal pad arch expander. This study confirmed the above advantages of MARPE. Furthermore, in this study, by measuring no growth potential of the adolescent or adult patients after MARPE on the maxilla and airway 3D change showed: expansion of the posterior middle palatal suture, increase of lateral width of maxillary basal bone; the bony expansion of the middle palatal suture with a large “V” type expansion pattern; the expansion of the coronal surface from the upper to the lower maxillary basal bone with a parallel expansion pattern; the bone expansion was larger than dental expansion at P1 region; the dental expansion was larger than bone expansion at P2, M1 and M2; the volume and width of nasopharynx increased. Therefore, this study provided guidance for the treatment of maxillary stenosis in clinical practice and provided a basis for the design of correction plan for clinicians.
MARPE can produce more transverse bone expansion, relieve maxillary transverse deficiency and improve upper airway ventilation. For adult patients with nasal cavity and nasopharyngeal airway ventilation obstructed with maxillary transverse deficiency, MARPE can be priority considered.